. 2019 Nov 12;3(21):3181-3190.
doi: 10.1182/bloodadvances.2019000473.

Targeting cyclooxygenase by indomethacin decelerates progression of acute lymphoblastic leukemia in a xenograft model

Affiliations

Targeting cyclooxygenase by indomethacin decelerates progression of acute lymphoblastic leukemia in a xenograft model

Nina Richartz et al. Blood Adv. .

Abstract

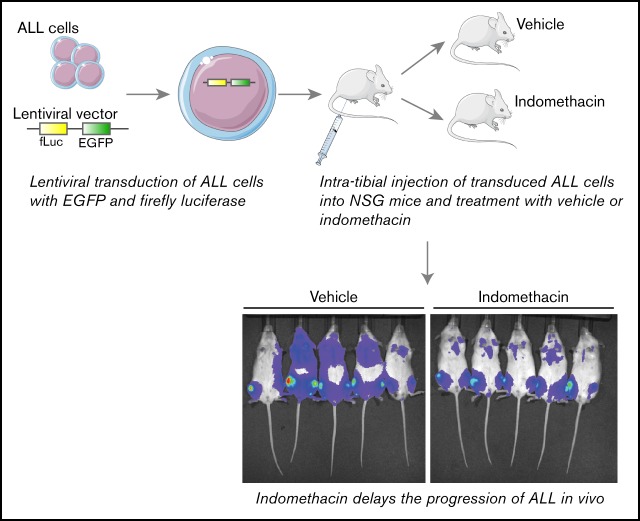
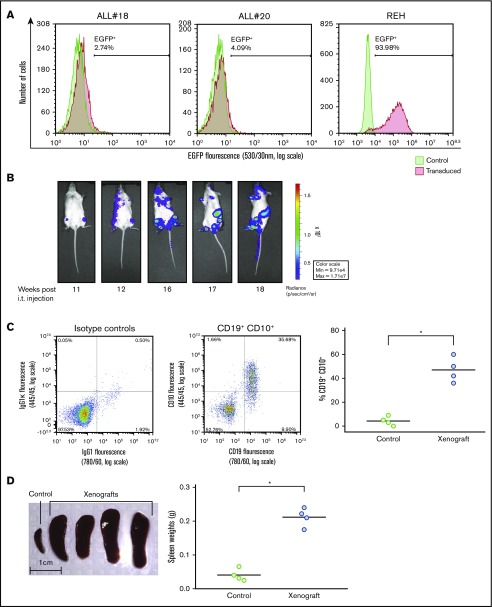
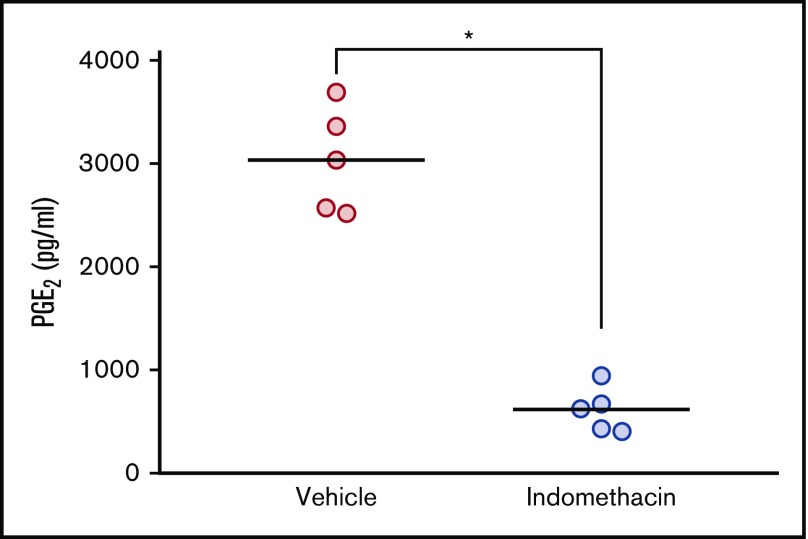
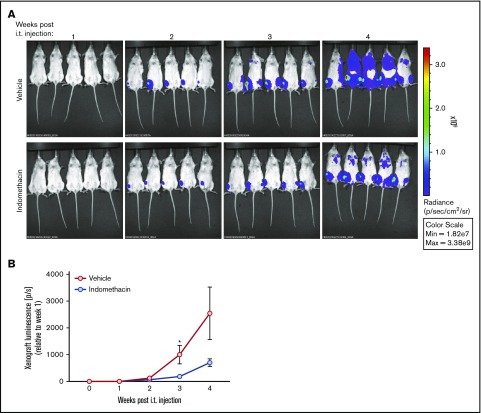
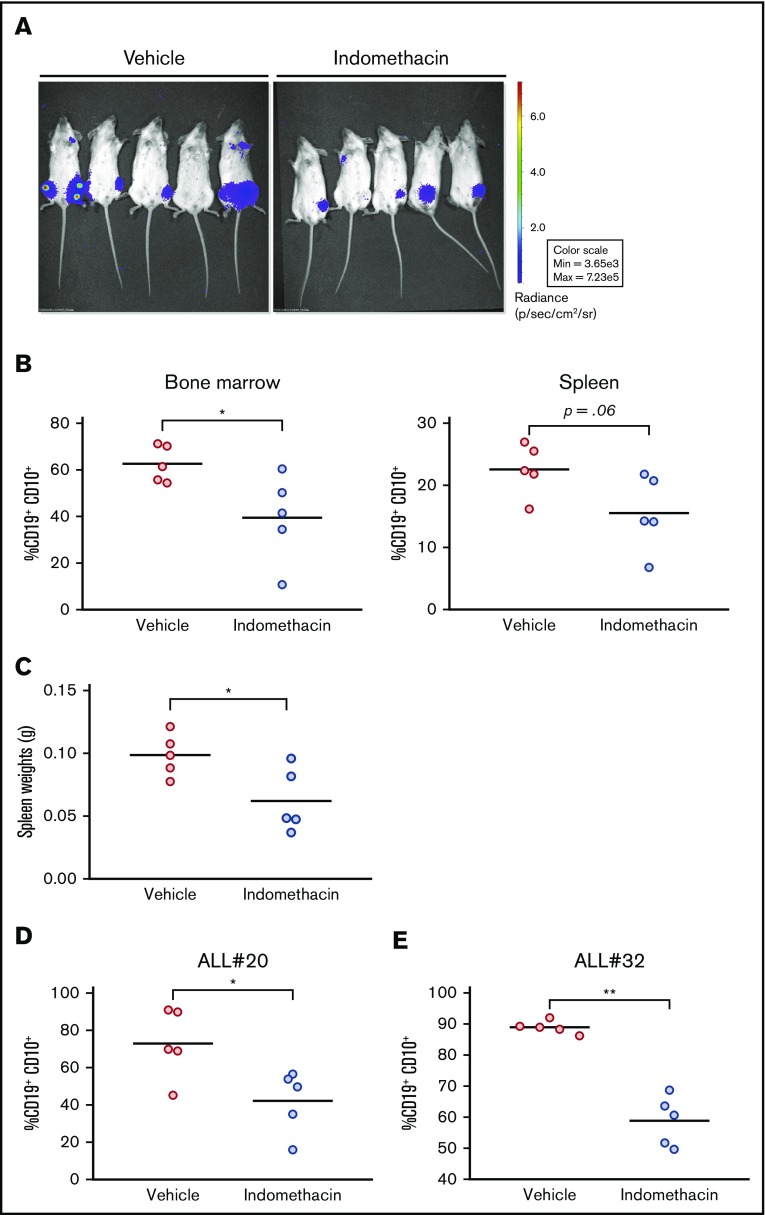
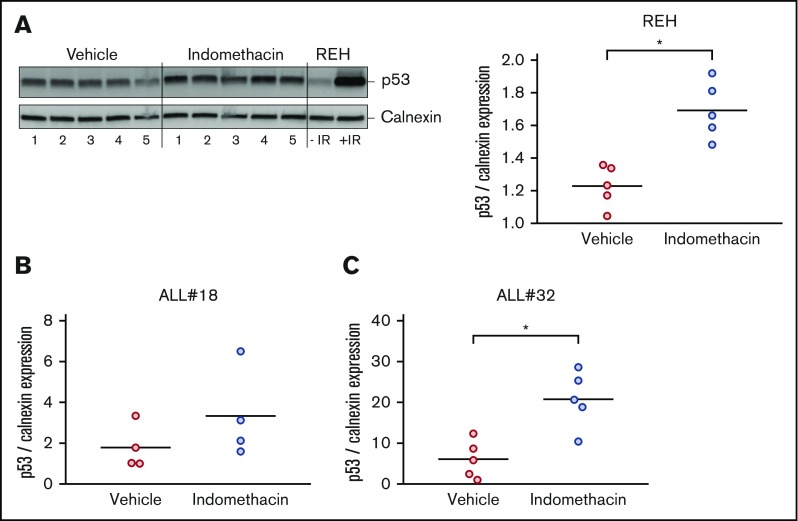
Acute lymphoblastic leukemia (ALL) develops in the bone marrow in the vicinity of stromal cells known to promote tumor development and treatment resistance. We previously showed that the cyclooxygenase (COX) inhibitor indomethacin prevents the ability of stromal cells to diminish p53-mediated killing of cocultured ALL cells in vitro, possibly by blocking the production of prostaglandin E2 (PGE2). Here, we propose that PGE2 released by bone marrow stromal cells might be a target for improved treatment of pediatric ALL. We used a xenograft model of human primary ALL cells in nonobese diabetic-scid IL2rγnull mice to show that indomethacin delivered in the drinking water delayed the progression of ALL in vivo. The progression was monitored by noninvasive in vivo imaging of the engrafted leukemic cells, as well as by analyses of CD19+CD10+ leukemic blasts present in spleen or bone marrow at the termination of the experiments. The indomethacin treatment increased the level of p53 in the leukemic cells, implying that COX inhibition might reduce progression of ALL by attenuating protective paracrine PGE2 signaling from bone marrow stroma to leukemic cells.


Conflict of interest statement

Conflict-of-interest disclosure: The authors declare no competing financial interests.

Figures

None
Graphical abstract
Figure 1.
Figure 1.
Establishment of xenograft model of ALL in NSG mice. (A) Lentiviral transduction efficiency of the pSLIEW vector into ALL#18, ALL#20, and REH cells was measured by flow cytometry analyses of EGFP fluorescence. (B-D) Four mice were IT injected with transduced ALL#18. (B) Progression of xenograft ALL#18 was followed by detection of luminescence intensity using noninvasive in vivo imaging, starting at 11 weeks after IT injection. (C) End point flow cytometry analysis of CD19+CD10+ leukemic cells in the bone marrow of xenograft ALL#18 mice. (Left) Dot plot presentation of CD19 vs CD10 expression of bone marrow cells from the mouse shown in panel B. (Right) The percentage of human CD19+CD10+ leukemic cells within the total bone marrow cell population of xenograft ALL#18 mice compared with noninjected (control) mice. Each circle represents the percentage of CD19+CD10+ cells in the bone marrow of 1 mouse. Horizontal lines represent the mean of each treatment group, *P < .01 (unpaired Student t test). (D, left) Spleens from 4 xenograft ALL#18 mice and from 1 noninjected (control) mouse. (Right) Weight of spleens from the 4 xenograft mice compared with spleens from 4 control mice. Each circle represents the spleen weight (g) of 1 mouse. Horizontal lines represent the mean of each treatment group, *P < .01 (unpaired Student t test).
Figure 2.
Figure 2.
Indomethacin reduces the level of PGE2in mouse serum. Serum PGE2 measurement from serum of mice treated with and without indomethacin in their drinking water as described in “Materials and methods." Each circle represents the concentration of PGE2 (pg/mL) in the serum from 1 mouse. Horizontal lines represent the mean of each treatment group, *P < .01 (unpaired Student t test).
Figure 3.
Figure 3.
Indomethacin delays progression of REH in vivo. Xenograft REH mice (5 mice per treatment group) were treated with indomethacin or vehicle as described in “Materials and methods." (A) Progression of leukemia was followed by noninvasive in vivo imaging of luminescence from the mice. The images were taken between 1 and 4 weeks after IT injection as indicated. (B) Xenograft luciferase activity (photons per second [p/s]) from the xenografts presented in panel A measured relative to week 1 after IT injection. Data represent the mean ± standard error of the mean, n = 5, *P < .05 (unpaired Student t test).
Figure 4.
Figure 4.
Indomethacin delays progression of ALL in vivo. (A) Xenograft ALL#18 mice (5 mice per treatment group) were treated with indomethacin or vehicle as described in “Materials and methods." Progression of leukemia was followed by noninvasive in vivo imaging of luminescence from the mice. The images were taken 10 weeks after IT injection. (B) End point flow cytometry analysis of human CD19+CD10+ leukemic cells in the total bone marrow (left) and spleen (right) cell populations of the mice presented in panel A. Each circle represents the percentage of human CD19+CD10+ cells in the total spleen or bone marrow cell populations of 1 mouse. Horizontal lines represent the mean of each treatment group, *P < .05 (unpaired Student t test). (C) Weight of spleens from the mice presented in panel A. Each circle represents the spleen weight (g) of 1 mouse. Horizontal lines represent the mean of each treatment group, *P = .05 (unpaired Student t test). (D-E) End point flow cytometry analysis of CD19+CD10+ leukemic cells in the bone marrow of xenograft ALL#20 (D) and ALL#32 (E) mice. Each circle represents the percentage of human CD19+CD10+ cells in the total bone marrow cell population of 1 mouse. Horizontal lines represent the mean of each treatment group, *P < .05, **P < .01 (unpaired Student t test).
Figure 5.
Figure 5.
Indomethacin enhances p53 levels in bone marrow cells from xenograft mice. Bone marrow cells were harvested from xenograft REH mice, xenograft ALL#18 mice, or xenograft ALL#32 mice treated with indomethacin or vehicle for 4, 16, or 23 weeks, respectively. Cells were subjected to western immunoblot analysis with antibodies specific for human p53 as described in “Materials and methods." Calnexin was used as loading control. (A, left) Western immunoblot of p53 and calnexin expression from xenograft REH mice. Regular REH cells treated with and without irradiation (IR) were used as controls for human p53. (Right) Quantification from the immunoblot in the left panel of p53 band intensities relative to calnexin. Quantifications from immunoblots of p53 band intensities relative to calnexin from xenograft ALL#18 (B) and ALL#32 (C) mice. (A-C) Each circle represents the intensity of p53 relative to calnexin in 1 mouse. Horizontal lines represent the mean of each treatment group, *P < .01 (unpaired Student t test).

Similar articles

Cited by

References

    1. Greaves M. A causal mechanism for childhood acute lymphoblastic leukaemia [published correction appears in Nat Rev Cancer. 2018;18(8):526]. Nat Rev Cancer. 2018;18(8):471-484. - PMC - PubMed
    1. Curtin SC, Minino AM, Anderson RN. Declines in cancer death rates among children and adolescents in the United States, 1999-2014. NCHS Data Brief. 2016;(257):1-8. - PubMed
    1. Ness KK, Armenian SH, Kadan-Lottick N, Gurney JG. Adverse effects of treatment in childhood acute lymphoblastic leukemia: general overview and implications for long-term cardiac health. Expert Rev Hematol. 2011;4(2):185-197. - PMC - PubMed
    1. Rivlin N, Brosh R, Oren M, Rotter V. Mutations in the p53 tumor suppressor gene: important milestones at the various steps of tumorigenesis. Genes Cancer. 2011;2(4):466-474. - PMC - PubMed
    1. Bunz F, Hwang PM, Torrance C, et al. . Disruption of p53 in human cancer cells alters the responses to therapeutic agents. J Clin Invest. 1999;104(3):263-269. - PMC - PubMed

Publication types

MeSH terms