. 2020 Jan 2;135(1):56-70.
doi: 10.1182/blood.2019001576.

Salt-inducible kinase inhibition suppresses acute myeloid leukemia progression in vivo

Affiliations

Salt-inducible kinase inhibition suppresses acute myeloid leukemia progression in vivo

Yusuke Tarumoto et al. Blood. .

Abstract

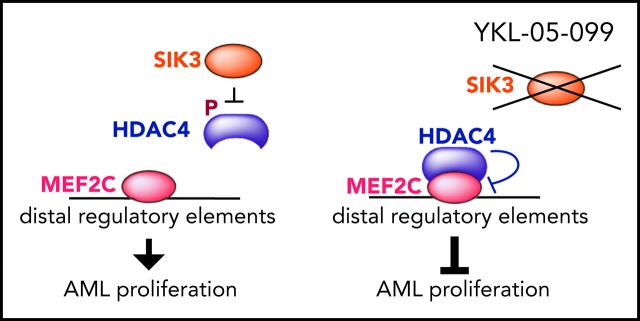
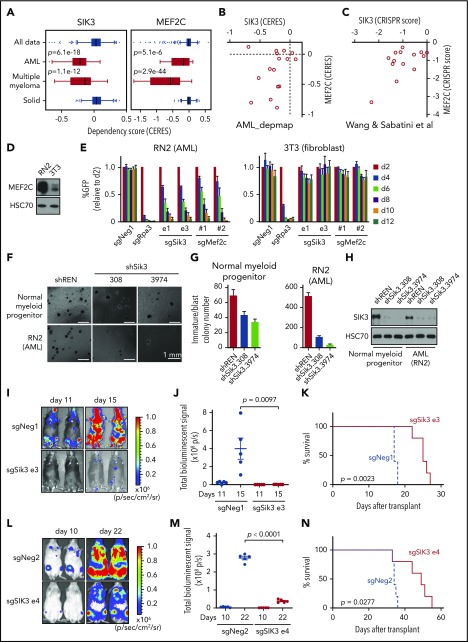
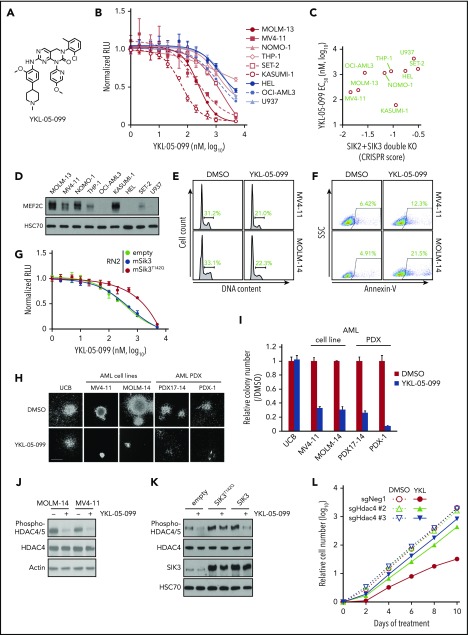
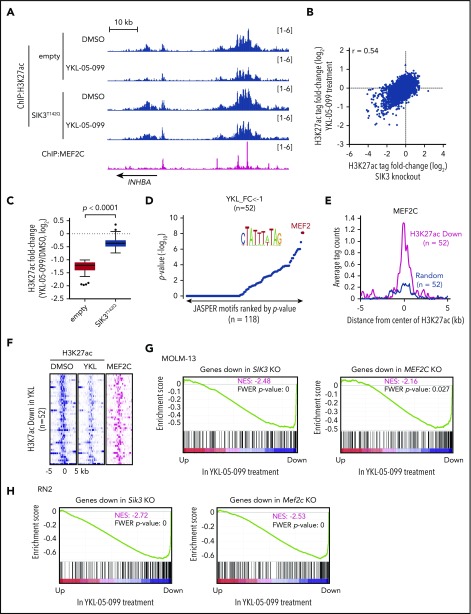
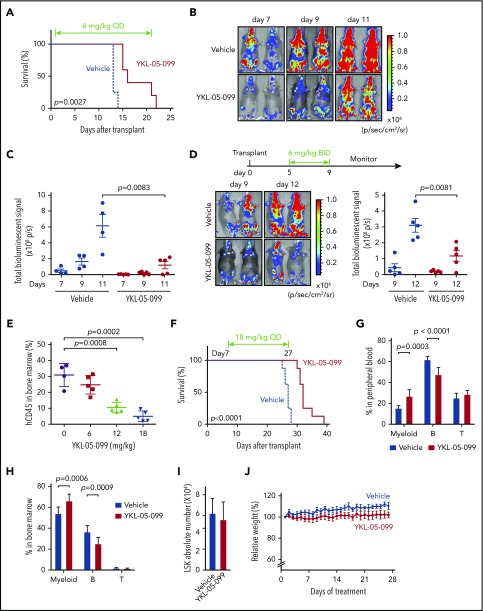
Lineage-defining transcription factors (TFs) are compelling targets for leukemia therapy, yet they are among the most challenging proteins to modulate directly with small molecules. We previously used CRISPR screening to identify a salt-inducible kinase 3 (SIK3) requirement for the growth of acute myeloid leukemia (AML) cell lines that overexpress the lineage TF myocyte enhancer factor (MEF2C). In this context, SIK3 maintains MEF2C function by directly phosphorylating histone deacetylase 4 (HDAC4), a repressive cofactor of MEF2C. In this study, we evaluated whether inhibition of SIK3 with the tool compound YKL-05-099 can suppress MEF2C function and attenuate disease progression in animal models of AML. Genetic targeting of SIK3 or MEF2C selectively suppressed the growth of transformed hematopoietic cells under in vitro and in vivo conditions. Similar phenotypes were obtained when cells were exposed to YKL-05-099, which caused cell-cycle arrest and apoptosis in MEF2C-expressing AML cell lines. An epigenomic analysis revealed that YKL-05-099 rapidly suppressed MEF2C function by altering the phosphorylation state and nuclear localization of HDAC4. Using a gatekeeper allele of SIK3, we found that the antiproliferative effects of YKL-05-099 occurred through on-target inhibition of SIK3 kinase activity. Based on these findings, we treated 2 different mouse models of MLL-AF9 AML with YKL-05-099, which attenuated disease progression in vivo and extended animal survival at well-tolerated doses. These findings validate SIK3 as a therapeutic target in MEF2C-addicted AML and provide a rationale for developing druglike inhibitors of SIK3 for definitive preclinical investigation and for studies in human patients.


Conflict of interest statement

Conflict-of-interest disclosure: C.R.V. is an advisor to KSQ Therapeutics and has received research funding from Boehringer-Ingelheim. K.S. has consulted for Novartis and Rigel Pharmaceuticals and received grant funding from Novartis on topics unrelated to this manuscript. N.S.G. is a founder, science advisory board member, and equity holder in Gatekeeper, Syros, Petra, C4, B2S, and Soltego. The Gray Laboratory receives or has received research funding from Novartis, Takeda, Astellas, Taiho, Jansen, Kinogen, Her2llc, Deerfield, and Sanofi. The remaining authors declare no competing financial interests.

Figures

None
Graphical abstract
Figure 1.
Figure 1.
SIK3 and MEF2C are selectively essential for the growth of AML and multiple myeloma cells. (A) SIK3 and MEF2C essentiality scores extracted from the DepMap database of cancer cell lines. Shown is a boxplot distribution of the copy number–adjusted essentiality score (CERES; a normalized metric of gene essentiality) of SIK3 and MEF2C across all 558 cell lines, 16 AML lines, 18 multiple myeloma lines, and 498 solid tumor cell lines. (B-C) Scatterplots of SIK3 and MEF2C essentiality scores in human AML cell lines in the DepMap (CERES) or from Wang et al (CRISPR scores). (D) Western blot analysis of MEF2C in RN2 and 3T3 whole-cell lysates. (E) Competition-based proliferation assays in which cells were infected with the indicated sgRNAs linked to GFP. Bar graphs represent the mean ± standard error of the mean (SEM; n = 3). (F) Bright-field images of methylcellulose-based colony-formation assays of normal myeloid progenitors or RN2 cells on day 7 after retroviral transduction with control or Sik3 shRNAs. (G) Quantification of the immature/blast colonies shown in panel F. Mean ± SEM (n = 4). (H) Western blot analysis of SIK3 performed on day 6 after infection of the indicated shRNAs. (I) Bioluminescence imaging of wild-type C57BL/6 mice receiving transplants of Cas9-expressing RN2 cells transduced with the indicated sgRNA. Representative images are shown on the indicated day after transplantation. (J) Quantification of bioluminescence from panel I. Values represent photons per second (p/s) of bioluminescent signal detection (mean ± SEM). The P value was calculated by unpaired Student t test (n = 5). (K) Survival curves of the mice in panel I. The P value was calculated by log-rank (Mantel-Cox) test (n = 5). (L) Bioluminescence imaging of NSG (NOD-SCID/IL2Rgammanull) mice which received transplants of Cas9-expressing MV4-11 cells transduced with the indicated sgRNA. Representative images are shown on the indicated day after transplantation. (M) Quantification of bioluminescence from panel L. Values represent photons per second (p/s) of bioluminescent signal detection (mean ± SEM). The P value was calculated by unpaired Student t test (n = 5). (N) Survival curves of the mice in panel L. The P value was calculated by log-rank (Mantel-Cox) test (n = 5). sgNeg1, sgNeg2, shREN: negative controls. sgRpa3: positive control.
Figure 2.
Figure 2.
YKL-05-099 inhibits the growth of MLL-rearranged leukemia cells by modulating SIK3-mediated regulation of HDAC4. (A) Chemical structure of YKL-05-099. (B) Relative growth of the indicated cells using CellTiter-Glo assays. Normalized relative luminescence units (RLU) are shown after 3 days in culture with DMSO (0.1%) or YKL-5-099 at the indicated concentrations. The mean ± standard error of the mean (SEM; n = 3) and 4-parameter dose-response curves are plotted. (C) Scatterplot of SIK2/SIK3 essentiality CRISPR scores from our prior study and YKL-05-099 EC50 in the indicated AML cell lines. The CRISPR scores were calculated in cells cotransduced with SIK2 and SIK3 sgRNAs and cell fitness tracked in competition-based assays. (D) Western blot analysis of MEF2C in the indicated AML cell lines. (E) Flow cytometry analyses of DNA content to infer cell cycle status after 24-hour treatment with 1 µM YKL-05-099 or DMSO. (F) Flow cytometry analyses of side scatter (SSC) and annexin-V staining (a preapoptotic cell marker) after 24-hour treatment with 1 µM YKL-05-099 or DMSO. (G) Relative growth of RN2 cells transduced with empty vector, Sik3, or Sik3T142Q cDNA, after YKL-05-099 treatment. Normalized relative luminescence units (RLU) are shown after 3 days of culture with DMSO (0.1%) or YKL-05-099 at the indicated concentrations. The mean ± SEM (n = 3) and 4-parameter dose-response curves are plotted. (H) Bright-field images of methylcellulose-based colony formation assays of UCB cells, AML cell lines, and PDX models with DMSO or 1 µM YKL-05-099 on day 10 after plating. Scale bar, 500 µm. (I) Quantification of the myeloid colonies shown in panel H. Mean ± standard deviation (n = 3). (J) Western blot analysis in MOLM-14 and MV4-11 cells treated with 1 µM YKL-05-099 or DMSO for 6 hours. (K) Western blot analysis in RN2 cells transduced with empty vector, Sik3, or Sik3T142Q cDNA, following treatment with DMSO (0.1%) or 350 nM YKL-05-099 for 2 hours. (L) Accumulated number of Cas9-expressing RN2 cells transduced with the indicated sgRNAs upon treatment with DMSO (0.1%) or 350 nM YKL-05-099. An average of 3 independent experiments is shown. sgNeg1: negative control.
Figure 3.
Figure 3.
YKL-05-099 interferes with MEF2C-dependent transcriptional activation. (A) ChIP-seq profiles of H3K27ac and MEF2C at the indicated genomic loci, chosen because H3K27ac is decreased in MOLM-13 cells by YKL-05-099 treatment. For H3K27ac ChIP-seq, cells were harvested after 2-hour treatment with DMSO (0.1%) or 250 nM YKL-05-099. (B) Scatterplot of H3K27ac fold-change after SIK3 knockout or YKL-05-099 treatment at 16 437 genomic sites of H3K27ac enrichment. (C) Box plots of fold change of downregulated H3K27ac signals in MOLM-13 cells treated with DMSO or 250 nM YKL-05-099 for 2 hours. MOLM-13 cells express either an empty vector or SIK3T142Q cDNA. (D) TRAP motif enrichment analysis of DNA sequences with decreased H3K27ac after YKL-05-099 treatment. (E) A meta profile of MEF2C occupancy at the genomic regions exhibiting H3K27ac log2-fold change of <−1 after YKL-05-099 treatment vs a randomly chosen set of H3K27ac-enriched sites. (F) ChIP-seq density plot at regions with decreased H3K27ac after YKL-05-099 treatment. Enhancers are ranked by fold change of H3K27ac after treatment. (G) GSEA, which evaluates how treating MOLM-13 cells with YKL-05-099 (250 nM, 2 hours) influences previously defined gene signatures that were suppressed after SIK3 or MEF2C knockout in this cell type. Normalized enrichment score (NES) and family-wise error rate (FWER) P value are shown. (H) GSEA that evaluates how treating RN2 cells with YKL-05-099 (250 nM, 2 hours) influences gene signatures that are suppressed after Sik3 or Mef2c knockout in this cell type. NES and FWER P value are shown.
Figure 4.
Figure 4.
YKL-05-099 treatment extends survival in 2 mouse models of MLL-AF9 AML. (A) Survival curves of C57BL/6 mice transplanted with RN2 cells, followed by intraperitoneal injection of 6 mg/kg YKL-05-099 treatment once daily from day 1 after transplantation. The P value was calculated by log-rank (Mantel-Cox) test (n = 4 or 5). (B) Representative bioluminescence imaging of mice on the indicated days after transplantation. (C) Quantification of the signal in panel B. Values represent photons per second (p/s) of bioluminescent signal detection (mean ± standard error of the mean [SEM]). The P value was calculated by unpaired Student t test (n = 4 or 5). (D) Bioluminescence imaging of wild-type C57BL/6 mice that received RN2 cell transplants. YKL-05-099 was administrated twice daily from days 5 to 9 after transplantation. Representative images and quantified signal values (p/s) are shown (mean ± SEM). The P value was calculated by unpaired Student t test (n = 5). (E) The leukemia burden in bone marrow was evaluated by human CD45 flow cytometry analysis after 2 weeks of treatment with YKL-05-099 in NSGS mice receiving transplants of AML PDX model (PDX-1) cells. The mean ± standard deviation is shown (n = 4 or 5). The P value was calculated by the unpaired Student t test. (F) Survival curves of NSGS mice receiving transplants of PDX-1 AML cells. YKL-05-099 treatment (18 mg/kg, intraperitoneal injection, once daily) was initiated from day 7 after transplantation for 3 weeks. The P value was calculated by log-rank (Mantel-Cox) test (n = 8). (G-H) Flow cytometry analysis of myeloid and B- and T-cell populations in peripheral blood (G) and bone marrow (H) from C57BL/6 mice after 4 weeks of treatment with 18 mg/kg YKL-05-099. (I) Absolute number of LSK cells per femur from the mice in panel G. (J) Mouse weight measurements were performed during daily treatment with 18 mg/kg YKL-05-099 (n = 6).

Similar articles

Cited by

References

    1. Ley TJ, Miller C, Ding L, et al. ; Cancer Genome Atlas Research Network . Genomic and epigenomic landscapes of adult de novo acute myeloid leukemia [published correction appears in N Engl J Med. 2013;369(1):98]. N Engl J Med. 2013;368(22):2059-2074. - PMC - PubMed
    1. Tyner JW, Tognon CE, Bottomly D, et al. . Functional genomic landscape of acute myeloid leukaemia. Nature. 2018;562(7728):526-531. - PMC - PubMed
    1. Ma X, Liu Y, Liu Y, et al. . Pan-cancer genome and transcriptome analyses of 1,699 paediatric leukaemias and solid tumours. Nature. 2018;555(7696):371-376. - PMC - PubMed
    1. Assi SA, Imperato MR, Coleman DJL, et al. . Subtype-specific regulatory network rewiring in acute myeloid leukemia. Nat Genet. 2019;51(1):151-162. - PMC - PubMed
    1. Churpek JE, Bresnick EH. Transcription factor mutations as a cause of familial myeloid neoplasms. J Clin Invest. 2019;129(2):476-488. - PMC - PubMed

Publication types

MeSH terms