

Differential Coding Strategies in Glutamatergic and GABAergic Neurons in the Medial Cerebellar Nucleus
- PMID: 31694963
- PMCID: PMC6939494
- DOI: 10.1523/JNEUROSCI.0806-19.2019
Differential Coding Strategies in Glutamatergic and GABAergic Neurons in the Medial Cerebellar Nucleus
Abstract
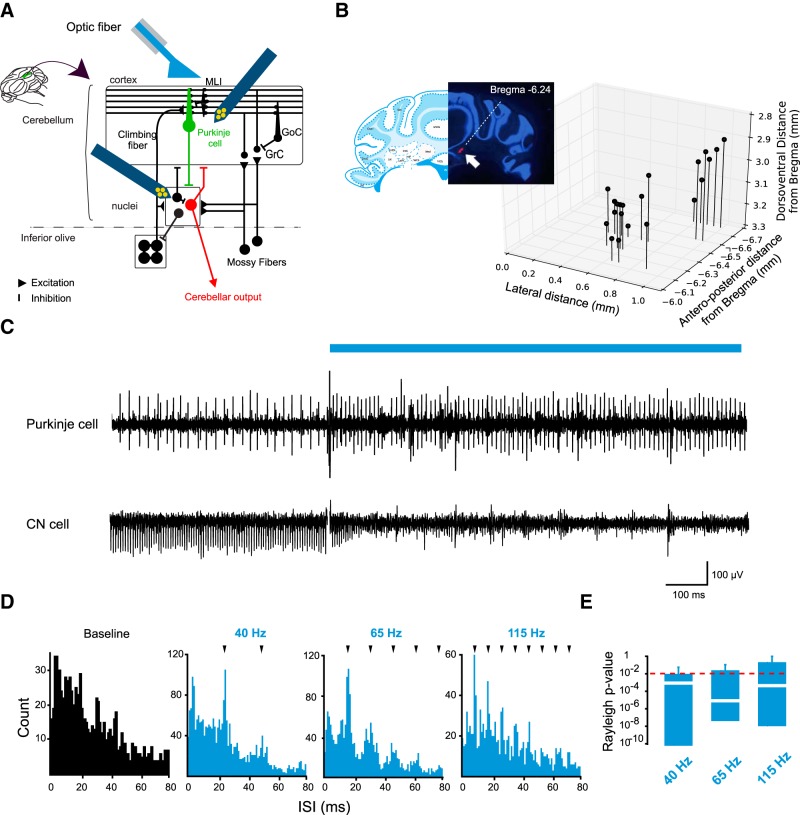
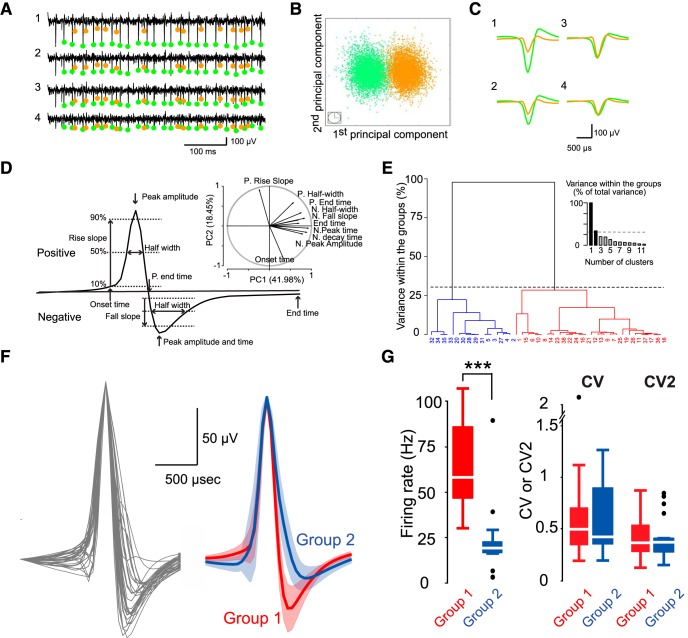
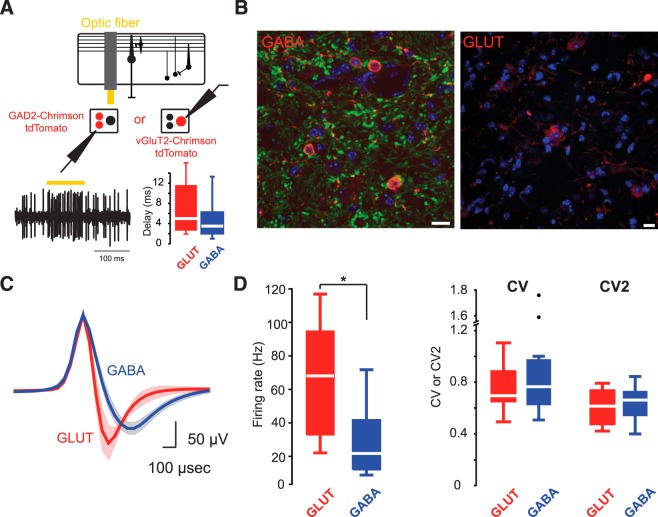
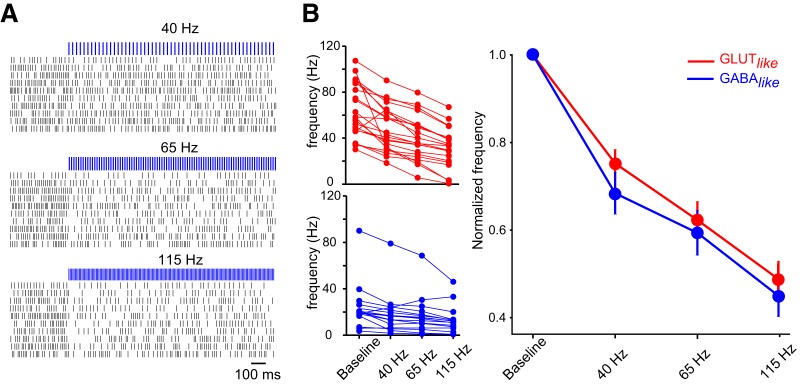
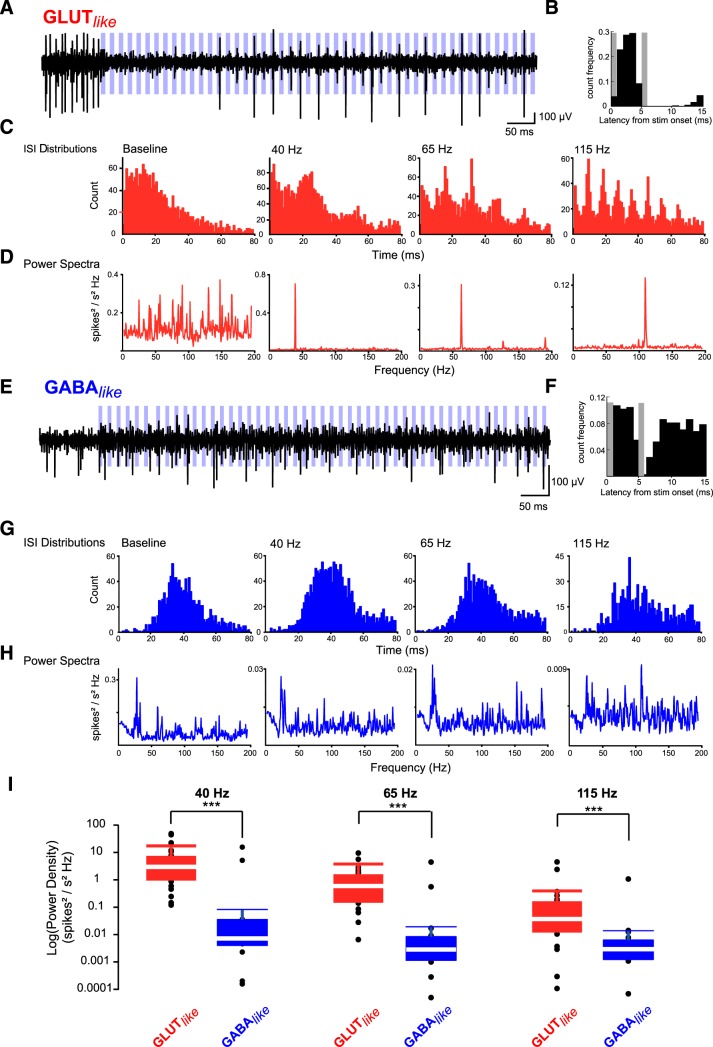
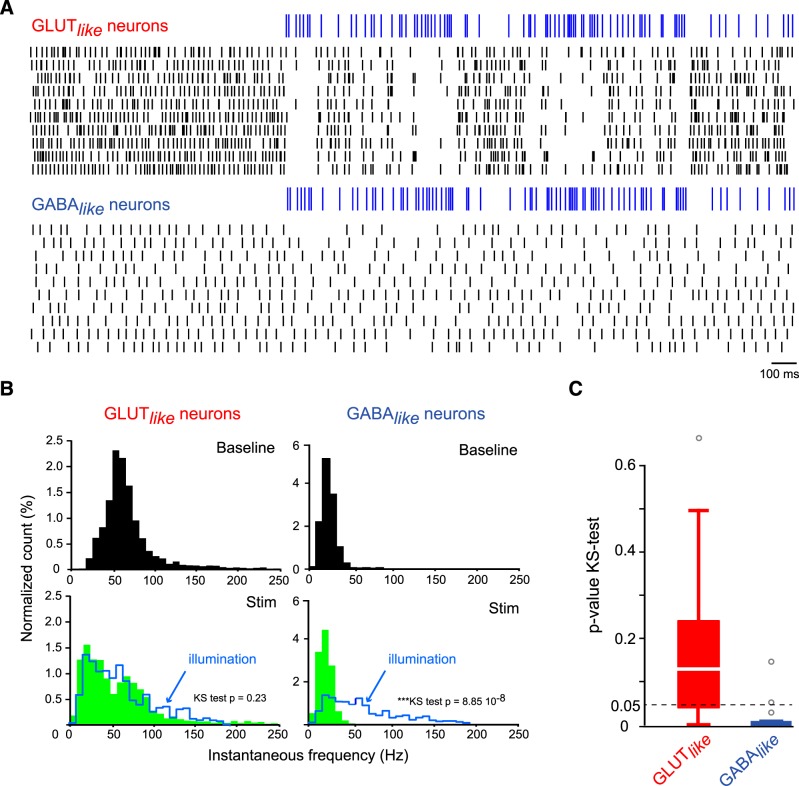
The cerebellum drives motor coordination and sequencing of actions at the millisecond timescale through adaptive control of cerebellar nuclear output. Cerebellar nuclei integrate high-frequency information from both the cerebellar cortex and the two main excitatory inputs of the cerebellum: the mossy fibers and the climbing fiber collaterals. However, how nuclear cells process rate and timing of inputs carried by these inputs is still debated. Here, we investigate the influence of the cerebellar cortical output, the Purkinje cells, on identified cerebellar nuclei neurons in vivo in male mice. Using transgenic mice expressing Channelrhodopsin2 specifically in Purkinje cells and tetrode recordings in the medial nucleus, we identified two main groups of neurons based on the waveform of their action potentials. These two groups of neurons coincide with glutamatergic and GABAergic neurons identified by optotagging after Chrimson expression in VGLUT2-cre and GAD-cre mice, respectively. The glutamatergic-like neurons fire at high rate and respond to both rate and timing of Purkinje cell population inputs, whereas GABAergic-like neurons only respond to the mean population firing rate of Purkinje cells at high frequencies. Moreover, synchronous activation of Purkinje cells can entrain the glutamatergic-like, but not the GABAergic-like, cells over a wide range of frequencies. Our results suggest that the downstream effect of synchronous and rhythmic Purkinje cell discharges depends on the type of cerebellar nuclei neurons targeted.SIGNIFICANCE STATEMENT Motor coordination and skilled movements are driven by the permanent discharge of neurons from the cerebellar nuclei that communicate cerebellar computation to other brain areas. Here, we set out to study how specific subtypes of cerebellar nuclear neurons of the medial nucleus are controlled by Purkinje cells, the sole output of the cerebellar cortex. We could isolate different subtypes of nuclear cell that differentially encode Purkinje cell inhibition. Purkinje cell stimulation entrains glutamatergic projection cells at their firing frequency, whereas GABAergic neurons are only inhibited. These differential coding strategies may favor temporal precision of cerebellar excitatory outputs associated with specific features of movement control while setting the global level of cerebellar activity through inhibition via rate coding mechanisms.
Keywords: Purkinje cells; cerebellar nuclei; cerebellum; electrophysiology in vivo; temporal coding.
Copyright © 2020 the authors.
Figures
Similar articles
-
Morphological and electrophysiological properties of GABAergic and non-GABAergic cells in the deep cerebellar nuclei.J Neurophysiol. 2007 Jan;97(1):901-11. doi: 10.1152/jn.00974.2006. Epub 2006 Nov 8. J Neurophysiol. 2007. PMID: 17093116
-
Integration of Purkinje cell inhibition by cerebellar nucleo-olivary neurons.J Neurosci. 2015 Jan 14;35(2):544-9. doi: 10.1523/JNEUROSCI.3583-14.2015. J Neurosci. 2015. PMID: 25589749 Free PMC article.
-
Rubrocerebellar Feedback Loop Isolates the Interposed Nucleus as an Independent Processor of Corollary Discharge Information in Mice.J Neurosci. 2017 Oct 18;37(42):10085-10096. doi: 10.1523/JNEUROSCI.1093-17.2017. Epub 2017 Sep 15. J Neurosci. 2017. PMID: 28916520 Free PMC article.
-
Climbing fibers mediate vestibular modulation of both "complex" and "simple spikes" in Purkinje cells.Cerebellum. 2015 Oct;14(5):597-612. doi: 10.1007/s12311-015-0725-1. Cerebellum. 2015. PMID: 26424151 Review.
-
Modeling the generation of output by the cerebellar nuclei.Neural Netw. 2013 Nov;47:112-9. doi: 10.1016/j.neunet.2012.11.006. Epub 2012 Nov 21. Neural Netw. 2013. PMID: 23200193 Free PMC article. Review.
Cited by
-
Modular output circuits of the fastigial nucleus for diverse motor and nonmotor functions of the cerebellar vermis.Elife. 2020 Jul 8;9:e58613. doi: 10.7554/eLife.58613. Elife. 2020. PMID: 32639229 Free PMC article.
-
Reactive Cu2+-peptide intermediates revealed by kinetic studies gain relevance by matching time windows in copper metallomics.Metallomics. 2023 Feb 16;15(2):mfad007. doi: 10.1093/mtomcs/mfad007. Metallomics. 2023. PMID: 36787891 Free PMC article.
-
Cerebellum Lecture: the Cerebellar Nuclei-Core of the Cerebellum.Cerebellum. 2024 Apr;23(2):620-677. doi: 10.1007/s12311-022-01506-0. Epub 2023 Feb 13. Cerebellum. 2024. PMID: 36781689 Free PMC article. Review.
-
Synchronous spiking of cerebellar Purkinje cells during control of movements.Proc Natl Acad Sci U S A. 2022 Apr 5;119(14):e2118954119. doi: 10.1073/pnas.2118954119. Epub 2022 Mar 29. Proc Natl Acad Sci U S A. 2022. PMID: 35349338 Free PMC article.
-
Cerebellar plasticity and associative memories are controlled by perineuronal nets.Proc Natl Acad Sci U S A. 2020 Mar 24;117(12):6855-6865. doi: 10.1073/pnas.1916163117. Epub 2020 Mar 9. Proc Natl Acad Sci U S A. 2020. PMID: 32152108 Free PMC article.
References
Publication types
MeSH terms
Substances
LinkOut - more resources
Full Text Sources