Review
. 2019 Aug 23:14:6749-6777.
doi: 10.2147/IJN.S169030. eCollection 2019.

Janus particles: recent advances in the biomedical applications

Affiliations
Review

Janus particles: recent advances in the biomedical applications

Tu C Le et al. Int J Nanomedicine. .

Abstract

Janus particles, which are named after the two-faced Roman god Janus, have two distinct sides with different surface features, structures, and compositions. This asymmetric structure enables the combination of different or even incompatible physical, chemical, and mechanical properties within a single particle. Much effort has been focused on the preparation of Janus particles with high homogeneity, tunable size and shape, combined functionalities, and scalability. With their unique features, Janus particles have attracted attention in a wide range of applications such as in optics, catalysis, and biomedicine. As a biomedical device, Janus particles offer opportunities to incorporate therapeutics, imaging, or sensing modalities in independent compartments of a single particle in a spatially controlled manner. This may result in synergistic actions of combined therapies and multi-level targeting not possible in isotropic systems. In this review, we summarize the latest advances in employing Janus particles as therapeutic delivery carriers, in vivo imaging probes, and biosensors. Challenges and future opportunities for these particles will also be discussed.

Keywords: Janus particles; imaging; sensing; theranostics; therapeutics.


Conflict of interest statement

The authors report no conflicts of interest in this work.

Figures
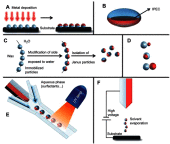
Figure 1
Figure 1
Overview of approaches towards the preparation of Janus particles. (A) Classical two-dimensional technique involving shading of one particle side after their immobilization. (B) Ellipsoidal complex core coacervate micelle with an interpolyelectrolyte complex core (IPEC). (C) Pickering emulsion route. (D) Janus particles with two inorganic compartments, snowman-, acorn-, dumbbell-like nanoparticles (top to bottom). (E) Microfluidic photopolymerization system. (F) Electrospinning using a bi-phasic nozzle. Reprinted with permission from the Walther A, Müller AH. Janus particles. Soft Matter. 2008;4(4):663–668. Copyright © 2008 Royal Society of Chemistry.
Figure 2
Figure 2
(A) Schematics of the electrohydrodynamic (EHD) co-jetting method developed by Lahann et al. Depending on the preparation parameters such as flow rates, polymer concentrations, potential difference, either particles (electrospraying) or fibers (electrospinning) can be obtained from the breaking of the Taylor cone (top right). Some examples showing clear asymmetry or heterogeneous nature of the obtained particles or fibers. (B): (a) Schematic of the modified fluidic nanoprecipitation system (FNPS); (b) Janus polymer particles loaded with two hydrophobic dyes, Nile red (red) and Rh-6G (green); (c) Janus particles loaded with Nile red and the hydrophilic dye FITC-dextran (green); (d, e) cumulative release of PTX and DOX from Janus NPs (JNP) and monophasic particles (NP). Reprinted with permission from Xie H, She Z-G, Wang S, Sharma G, Smith JW. One-step fabricationof polymeric Janus nanoparticles for drug delivery. Langmuir. 2012;28(9):4459–4463. Copyright 2012 American Chemical Society.
Figure 3
Figure 3
(A) Schematic of the formation process of PLGA@Precirol polymer-lipid Janus particles via an internal phase separation induced by solvent evaporation. (BD) Representative optical, scanning electron microscopy, and fluorescent images of the polymer–lipid Janus NPs. (EG) Suppression of lung tumor growth in mice inhaled with polymer–lipid Janus NPs containing CUR and DOX. Representative optical (E) and magnetic resonance (F) images 4 weeks after the injection of A549 human lung cancer cells into the lung of mice. (G) Changes in lung tumor volume after beginning of treatment with Empty NPs, free DOX, NPs with CUR, NPs with DOX, and NPs with CUR and DOX. Adapted with permission from Garbuzenko OB, Winkler J, Tomassone MS, Minko T. Biodegradable Janus nanoparticles for local pulmonary delivery of hydrophilic and hydrophobic molecules to the lungs. Langmuir. 2014;30(43):12941–12949 (https://doi.org/10.1021/la502144z). Copyright © 2014 American Chemical Society.
Figure 4
Figure 4
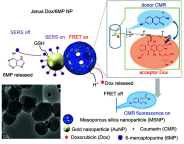
Schematic representation of the Janus Dox/6MP NPs and the mechanism of real-time monitoring of dual drugs with pH/redox dual responsive release in living cells. Copyright 2016 Royal Society of Chemisty. Reprinted with permission from Cao H, Yang Y, Chen X, Shao Z. Intelligent Janus nanoparticles for intracellular real-time monitoring of dual drug release. Nanoscale. 2016;8(12):6754–6760.
Figure 5
Figure 5
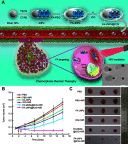
(A) Schematic illustration of the FA-targeting ICG-loaded Ag-MS Janus NPs for synergistic liver cancer chemo/photothermal therapy. Inset: TEM image of the Janus NPs. (B and C) In vivo tumor inhibition evaluation of the chemo/photothermal therapy: (B) SMMC-7721 tumor growth curves after various treatments and NIR irradiation at 24- and 48-hr post-injection. (C) Photographs of the excised tumors from mice from each group. Adapted with permission from Wang Z, Chang Z, Lu M, et al. Janus silver/silica nanoplatforms for light-activated liver cancer chemo/photothermal therapy. ACS Appl Mater Interfaces. 2017;9(36):30306–30317. Copyright (2017) American Chemical Society.
Figure 6
Figure 6
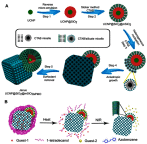
(A) Synthetic procedure for dual compartment Janus mesoporous silica nanocomposites. (B) Schematic illustration for dual-control drug release systems by using the dual-compartment mesoporous Janus nanocomposites. Adapted with permission from Li X, Zhou L, Wei Y, El-Toni AM, Zhang F, Zhao D. Anisotropic growth-induced synthesis of dual-compartment Janus mesoporous silica nanoparticles for bimodal triggered drugs delivery. J Am Chem Soc. 2014;136(42):15086–15092. Copyright (2014) American Chemical Society.
Figure 7
Figure 7
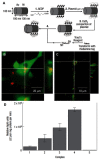
(A) Illustration of Au@Ni Janus nanorod functionalization. (B and C) Confocal microscope images of transfected HEK293 cells. (B) Rhodamine (red-633 nm) identifies the subcellular location of the nanorods whilst GFP expression (green-543 nm) provides confirmation of transfection. Orthogonal sections confirm that the nanorods are within the cell. (C) HEK 293 cell stained with Lysotracker Green shows the location of the nanorods (Rhodamine - red) in relation to acidic organelles in both orthogonal sections. (D) Luciferase (LC) expression of 1) nanorod–plasmid complex; 2) nanorod–plasmid/transferrin complex; 3) nanorod–plasmid/transferrin complex incubated with 100 μM chloroquine; 4) Lipofectamine (positive control); 5) naked DNA (negative control). Adapted with permission from Salem AK, Searson PC, Leong KW. Multifunctional nanorods for gene delivery. Nat Mater. 2003;2(10):668. Copyright © 2003, Springer Nature.
Figure 8
Figure 8
Directional and programmable encapsulated NPs. Top row: colloidal metallic NPs with different sizes, shapes, and compositions, which can be converted into regioselective NPs (rseNPs) through polymer blocking and DNA modification. Second row: controllable polymer blocking will break the homogeneous surface chemistry of NPs, creating specific binding sites on it. Third row: DNA modification on polymer-free surface region provides a specific binding force on the binding site. Bottom row: images of the corresponding rseNPs. Scale bars, 20 nm. Reprinted with permission from Chen G, Gibson KJ, Liu D, et al. Regioselective surface encoding of nanoparticles for programmable self-assembly. Nat Mater. 2018;18:2. Copyright © 2018 Springer Nature.
Figure 9
Figure 9
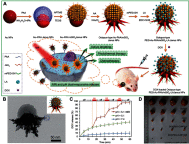
(A) Fabrication of octopus-type PEG-Au@PAA@MS-LA Janus NPs (PEG-OJNP-LA) with pH and NIR light dual-stimuli responsive properties for actively targeted and chemo-photothermal cancer therapy in vitro and in vivo. (B) HRTEM image of a single PEG-OJNP-LA NP. (C) pH and NIR controlled release profiles of DOX/PEG-OJNP-LA. (D) Representative photograph of excised H-22 tumors from mice at 11 days post treatment.Adapted with permission from Zhang L, Chen Y, Li Z, et al. Tailored synthesis of octopus-type janus nanoparticles for synergistic actively-targeted and chemo-photothermal therapy. Angew Chem Int Ed. Copyright © 2016 John Wiley and Sons.
Figure 10
Figure 10
Schematic illustration of the synthesis of DOX-loaded Janus PCL-SPIONs with FA targeting functionality. Reprinted with permission from Shaghaghi B, Khoee S, Bonakdar S. Preparation of multifunctional Janus nanoparticles on the basis of SPIONs as targeted drug delivery system. Int J Pharm. 2019;559:1–12.Copyright © 2019 Elsevier.
Figure 11
Figure 11
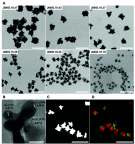
(A) TEM images of different Janus magnetic nanostars (JMNSs) obtained by varying the ratio of nanodumbbells-seeds to gold salt. As the NP size decreases, the iron oxide part (light grey) can be distinguished from the gold domain (dark grey or black). (B) High-resolution TEM image of an NP (JMNS.16.28), whose average diameter of the iron oxide part was 16 nm and that of the whole NP was 28 nm, showing single crystal nanostar tips and Fe3O4. (C) HAADF-STEM image of (JMNS.16.28), where gold appears white while iron oxide appears gray. (D) EDX mapping of Fe (green) and Au (red) domains in (C). (Scale bars for (A), (C) and (D)=100 nm; scale bar for (B)=10 nm). Reprinted with permission from Reguera J, de Aberasturi DJ, Henriksen-Lacey M, et al. Janus plasmonic–magnetic gold–iron oxide nanoparticles as contrast agents for multimodal imaging. Nanoscale. 2017;9(27):9467–9480. Copyright 2017 Royal Society of Chemistry.
Figure 12
Figure 12
(A) Schematic illustration of surface functionalization of the Au–Fe3O4 NPs. (B and C) TEM images of the 8–20 nm Au–Fe3O4 particles before (B) and after (C) surface modification. Reprinted with permission from Xu C, Xie J, Ho D, et al. Au–Fe3O4 dumbbell nanoparticles as dual-functional probes. Angew Chem Int Ed. 2008;47(1):173–176. Copyright © 2008 John Wiley and Sons.
Figure 13
Figure 13
(A) Schematic illustration of the poly(DMA-r-mPEGMA-r-MA) coating of the hybrid gold–iron oxide (Au–Fe3O4) NPs. (B), (C) TEM images of the hybrid Au–Fe3O4NPs before (B) and after (C) coating with poly(DMA-r-mPEGMA-r-MA). The scale bar in the TEM image indicates 20 nm. Reprinted with permission from Kim D, Yu MK, Lee TS, Park JJ, Jeong YY, Jon S. Amphiphilic polymer-coated hybrid nanoparticles as CT/MRI dual contrast agents. Nanotechnology. 2011;22(15):155101. Copyright 2011 IOP Publishing.
Figure 14
Figure 14
(A) Overview TEM bright field image of Au@MnO@SiO2 NPs, (B) TEM micrograph of a single Au@MnO@SiO2 particle. Reprinted with permission from Schick I, Lorenz S, Gehrig D, et al. Multifunctional two-photon active silica-coated Au@ MnO Janus particles for selective dual functionalization and imaging. J Am Chem Soc. 2014;136(6):2473–2483. Copyright 2014 American Chemical Society.
Figure 15
Figure 15
(A) Release profiles of Celastrol (CST)-loaded PEG-CuS@Au@MnO2 ternary Janus NPs in PBS at pH 7.4 and pH 5.3 with and without laser irradiation (time periods under irradiation are labeled by green stars). (B) Cytotoxicity of HepG2 cells after incubation with various concentrations of Janus NPs treated with or without NIR irradiation. (C and D) In vivo CT and MR images of mice before and after injection with PEG−CuS@Au@MnO2 Janus NPs for 24 hrs. (E, F) Tumor growth curves and tumor inhibition rate of H-22 tumor-bearing mice subjected to various types of Janus NPs and treatment conditions **p<0.01, ***p<0.001. Adapted with permission from Li S, Zhang L,ChenX, et al. Selective growth synthesis of ternary Janus nanoparticles for imaging-guided synergistic chemo- and photothermal therapy in the second NIRwindow. ACS Appl Mater Interfaces. 2018;101470 (28):24137–24148. Copyright 2018 American Chemical Society.
Figure 16
Figure 16
A schematic showing (A, B) the controlled synthesis and functionalization of the PEG–ICG–PDA@mCaP hollow Janus NPs and (C) the PA imaging-guided chemo-photothermal synergistic cancer therapy. (D, E) TEM and SEM of the PDA/mCaP hollow Janus NPs. (F, G) Temperature elevation of the hollow Janus NPs when irradiated with NIR laser (1 W cm−2) and the corresponding infrared thermal images. (H) Tumor growth curve of HepG-2 bearing mice treated with DOX-loaded hollow Janus NP and NIR laser. **p<0.01, ***p<0.001. Adapted with permission from Zhang M, Zhang L, Chen Y, Li L, Su Z, Wang C. Precise synthesis of unique polydopamine/mesoporous calcium phosphate hollow Janus nanoparticles for imaging-guided chemo-photothermal synergistic therapy. Chem Sci. 2017;8(12):8067–8077. Copyright 2017 Royal Society of Chemistry.
Figure 17
Figure 17
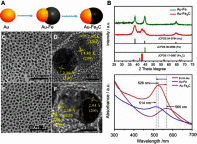
(A) Schematic depiction of the synthetic process of Au@Fe2C Janus NPs. (B) XRD patterns of Au@Fe heterostructures and Au@Fe2C Janus NPs. (C) TEM and (D) HRTEM images of Au@Fe heterostructures. (E) TEM and (F) HRTEM images of Au@Fe2C Janus NPs. (G) UV–vis absorption spectra from 300 to 700 nm of 9 nm Au NPs, Au@Fe heterostructures, and Au@Fe2C Janus NPs in hexane, respectively. Reprinted with permission from Ju Y, Zhang H, Yu J, et al. Monodisperse Au–Fe2C Janus nanoparticles: an attractive multifunctional material for triple-modal imaging-guided tumor photothermal therapy. ACS Nano. 2017;11(9):9239–9248. Copyright 2017 American Chemical Society.
Figure 18
Figure 18
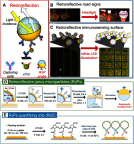
(A) Schematic diagram for the strategy of the proposed retroreflective cardiac troponin I (cTnI) sandwich immunoassay using RJP as an optical immunosensing probe. (B) Retroreflective road signs at night time. (C) Schematic illustrations and figures of retroreflective immunosensing surface before (left) and after (right) the white LED illumination. (D) Workflows of the functionalization procedures for streptavidin-modified retroreflective Janus particles and (E) the construction process of Hg2+ recognition layer on the gold-modified surface of retroreflective quantifying chips. Reprinted with permission from Han YD, Kim H-S, Park YM, Chun HJ, Kim J-H, Yoon HC. Retroreflective Janus microparticle as a nonspectroscopic optical immunosensing probe. ACS Appl Mater Interfaces. 2016;8(17):10767–10774.). Copyright 2016 American Chemical Society. and Chun HJ, Kim S, Han YD, et al. Water-soluble mercury ion sensing based on the thymine-Hg2+-thymine base pair using retroreflective 1490 Janus particle as an optical signaling probe. Biosens Bioelectron. 2018;104:138–144. Copyright © 2018 Elsevier B.V.
Figure 19
Figure 19
Schematic illustration of the electrochemical sensor fabrication process for the detection of ractopamine (RAC). The detection relies on the change in peak current of the sensor in the absence (A) and the presence (B) of RAC. Reprint with permission from Zhou Y, Yang YJ, Deng X, et al. Electrochemical sensor for determination of ractopamine based on aptamer/octadecanethiol Janus particles. Sens Actuat B Chem. 2018;276:204–210. Copyright © 2018 Elsevier B.V.
Figure 20
Figure 20
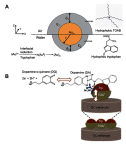
(A) Janus structure of the gold nanoclusters formed at the air–water interface. (B) Schematic representation of L-tryptophan–dopamine H-bonding interaction leading to electrocatalytic oxidation of dopamine at the Janus electrode/electrolyte interface. The blue arrows represent the redox reaction of dopamine at the gold nanocluster surface. The white arrow shows the electronic communication between the Janus cluster mediators to the glassy carbon electrode. Reprinted with permission from Biji P, Patnaik A. Interfacial Janus gold nanoclusters as excellent phase- and orientation-specific dopamine sensors. Analyst. 2012;137(20):4795–4801. Copyright 2012 Royal Society of Chemistry.
Figure 21
Figure 21
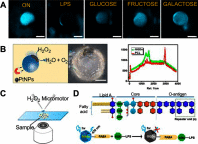
Self-propelled Janus microsensors for the detection of LPS from Salmonella enterica. (A) Real-time optical visualization of the LPS recognition event: time-lapse fluorescent images of the micromotors before (ON) and after LPS addition (OFF) and selectivity of the protocol in the presence of interfering saccharides. (B) Schematic of the microsensor operation and characterization. Optical images and Raman mapping showing the distribution of NPs, GQDs, and polycaprolactone (PCL) in the microsensor and corresponding Raman spectra. (C) Schematic of the setup for the Janus micromotors-based sensing protocol. (D) Schematics for structure of the LPS from Salmonella enterica and mechanism of quenching by LPS union to the GQDs recognition units. Experimental conditions: 15% H2O2, surfactant, 5% (w/v) sodium cholate. Scale bars, 20 μm. Reprinted with permission from Pacheco M, Jurado-Sanchez B, Escarpa A. Sensitive monitoring of enterobacterial contamination of food using self-propelled Janus microsensors. Anal Chem. 2018;90(4):2912–2917. Copyright 2018 American Chemical Society.
Figure 22
Figure 22
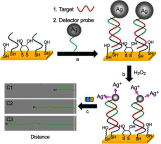
DNA detection based on silver ion-enhanced self-propulsion of Au@Pt nanomotors. (A) Hybridization of the target and capture of the Ag NP-tagged detector probe. (B) Dissolution of Ag NP tags in H2O2, leading to Ag+-enriched fuel. (C) Visual detection of the motion of the catalytic Au@Pt nanowire motors in the resulting Ag+-enriched fuel. Optical images superimposed with track lines show the distance traveled by the nanomotors in H2O2 fuel after DNA hybridization. Reprinted with permission from Wu J, Balasubramanian S, Kagan D, Manesh KM, Campuzano S, Wang J. Motion-based DNA detection using catalytic nanomotors. Nat Commun. 2010;1.Copyright © 2010, Springer Nature.
Figure 23
Figure 23
The light‐guided biochemical SERS sensing by the phototactic nanomotor. (A) The schematic illustration and (B) video snapshots showing phototactic behavior of the nanomotors. Schematic illustrations of SERS sensing of crystal violet (CV) (C) and MCF‐7 breast cancer cells (F). Raman spectra and intensity change of characteristic peaks of CV (D and E) and MCF‐7 cells (G and H) under different conditions: (0) without any nanomotor; with nanomotor before (1) and after (2) focused UV‐light irradiation for about 10 s. Reprinted with permission from Wang Y, Zhou C, Wang W, et al. Photocatalytically powered matchlike nanomotor for light-guided active SERS sensing. Angew Chem Int Edit. 2018;57(40):13110–13113. Copyright © 2018 WILEY-VCH Verlag GmbH & Co. KGaA, Weinheim.

Similar articles

Cited by

References

    1. Agrahari V, Agrahari V, Mitra AK. Nanocarrier fabrication and macromolecule drug delivery: challenges and opportunities. Ther Deliv. 2016;7(4):257–278. doi:10.4155/tde-2015-0012 - DOI - PMC - PubMed
    1. Shi J, Kantoff PW, Wooster R, Farokhzad OC. Cancer nanomedicine: progress, challenges and opportunities. Nat Rev Cancer. 2017;17(1):20–37. doi:10.1038/nrc.2016.108 - DOI - PMC - PubMed
    1. Min Y, Caster JM, Eblan MJ, Wang AZ. Clinical translation of nanomedicine. Chem Rev. 2015;115(19):11147–11190. doi:10.1021/acs.chemrev.5b00116 - DOI - PMC - PubMed
    1. Zhai J, Luwor RB, Ahmed N, et al. Paclitaxel-loaded self-assembled lipid nanoparticles as targeted drug delivery systems for the treatment of aggressive ovarian cancer. ACS Appl Mater Interfaces. 2018;10(30):25174–25185. doi:10.1021/acsami.8b08125 - DOI - PubMed
    1. Li TJ, Huang CC, Ruan PW, et al. In vivo anti-cancer efficacy of magnetite nanocrystal - based system using locoregional hyperthermia combined with 5-fluorouracil chemotherapy. Biomaterials. 2013;34(32):7873–7883. doi:10.1016/j.biomaterials.2013.07.012 - DOI - PubMed

MeSH terms