. 2019 Nov 11;36(5):483-497.e15.
doi: 10.1016/j.ccell.2019.10.001. Epub 2019 Oct 31.

Small-Molecule MYC Inhibitors Suppress Tumor Growth and Enhance Immunotherapy

Affiliations

Small-Molecule MYC Inhibitors Suppress Tumor Growth and Enhance Immunotherapy

Huiying Han et al. Cancer Cell. .

Abstract

Small molecules that directly target MYC and are also well tolerated in vivo will provide invaluable chemical probes and potential anti-cancer therapeutic agents. We developed a series of small-molecule MYC inhibitors that engage MYC inside cells, disrupt MYC/MAX dimers, and impair MYC-driven gene expression. The compounds enhance MYC phosphorylation on threonine-58, consequently increasing proteasome-mediated MYC degradation. The initial lead, MYC inhibitor 361 (MYCi361), suppressed in vivo tumor growth in mice, increased tumor immune cell infiltration, upregulated PD-L1 on tumors, and sensitized tumors to anti-PD1 immunotherapy. However, 361 demonstrated a narrow therapeutic index. An improved analog, MYCi975 showed better tolerability. These findings suggest the potential of small-molecule MYC inhibitors as chemical probes and possible anti-cancer therapeutic agents.

Keywords: MYC; MYC degradation; MYC-threonine 58 phosphorylation; PD-L1; anti-PD1; cancer therapy; immunotherapy; in silico screen; small molecules; target engagement.


Conflict of interest statement

Declaration of interests

H.H., A.D.J., J.I., R.K.M. G.E.S. and S.A.A. are co-inventors on patent applications covering the methods and assays to identify and characterize MYC inhibitors and derivatives. All other authors declare no competing interests.

Figures
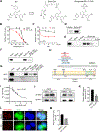
Figure 1.
Figure 1.
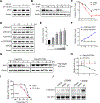
Identification of MYC Inhibitors (A) Chemical structures of compound 361, Biotin-361 and Phosphate-361. (B) Melt curves of MYC protein in cellular thermal shift assay (CETSA) in PC3 cells treated with 361 or DMSO. The graph shows the quantification of MYC protein versus temperature points based on western blot analyses. (C) 361 CETSA under isothermal condition. Graph shows the quantification of MYC protein at room temperature (RT) 25 °C or 42 °C from cells treated with indicated concentrations of 361. (D) Western blots for recombinant MYC protein after Biotin-361 (5 μM) or control D-Biotin (5 μM) pulldown. (E) Western blot analysis on endogenous MYC protein after Biotin-361 pulldown in PC3 cell lysates. (F and G) Biotin-361 (5 μM) binding to MYC from PC3 cell lysate was analyzed after pre-treatment with Phosphate-361 (F) or compounds G5 or JKY-2–169 (JKY) (G). (H) Illustration of MYC binding sites of reported MYC inhibitors including G5, JKY, 7594–0035, and F4, as well as 361 and 975 from this study. (I) 361 binding affinity to MYC was assessed by fluorescence polarization (FP) competition assay. The graph shows 361 at varying concentrations (3.1–25 μM) against G5 (10 μM) binding to MYC353–439 in FP. (J and K) Western blot showing (J) and quantification of (K) the levels of MAX co-immunoprecipitated with MYC in PC3 cells with or without 1 hr treatment of 361. (L and M) Representative immunofluorescence (IF) images (L) and quantification (M) of proximity ligation assay (PLA) for MYC/MAX interaction in PC3 cells after 1 hr treatment of 361. Red signals indicate close proximity between MYC and MAX and green fluorescence shows MYC expression at same cell sections (scale bar, 5 μm). Error bars represent mean ± SEM, n = 3 independent experiments for (B), (C), (I) and (K), n = ~ 200 cells counted/group for (M), and analyzed by two-way ANOVA for (B) and (C), “One site - Fit Ki” analysis and “Binding-competitive” suite for (I), unpaired t-test for (K) and (M) in Prism.***p < 0.001, ****p < 0.0001. See also Figures S1 and S2
Figure 2.
Figure 2.
361 Decreases MYC Protein Stability by Modulating MYC-threonine 58 Phosphorylation (A) MYC protein levels in PC3 cells treated with 361 in the absence or presence of proteasome inhibitor MG132 determined by western blot. (B) PC3 cells were pretreated with 361 or DMSO for 3 hr, followed by cycloheximide (CHX) treatment. Cells were harvested at indicated time points and MYC levels determined by western blot. (C) MYC protein degradation kinetic curves based on the quantification of MYC levels in (B). (D) Western blots for MYC, phosphorylated MYC T58 and S62, GSK3β and phosphorylated GSK3β S9 in 361 treated PC3 cells at indicated time points. (E and F) Ratios of pT58 to pS62 (E) and pT58 or pS62 to total MYC protein levels (F) from experiment in (D). (G and H) Western blot analysis (G) and quantification (H) of Flag-tagged MYC T58 alanine mutant (Flag-MYCT58A) or Flag-tagged wild-type MYC (Flag-MYC) levels in PC3 cells stably expressing the indicated constructs after 361 (6 μM) treatment at the indicated time points. (I) Melt curve of MYCT58A in MYCT58A-expressing PC3 cells treated with DMSO or 361 at indicated temperature points in CETSA. (J) Phosphorylated MYC T58 levels by GSK3β were assessed by western blot in in vitro kinase assay where recombinant MYC was first phosphorylated on S62 by activated recombinant ERK2, then incubated with GSK3β kinase and 6 μM of 361 or inactive analog 360. Error bars represent mean ± SEM, n = 3 independent experiments for (C, E, H and I), n = 2 independent experiments for (F), Half-life of MYC protein calculated by “one phase decay” analysis in Prism for (C), and analyzed by two-way ANOVA in Prism for (I). Data are representative of two independent experiments with similar results for (J). See also Figure S3, S4 and Table S1
Figure 3.
Figure 3.
361 Inhibits MYC-dependent Cancer Cell Proliferation and Tumorigenicity (A) Anti-proliferative effects of 361 on prostate cancer cell lines and MYC/MAX complex independent cell line PC12 following 5 days of treatment. (B) IC50s of 361, G5 and enzalutamide in cell lines with 5 days treatment. (C) Representative images of established organoids formed from normal FVB mouse prostate epithelial cells or MycCaP cells treated with 361 for 4 days (scale bar, 10 μm). (D) Western blots show MYC levels in P493–6 cells maintained in 0–10 ng/ml of tetracycline. (E) Cell viability of P493–6 cells with different MYC levels from (B) upon treatment with 4 μM 361 for 72 hr. Error bars represent mean ± SEM, n = 4 replicates for (A-C) and (E), and analyzed by unpaired t test in Prism for (E). ****p < 0.0001. See also Figure S5
Figure 4.
Figure 4.
361 Shows Favorable Pharmacokinetics and Inhibits MYC-dependent Tumor Growth in Vivo (A) Pharmacokinetic (PK) analysis in C57BL/6 mice treated p.o. or i.p. with 50 mg/kg of 361. Plasma concentration of 361 was determined at the indicated time points up to 24 hr after a single dose administration. (B) Average tumor volumes of MycCaP allografts in FVB mice after treatment with 361 initially at 50 mg/kg twice daily for 2 days, then 70 mg/kg/day for 9 days as indicated. (C) Average of tumor growth percentage of human prostate cancer patient derived xenografts (PDX) after 361 treatment (55 mg/kg/day, 3 consecutive days a week for 2 weeks). (D) Representative images of H&E and IF staining for Ki67 and pT58 in MycCaP tumor tissue after 361 treatment from the study in (B) (scale bar, 50 μm). (E) Tumor volume fold change of MycCaP allografts in FVB mice and xenografts in NSG mice after 4 days treatment with 361 at 50 mg/kg/day. Dotted line indicates threshold of 10% of fold change and numbers in parentheses indicate how many tumors were under the 10% threshold out of total number of tumors. Error bars represent mean ± SEM, n = 3 mice at each time point in (A), n = 6–8 grafts/group (from 3–4 mice) in (B and D), n = 9–10 grafts/group (from 5 mice) in (C) from two independent experiments, n = 8–12 grafts/group (from 4–6 mice) in (E), and analyzed by two-way ANOVA in Prism for (C). *p < 0.05. See also Figure S6 and Table S2
Figure 5.
Figure 5.
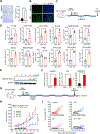
361 Modulates the Tumor Immune Microenvironment and Potentiates Anti-PD1 Immunotherapy (A) Representative IHC staining of CD3 in the MycCaP tumor tissue after 361 treatment from the study in Figure 4B (scale bar, 50 μm), and the quantification of CD3 positive cells per field of version (FOV). (B) Representative IF images of PDL-L1 staining in the MycCaP tumor tissue after 361 treatment from the study in Figure 4B (scale bar, 50 μm). (C) Scheme for tumor immunophenotyping from FVB mice bearing established MycCaP allografts treated with 361 (50 mg/kg/day, 2 days on/2 days off for 2 rounds). TIL, tumor infiltrating lymphocytes. (D) Flow cytometry analysis of immune cells in MycCaP allografts treated with 361 or vehicle as described in (C), shown by percent of parent gates. (E) Western blot analysis shows cleaved Caspase-3 in 361 treated MycCaP cells for 48 hr. (F) Immunogenic cell death (ICD) was assessed in vitro in MycCaP cells treated with 4 μM 361 for 72 hr via HMGB1 release (ELISA), ATP release (luminescence assay), and cell surface calreticulin expression (flow cytometry). Data are representative of two independent experiments with similar results. (G) Scheme for combination treatment of 361 with anti-PD1 antibody in MycCaP allografts. FVB mice bearing established MycCaP tumors were treated with alternating doses of 361 at 50 mg/kg/day for 2 days, then anti-PD1 or IgG2a isotype control at 100 μg/day for 2 days, for a total of 4 cycles. (H) Average of tumor growth percentage of the grafts under the combination treatment described in (G). (I) Individual tumor growth trajectories of study in (H). Error bars represent mean ± SEM, n = 4–6 grafts/group (from 3 mice) and 6 FOVs/group were analyzed in in (A) and (B), n= 3–4 mice/group in (D), n = 3 replicates in (F), and n = 4–6 mice/group in (H), and analyzed by unpaired t test for (A), (D) and (F), and two-way ANOVA for (H) in Prism. *p < 0.05, **p < 0.01, ***P < 0.001, ****p < 0.0001. See also Figure S6
Figure 6.
Figure 6.
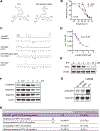
975, a Close Analog of 361 with Improved Therapeutic Index (A) Structures of 975 and its soluble analog used to facilitate NMR studies. (B) Melt curves of MYC in PC3 cells after 975 (8 μM) or DMSO treatment by CETSA. Error bars represent mean ± SEM, n = 3 independent experiments, and analyzed by two-way ANOVA in Prism. (C) Saturation-Transfer Difference (STD) NMR analysis of 975 soluble analog (100 μM) with MYC (5 μM) or MAX (5 μM) protein. (D) 975 at varying concentrations (3.1–25 μM) against G5 (10 μM) binding to MYC353–439 in FP assay. Error bars represent mean ± SEM, n = 3 independent experiments, and analyzed by “One site - Fit Ki” analysis and “Binding-competitive” suite in Prism. (E) MYC levels after 48 hr treatment of 975 in PC3 cells, assessed by western blot. (F) Western blot analysis for MYC T58 and S62 phosphorylation status in 975 treated PC3 cells at indicated time points. (G) Phosphorylated MYC T58 levels by GSK3β were assessed by western blot in in vitro kinase assay with the treatment of 6 μM 975. (H) Mass spectrometry analysis of common proteins bound to Biotin-361 (10 μM) and Biotin-975 (10 μM) in PC3 and P493–6 cells with MYC in the “on” or “off” condition. See also Figure S7 and Table S6
Figure 7.
Figure 7.
975 Selectively Inhibits MYC-dependent Cancer Cell Viability and the MYC Transcriptional Program. (A) Anti-proliferative effects of 975 on prostate cancer cells and PC12 following 5 days of treatment. (B) Dose response effect of 975 on MYC transcriptional activity in E-box luciferase reporter assay compared to CMV-luciferase reporter. (C) Venn diagram showing overlap of genes regulated in P493–6 cells by: 1) silencing MYC by Tetra 0.1 μg/ml for 48 hr, log fold change > 0.5 from Dang_2018; 2) silencing MYC by Tetra, 0.1 μg/ml for 24 hr, adj-p<0.05, this study; and 3) 975 treatment at 6 μM for 24 hr, adj-p<0.05, from this study. (D) GO biological process analysis on 975 uniquely regulated genes (1128) in P493–6 cells. (E) Venn diagram showing overlap of genes regulated by 361 (6 μM, 24 hr) and 975 (8 μM, 24 hr) treatment of PC3 cells from RNA-seq. Genes with adj-p < 0.05, and log fold change > 0.5 were included. Error bars represent mean ± SEM, n = 4 replicates in (A) and (B), data are representative of two to three independent experiments with similar results. RNA-seq data was assessed in triplicates (C-E). See also Table S3 and S4
Figure 8.
Figure 8.
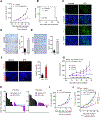
975 Inhibits Tumor Progression, Increases Immune Cell Infiltration and Potentiates Anti-PD1 Immunotherapy (A) Average tumor volumes of MycCaP allografts after treatment with 975 at 100 mg/kg/day for 14 days. (B) Survival curves of animals from the study shown in (A). (C) Representative images of MYC pT58 and PD-L1 levels assessed by IF in the tumor tissues from the study in (A) (scale bar, 50 μm). (D) Representative images of CD3 by IHC and quantification of the positive cells/FOV in the tumor tissues from the study in (A) (scale bar, 100 μm). (E) Representative images of B220 by IHC and quantification of the positive cells/FOV in the tumor tissues from the study in (A) (scale bar, 100 μm). (F) Representative images of NK cells (NKp46+) by IF and quantification of the positive cells/FOV in the tumor tissues from the study in (A) (scale bar, 50 μm). (G) Average tumor volumes of MycCaP allografts after treatment with alternating doses of 975 at 50 mg/kg, twice daily for 2 days, then anti-PD1 for 2 days for a total of 5 cycles. (H) Fold change of tumor size of MycCaP allografts in FVB mice and xenografts in NSG mice after 3 days treatment with 975 at 50 mg/kg, twice daily. Tumor numbers under the 10% threshold out of total number of tumors in each group indicated. (I) Average tumor volumes of LLC1 allografts in C57BL/6 mice after treatment with 975 at 50 mg/kg, twice daily for 12 days. (J) Average tumor volumes of MV411 xenografts after treatment with lower dose 975 (50 mg/kg/day) alone or combined with Ara-C (20 mg/kg/day) for 3 three weeks (5 days a week). Error bars represent mean ± SEM n = 6–7 grafts (from 4 mice) /group in (A-F), most affected 1–3 FOVs/graft were analyzed in (D-F), n = 5–7 mice/group in (G), n = 7–11 grafts (from 4 to 6 mice)/group in (H), n = 7 mice/group in (I), n = 4 mice/group in (J). Data were analyzed by Two-way ANOVA for (A, G, I and J), by survival curve comparison for (B), by unpaired t test for (D-F) in Prism, *p < 0.05, ****p < 0.0001. See also Figure S8 and Table S5
Scheme 1:
Scheme 1:
(a) TFAA, Sodium 2,2,2-trifluoroacetate, 110 °C, 24 hr; (b) Iodine, pyridine, CHCl3, room temp. overnight; (c) p-Chlorobenzyl bromide, K2CO3, acetone, 60 °C, overnight; (d) Aryl boronic acid, Pd(dppf)2Cl2, Na2CO3, toluene, EtOH, H2O, 100 °C, 2 hr; (e) Methylhydrazine, EtOH, 78 °C, 2 hr.
Scheme 2:
Scheme 2:
(a) 4-chloro-3-(trifluoromethyl)phenyl boronic acid, Pd(dppf)2Cl2, Na2CO3, toluene, EtOH, H2O, 100 °C, 2 hr; (b) di-tert-Butyl-(chloromethyl)phosphate, Cs2CO3, Nal, DMF, 60 °C, 48 hr; (c) Hydrazine 60%, EtOH, 50 °C, 1 hr; (d) TFA, DCM, room temp. 1 hr.
Scheme 3:
Scheme 3:
(a) 3,5-Bis(trifluoromethyl)phenyl boronic acid, Pd(dppf)2Cl2, Na2CO3, toluene, EtOH, H2O, 100 °C, 2 hr; (b) di-tert-Butyl-(chloromethyl)phosphate, Cs2CO3, Nal, DMF, 60 °C, 16 hr; (c) Methylhydrazine 60%, EtOH, 80 °C, 1 hr; (d) TFA, DCM, room temp. 1 hr.
Scheme 4:
Scheme 4:
(a) tert-butyl (3-bromopropyl)carbamate, K2CO3, acetone; (b) (3,5-bis(trifluoromethyl)phenyl)boronic acid, Pd(dppf)2Cl2, Na2CO3, toluene, EtOH, H2O, 100 °C, 3 hr; (c) Methylhydrazine 60%, EtOH, 80 °C, 45 min; (d) 1st .TFA, DCM, room temp. 2 hr. 2nd EDC, HOBt, Et3N, Biotin-PEG6-COOH, DMF.
Scheme 5:
Scheme 5:
(a) (3,5-bis(trifluoromethyl)phenyl)boronic acid, Pd(dppf)2Cl2, Na2CO3, toluene, EtOH, H2O, 100 °C, 3 hr; (b) Methylhydrazine 60%, EtOH, 80 °C, 45 min; (c) 1st .TFA, DCM, room temp. 2 hr. 2nd EDC, HOBt, Et3N, Biotin-PEG4-COOH, DMF

Similar articles

Cited by

References

    1. Agrawal P, Yu K, Salomon AR, and Sedivy JM (2010). Proteomic profiling of Myc-associated proteins. Cell Cycle 9, 4908–4921. - PMC - PubMed
    1. Anker JF, Naseem AF, Mok H, Schaeffer AJ, Abdulkadir SA, and Thumbikat P (2018). Multi-faceted immunomodulatory and tissue-tropic clinical bacterial isolate potentiates prostate cancer immunotherapy. Nat Commun 9, 1591. - PMC - PubMed
    1. Baell JB, and Holloway GA (2010). New substructure filters for removal of pan assay interference compounds (PAINS) from screening libraries and for their exclusion in bioassays. J Med Chem 53, 2719–2740. - PubMed
    1. Berg T, Cohen SB, Desharnais J, Sonderegger C, Maslyar DJ, Goldberg J, Boger DL, and Vogt PK (2002). Small-molecule antagonists of Myc/Max dimerization inhibit Myc-induced transformation of chicken embryo fibroblasts. Proc Natl Acad Sci U S A 99, 3830–3835. - PMC - PubMed
    1. Blackwell TK, Kretzner L, Blackwood EM, Eisenman RN, and Weintraub H (1990). Sequence-specific DNA binding by the c-Myc protein. Science 250, 1149–1151. - PubMed

Publication types

MeSH terms