. 2019 Dec 28:316:404-417.
doi: 10.1016/j.jconrel.2019.10.028. Epub 2019 Oct 31.

Ionizable lipid nanoparticles encapsulating barcoded mRNA for accelerated in vivo delivery screening

Affiliations

Ionizable lipid nanoparticles encapsulating barcoded mRNA for accelerated in vivo delivery screening

Pedro P G Guimaraes et al. J Control Release. .

Abstract

Messenger RNA (mRNA) has recently emerged as a promising class of nucleic acid therapy, with the potential to induce protein production to treat and prevent a range of diseases. However, the widespread use of mRNA as a therapeutic requires safe and effective in vivo delivery technologies. Libraries of ionizable lipid nanoparticles (LNPs) have been designed to encapsulate mRNA, prevent its degradation, and mediate intracellular delivery. However, these LNPs are typically characterized and screened in an in vitro setting, which may not fully replicate the biological barriers that they encounter in vivo. Here, we designed and evaluated a library of engineered LNPs containing barcoded mRNA (b-mRNA) to accelerate the screening of mRNA delivery platforms in vivo. These b-mRNA are similar in structure and function to regular mRNA, and contain barcodes that enable their delivery to be quantified via deep sequencing. Using a mini-library of b-mRNA LNPs formulated via microfluidic mixing, we show that these different formulations can be pooled together, administered intravenously into mice as a single pool, and their delivery to multiple organs (liver, spleen, brain, lung, heart, kidney, pancreas, and muscle) can be quantified simultaneously using deep sequencing. In the context of liver and spleen delivery, LNPs that exhibited high b-mRNA delivery also yielded high luciferase expression, indicating that this platform can identify lead LNP candidates as well as optimal formulation parameters for in vivo mRNA delivery. Interestingly, LNPs with identical formulation parameters that encapsulated different types of nucleic acid barcodes (b-mRNA versus a DNA barcode) altered in vivo delivery, suggesting that the structure of the barcoded nucleic acid affects LNP in vivo delivery. This platform, which enables direct barcoding and subsequent quantification of a functional mRNA, can accelerate the in vivo screening and design of LNPs for mRNA therapeutic applications such as CRISPR-Cas9 gene editing, mRNA vaccination, and other mRNA-based regenerative medicine and protein replacement therapies.

Keywords: Gene delivery; Gene therapy; High-throughput screening; Nanoparticle; mRNA.


Figures

Fig. 1.
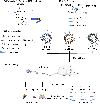
Fig. 1.. Schematic of lipid nanoparticles (LNPs) encapsulating barcoded mRNA (b-mRNA) for accelerated in vivo delivery screening.
(A) b-mRNA templates were generated by polymerase chain reaction (PCR) using a plasmid vector template coding for the luciferase reporter gene luc2. For downstream processing, a T7 promoter sequence was added to 5’ end of the luc2 template on the forward primer, and a LNP-specific barcode, a unique molecular identifier (UMI), and a PCR handle/dock were added to the 3’ UTR of luc2 on the reverse primer. Subsequently, a library of b-mRNA was generated by in vitro transcription (IVT) using those b-mRNA templates. (B) b-mRNA includes a region coding for luciferase, a barcode sequence, a 10-nucleotide unique molecular identifier (UMI), and a poly(A) tail. (C) LNPs were formulated via microfluidic mixing, and each LNP formulation encapsulated unique b-mRNA. (D) Different LNP formulations were then pooled together and administered intravenously to C57BL/6 mice. Organs were harvested 4 hours post injection, and b-mRNA delivery was quantified using both whole-organ luminescence imaging and deep sequencing.
Fig. 2.
Fig. 2.. Formulation and characterization of b-mRNA LNPs.
(A) LNPs were formulated via microfluidic mixing of an aqueous phase of b-mRNA and an ethanol phase of ionizable lipids, phospholipids, cholesterol, and a lipid-polyethylene glycol (PEG) conjugate. (B) Representative cryogenic-transmission electron microscopy image of LNPs encapsulating b-mRNA (scale bar = 100 nm). (C) Hydrodynamic diameter measurements of LNPs encapsulating b-mRNA quantified by dynamic light scattering.
Fig. 3.
Fig. 3.. b-mRNA LNPs accelerate in vivo liver and spleen delivery screening and the identification of lead formulations.
(A) LNP formulations with identical lipid and excipient composition but different b-mRNA were pooled at varying dosages and administered intravenously to C57BL/6 mice. 4 hours post injection, delivery of each b-mRNA LNP to the liver was quantified. N = 4 mice per group. (B) In vivo standard curve of b-mRNA delivery to the liver at a range of dosages showed a linear regression (R2 = 0.9646). (C-E) 16 LNP formulations (F01-F16) were engineered by varying the content of ionizable lipid, phospholipid (DOPE), cholesterol, and lipid-anchored PEG (C14-PEG2000). A 0.25 μg dose of each b-mRNA LNP was pooled and administered intravenously as a single injection. 4 hours post injection, b-mRNA delivery to the liver (C), spleen (D), and other organs (E) were quantified. N = 4 mice per group. Heat map (E) representing delivery to different tissue samples were created using Morpheus software. Darker clusters were designated as higher delivery whereas lighter clusters were designated as lower delivery. Within the heat map, the delivery of different LNP formulations within the same organ (left to right) can be compared, but the delivery of the same LNP formulation across different organs (top to bottom) cannot be compared. Data plotted as mean ± SD. Method to calculate b-mRNA delivery is explained in detail in the experimental section. R2 value was calculated based on linear regression model.
Fig. 4.
Fig. 4.. Lead LNPs identified from the delivery screen induce greater in vivo luciferase expression in the liver and spleen, and greater EPO production in mice.
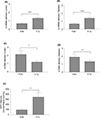
(A-C) C57BL/6 mice were intravenously injected with either LNP formulations F01 or F13 (5 μg b-mRNA per injection). 4 hours post administration, organs were harvested from mice, and their luminescence was measured by IVIS imaging. N = 3 mice per group. (A) Representative images of luminescence detection in organs from mice treated with either LNP formulations F01 or F13. (B, C) Total luminescent flux from two organs of interest, the liver and spleen, were quantified in (B) and (C) respectively. (D). C57BL/6 mice were intravenously injected with either the F01 or F13 LNP formulation that encapsulated human erythropoietin (EPO) mRNA (5 μg EPO mRNA per injection). 4 hours post injection, serum samples were collected from mice and their EPO concentrations were determined by an enzyme-linked immunosorbent assay (ELISA). N = 3 mice per group. Data were plotted as mean ± SD. N.S. denotes not significant, **P < 0.01 by t-test
Fig. 5.
Fig. 5.. LNPs encapsulating widely used, commercially available luciferase mRNA are comparable in vivo to b-mRNA LNPs.
5 different LNP formulations (F01, F06, F09, F13, F16) were formulated with commercially available luciferase mRNA (TrilinkmRNA). C57BL/6 mice were intravenously injected with individual LNP formulations (5 μg Trilink-mRNA per injection). 4 hours post administration, organs were harvested from mice, and their luminescence was measured by IVIS imaging. N = 3 mice per group. (A) Representative images of luminescence detection in organs from mice treated with 5 different LNP formulations (F01, F06, F09, F13, F16). (B,C) Total luminescent flux from two organs of interest, the liver and spleen, were quantified in (B) and (C) respectively. Data were plotted as mean ± SD. N.S. denotes not significant, *P < 0.05, ***P < 0.001, ****P < 0.0001 by ANOVA with post-hoc Tukey-Kramer.
Fig. 6.
Fig. 6.. Encapsulation of barcoded DNA (b-DNA) versus b-mRNA in LNPs alters in vivo delivery.
(A) 16 LNP formulations used in this study were now used to each encapsulate unique b-DNA instead of b-mRNA. b-DNA contained universal primer sites, a 10-nucleotide barcode sequence, and a 10-nucleotide UMI region to minimize polymerase chain reaction (PCR) bias. (B-C) 16 b-DNA LNP formulations were pooled (1 μg b-DNA per injection for each formulation) and administered to C57BL/6 mice intravenously. 4 hours post injection, b-DNA delivery to the liver (B) and spleen (C) was quantified. N = 4 mice per group. (D-E) In vivo delivery of 16 b-mRNA LNP formulations was plotted against the delivery of 16 b-DNA LNP formulations. Method to calculate b-DNA delivery is explained in detail in the experimental section. R2 values were calculated based on a linear regression model. Data were plotted as mean ± SD.
Fig. 7.
Fig. 7.. Comparison of b-mRNA system versus b-DNA system to predict functional mRNA delivery in vivo
(A, B) b-mRNA LNP delivery was plotted against luciferase expression in the liver (A) and spleen (B) of luciferase mRNA LNP-treated mice. (C, D) Similarly, b-DNA LNP delivery was plotted against luciferase expression in the liver (C) and spleen (D) of luciferase mRNA LNP-treated mice. Data were plotted as mean ± SD.
Fig. 8.
Fig. 8.. b-mRNA LNPs predict functional mRNA delivery.
(A, B) Comparison of LNP formulations F4 and F13 for b-mRNA delivery to the liver (A) and spleen (B). (C, D) Comparison of LNP formulations F4 and F13 for b-DNA delivery to the liver (C) and spleen (D). (E) C57BL/6 mice were intravenously injected with either the F04 or F13 LNP formulation that encapsulated EPO mRNA (5 μg EPO mRNA per injection). Serum EPO concentrations at 4 hour post-intravenous injection were determined using ELISA. Data were plotted as mean ± SD. *P < 0.05, **P < 0.01, ****P < 0.0001 by t-test.

Similar articles

Cited by

References

    1. Oberli MA; Reichmuth AM; Dorkin JR; Mitchell MJ; Fenton OS; Jaklenec A; Anderson DG; Langer R; Blankschtein D, Lipid nanoparticle assisted mRNA delivery for potent cancer immunotherapy. Nano letters 2016, 17 (3), 1326–1335. - PMC - PubMed
    1. Cheng Q; Wei T; Jia Y; Farbiak L; Zhou K; Zhang S; Wei Y; Zhu H; Siegwart DJ, Dendrimer - Based Lipid Nanoparticles Deliver Therapeutic FAH mRNA to Normalize Liver Function and Extend Survival in a Mouse Model of Hepatorenal Tyrosinemia Type I. Advanced Materials 2018, 1805308. - PubMed
    1. Luo X; Li B; Zhang X; Zhao W; Bratasz A; Deng B; McComb D; Dong Y, Dual-functional lipid-like nanoparticles for delivery of mRNA and MRI contrast agents. Nanoscale 2017, 9 (4), 1575–1579. - PMC - PubMed
    1. Zhang R; Billingsley MM; Mitchell MJ, Biomaterials for vaccine-based cancer immunotherapy. Journal of Controlled Release 2018. - PMC - PubMed
    1. Riley RS; June CH; Langer R; Mitchell MJ, Delivery technologies for cancer immunotherapy. Nature Reviews Drug Discovery 2019, 1. - PMC - PubMed

Publication types