. 2019 Oct 31;10(1):4967.
doi: 10.1038/s41467-019-12911-1.

Split intein-mediated selection of cells containing two plasmids using a single antibiotic

Affiliations

Split intein-mediated selection of cells containing two plasmids using a single antibiotic

Navaneethan Palanisamy et al. Nat Commun. .

Erratum in

Abstract

To build or dissect complex pathways in bacteria and mammalian cells, it is often necessary to recur to at least two plasmids, for instance harboring orthogonal inducible promoters. Here we present SiMPl, a method based on rationally designed split enzymes and intein-mediated protein trans-splicing, allowing the selection of cells carrying two plasmids with a single antibiotic. We show that, compared to the traditional method based on two antibiotics, SiMPl increases the production of the antimicrobial non-ribosomal peptide indigoidine and the non-proteinogenic aromatic amino acid para-amino-L-phenylalanine from bacteria. Using a human T cell line, we employ SiMPl to obtain a highly pure population of cells double positive for the two chains of the T cell receptor, TCRα and TCRβ, using a single antibiotic. SiMPl has profound implications for metabolic engineering and for constructing complex synthetic circuits in bacteria and mammalian cells.


Conflict of interest statement

The authors declare no competing interests.

Figures
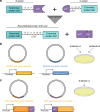
Fig. 1
Fig. 1
Cells containing two plasmids can be selected with a single antibiotic. a Schematic showing trans-splicing of proteins by a split intein. X any amino acid, C cysteine, S serine, T threonine. b, c Schematic highlighting the difference between the conventional (b) and the SiMPl (c) selection methods
Fig. 2
Fig. 2
The SiMPl method based on kanamycin. a, b Schematic showing the main features found on the SiMPl plasmids. pSiMPlk_N (a) and pSiMPlk_C (b) are derivatives of pBAD33 and pTrc99a, respectively. The chloramphenicol resistance gene in pBAD33 is replaced by a fragment of the kanamycin resistance gene encoding amino acids 1 to 118 of aminoglycoside 3′-phosphotransferase followed by the N-terminal fragment of the split gp41-1 intein. Similarly, the ampicillin resistance gene in pTrc99a is replaced by the C-terminal fragment of gp41-1 followed by a fragment of the kanamycin resistance gene encoding amino acids 119 to 271 of aminoglycoside 3′-phosphotransferase. For more efficient splicing, the local exteins (SGY and SSS) are included. c Bar graph showing the transformation efficiency in E. coli TOP10 cells of the indicated plasmids. Values represent mean (± standard error of the mean) of three independent experiments. d Ethidium bromide-stained agarose gel showing plasmid DNA isolated from two randomly picked clones obtained after transformation of E. coli TOP10 cells with the SiMPl plasmids shown in (a) and (b). e PCR analysis of the SiMPl plasmids isolated from bacteria. pET28a was used as control to show the product obtained after amplification of the full-length kanamycin resistance gene. f Representative fluorescence microscopy images of E. coli TOP10 cells carrying the SiMPl plasmids shown in (a) and (b) induced with 0.1% arabinose and 1 mM IPTG for 3 h. Scale bar, 3 μm. Source data are provided as a Source Data file
Fig. 3
Fig. 3
Characterization of SiMPl based on kanamycin. a, b gp41-1-mediated reconstitution of aminoglycoside 3′-phosphotransferase is needed to confer resistance to kanamycin. a Representative image of liquid cultures of E. coli TOP10 cells carrying either no plasmids (Tube # 1) or the SiMPl plasmids shown in Fig. 1 a and b (Tubes # 2-5), with (Tubes # 2-4) or without (Tube #5) the indicated mutations to gp41-1. gp41-1N MUT, mutation of the conserved cysteine at the very N-terminus of the N-terminal intein fragment to alanine; gp41-1C MUT, mutation of the conserved asparagine at the very C-terminus of the C-terminal intein fragment to alanine; WT, wild type. b Bar graph showing the values of the absorbance at 600 nm for the cultures in (a). Values represent mean (± standard error of the mean) of three independent experiments. c Transformation of SiMPl plasmids is more efficient than transformation of two classical plasmids carrying full-length resistance genes. Bar graph showing transformation efficiency in E. coli TOP10 cells of the indicated plasmids. For the “No plasmid” case, no antibiotic was applied to the plate. For all other cases, the appropriate antibiotics were added to the plates at a final concentration of 50 μg/mL for kanamycin, 100 μg/mL for ampicillin and 35 μg/mL for chloramphenicol. Values represent mean (± standard error of the mean) of three independent experiments. d SiMPl plasmids are maintained in bacteria. Ethidium bromide-stained agarose gel showing plasmid DNA isolated at the indicated time points from a culture of E. coli TOP10 cells transformed with the SiMPl plasmids based on kanamycin grown for a month. Source data are provided as a Source Data file
Fig. 4
Fig. 4
SiMPl based on chloramphenicol and ampicillin. a, b Root mean square fluctuation (RMSF) of Cα atoms in chloramphenicol acetyltransferase (PDB ID: 1q23) (a) and TEM-1 β-lactamase (PDB ID: 1zg4) (b) obtained from protein structure fluctuation simulations via the CABS-flex 2.0 web-server. Flexible regions, within which splice sites were selected, are indicated by black arrows. c, d Crystal structure of TEM-1 β-lactamase (PDB ID: 1zg4) (c) and chloramphenicol acetyltransferase (PDB ID: 1q23) (d). Residues that are part of the active site are represented as gray spheres. Splice sites are represented as sticks and are pointed at by black arrows. Asterisk (*), splice site where the N-terminal fragment of the enzyme showed some independent antibiotic activity. Section sign (§), splice site that did not support bacterial growth. e,h Bar graph showing the transformation efficiency in E. coli TOP10 cells of the indicated plasmids. Values represent mean (± standard error of the mean) of three independent experiments. i Ethidium bromide-stained agarose gel showing plasmid DNA isolated from two randomly picked clones obtained after transformation of E. coli TOP10 cells with the SiMPl plasmids based on chloramphenicol (CAM) and ampicillin (AMP). j Bar graph showing the transformation efficiency in E. coli TOP10 cells of the indicated plasmids. Values represent mean (± standard error of the mean) of three independent experiments. Source data are provided as a Source Data file
Fig. 5
Fig. 5
SiMPl based on hygromycin and puromycin. a, f Root mean square fluctuation (RMSF) of Cα atoms in hygromycin B phosphotransferase (PDB ID: 3w0s) (a) and the model structure of puromycin acetyltransferase (f) obtained from protein structure fluctuation simulations via the CABS-flex 2.0 web-server. Flexible regions, within which splice sites were selected, are indicated by black arrows. b Crystal structure of hygromycin B phosphotransferase (PDB ID: 3w0s). g Tertiary structure model of puromycin acetyltransferase. (b) and (g) Residues that are part of the active site are represented as gray spheres. Splice sites are represented as sticks and are pointed at by black arrows. Section sign (§), splice site that did not support bacterial growth. c, h Bar graph showing the transformation efficiency in E. coli TOP10 cells of the indicated plasmids. Values represent mean (± standard error of the mean) of three independent experiments. d, i Ethidium bromide-stained agarose gel showing plasmid DNA isolated from two clones obtained after transformation with the SiMPl plasmids based on hygromycin (d) and puromycin (i). e Schematic representation of the N-terminal intein construct in pSiMPh_N based on hygromycin. The last few residues of the N-terminal fragment of hygromycin B phosphotransferase are shown. The residue that was mutated in vivo by the bacteria is highlighted (white, WT residue; red, acquired residue). Source data are provided as a Source Data file
Fig. 6
Fig. 6
SiMPl plasmids increase production of the non-ribosomal peptide indigoidine. a Images of BAP1 cells producing indigoidine on plate (left) and in liquid culture (right). b Schematic of indigoidine biosynthesis. AGln, Adenylation (A) domain specific for glutamine; Ox, oxidation domain embedded within the A domain; PCP, peptidyl carrier protein domain. The PCP domain is depicted with the PPant arm attached to it; TE, thioesterase domain. c Schematic representation of the truncated BpsA (BpsAΔTE) and the externally supplied TE domain used in this study. d, e Schematic of the plasmids used in (f). f Bar graph showing the absorbance at 610 nm of overnight expression cultures in 85% DMSO of BAP1 cells expressing the indicated constructs from the indicated plasmids induced with 100 μM IPTG at 18 °C. Values were normalized to the value of the control (full-length BpsA expressed from pTrc99a) and represent mean (± standard error of the mean) of three biological replicates. ns, not significant (two-tailed, homoscedastic Student’s t test).; double asterisk (**), p-value < 0.01 (two-tailed, heteroscedastic Student’s t test). pCDF, plasmid shown in (e). Source data are provided as a Source Data file
Fig. 7
Fig. 7
SiMPl plasmids increase production of the non-proteinogenic aromatic amino acid L-PAPA. a Schematic showing the de novo L-PAPA biosynthesis pathway in E. coli. Broken arrows indicate incomplete presentation of the metabolic pathway. Plasmid-borne overexpressed enzymes are colored. AroF, DAHP synthase; AroB, dehydroquinate synthase; AroL, shikimate kinase; GlpX, fructose-1,6-bisphosphate phosphatase; PabAB, 4-amino-4-deoxychorismate synthase; PapB, 4-amino-4-deoxychorismate mutase; PapC, 4-amino-4-deoxyprephenate dehydrogenase; PheA, bifunctional chorismate mutase/ prephenate dehydratase; TktA, transketolase A; TyrA, bifunctional chorismate mutase/ prephenate dehydrogenase. b Schematic showing the plasmids used in (c) and (d). c, d L-PAPA production in E. coli FUS4.7 R cells cultivated in flasks (c) or in a bioreactor (d). Optical density (OD600) is shown in white. L-PAPA concentration in violet and green. Circles, production from cells co-transformed with pC53BC and pJNT-aroFBL; Squares, production from cells co-transformed with pC53BC_SiMPlk_C and pJNT- SiMPLk_N; Vertical dotted line, time at which production is initiated by addition of IPTG (0.5 mM final concentration). Values represent mean (± standard deviation) of three independent experiments. Source data are provided as a Source Data file
Fig. 8
Fig. 8
SiMPl can be used to select human T cells with puromycin. a Schematic of the SiMPl lentiviral vectors encoding mTagBFP2 and ZsGreen1 where the puromycin acetyltransferase is split at position V82:E83. b Schematic of the workflow. c T cells selected on puromycin after transduction with the two lentiviruses in (a) are 100% positive for mTagBFP2 and ZsGreen1. Left panel, representative flow cytometric analysis of mTagBFP2 and ZsGreen1 expression in living cells gated using forward versus side scatter. The numbers indicate the percentage of mTagBFP2- and/or ZsGreen1-positive cells in the indicated quadrants. Right panel, stacked bar chart showing the percentage of cells in the four quadrants (lower left, ZsGreen1 mTagBFP2; lower right, ZsGreen1+ mTagBFP2; upper left, ZsGreen1 mTagBFP2+; upper right, ZsGreen1+ mTagBFP2+) at the indicated conditions. Values represent mean (± standard deviation) of three independent experiments. Standard bar graphs with individual data points are shown in Supplementary Fig. 20. Source data are provided as a Source Data file
Fig. 9
Fig. 9
SiMPl allows selecting functional Jurkat T cells expressing a murine TCR on their surface. a Schematic of the SiMPl lentiviral vectors encoding TCRα and TCRβ where the puromycin acetyltransferase is split at position V82:E83. b Schematic of the workflow. c TCRα-TCRβ- Jurkat T cells selected on puromycin after transduction with the two lentiviruses in (a) are 100% positive for the TCR. Left panel, representative histograms of living cells gated using forward versus side scatter and propidium iodide staining. Numbers indicate the percentage of cells expressing murine TCRβ on their surface (TCRαβ indicates that TCRα must be expressed to allow presentation of TCRβ on the cell surface). Right panel, stacked bar chart showing the percentage of TCRαβ+ cells for the indicated conditions. Values represent mean (± standard deviation) of three independent experiments. Standard bar graphs with individual data points are shown in Supplementary Fig. 25a. d Selected cells are functional. Intracellular calcium levels after stimulation with anti-murine TCRβ antibodies for the indicated cells. Left panel, dot plots of the calcium response depicted as ratio of Fluo-3 to Fura Red fluorescence over time. Right panel, overlay of the calcium responses of puromycin selected cells transduced with 6, 12 or 24 µL of concentrated lentivirus. The graph shows the 70th percentile of the ratio of Fluo-3 to Fura Red fluorescence over time. Source data are provided as a Source Data file
Fig. 10
Fig. 10
Characterization of further splice sites for puromycin acetyltransferase in human T cells. a Schematic representation of puromycin acetyltransferase where splice sites, and first and last amino acids are indicated. Remaining amino acids are shown as dots. Numbers represent the amino acid position. The first identified splice site V82:E83 is highlighted in red. E80:S81, G100:S101 and N192:C192 are scarless constructs, while V37:D38, V82:E83 and W191:C192 contain a scar of six residues (‘SGY’ at positions −3, −2, −1 and ‘SSS’, at positions +1, +2, +3). b Flow cytometric analysis of Jurkat T cells transduced with the indicated constructs. Upper left and lower panel, representative histograms of living cells gated using forward versus side scatter. Numbers indicate the percentage of murine TCRβ+ cells. Upper right panel, stacked bar chart showing the percentage of murine TCRβ+ cells under the indicated conditions. Values represent mean (± standard deviation) of three independent experiments. Standard bar graphs with individual data points are shown in Supplementary Fig. 25b. Source data are provided as a Source Data file

Similar articles

Cited by

References

    1. Hirata R, et al. Molecular structure of a gene, VMA1, encoding the catalytic subunit of H(+)-translocating adenosine triphosphatase from vacuolar membranes of Saccharomyces cerevisiae. J. Biol. Chem. 1990;265:6726–6733. - PubMed
    1. Kane PM, et al. Protein splicing converts the yeast TFP1 gene product to the 69-kD subunit of the vacuolar H(+)-adenosine triphosphatase. Science. 1990;250:651–657. - PubMed
    1. Brenzel S, Kurpiers T, Mootz HD. Engineering artificially split inteins for applications in protein chemistry: biochemical characterization of the split Ssp DnaB intein and comparison to the split Sce VMA intein. Biochemistry. 2006;45:1571–1578. - PubMed
    1. Zettler J, Schutz V, Mootz HD. The naturally split Npu DnaE intein exhibits an extraordinarily high rate in the protein trans-splicing reaction. FEBS Lett. 2009;583:909–914. - PubMed
    1. Siu KH, Chen W. Control of the Yeast mating pathway by reconstitution of functional alpha-factor using split intein-catalyzed reactions. ACS Synth. Biol. 2017;6:1453–1460. - PubMed

Publication types