Size, Shape, and Distribution of Multivesicular Bodies in the Juvenile Rat Somatosensory Cortex: A 3D Electron Microscopy Study
- PMID: 31665237
- PMCID: PMC7132939
- DOI: 10.1093/cercor/bhz211
Size, Shape, and Distribution of Multivesicular Bodies in the Juvenile Rat Somatosensory Cortex: A 3D Electron Microscopy Study
Abstract
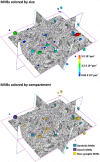
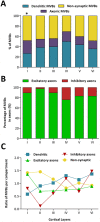
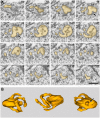
Multivesicular bodies (MVBs) are membrane-bound organelles that belong to the endosomal pathway. They participate in the transport, sorting, storage, recycling, degradation, and release of multiple substances. They interchange cargo with other organelles and participate in their renovation and degradation. We have used focused ion beam milling and scanning electron microscopy (FIB-SEM) to obtain stacks of serial sections from the neuropil of the somatosensory cortex of the juvenile rat. Using dedicated software, we have 3D-reconstructed 1618 MVBs. The mean density of MVBs was 0.21 per cubic micron. They were unequally distributed between dendrites (39.14%), axons (18.16%), and nonsynaptic cell processes (42.70%). About one out of five MVBs (18.16%) were docked on mitochondria, representing the process by which the endosomal pathway participates in mitochondrial maintenance. Other features of MVBs, such as the presence of tubular protrusions (6.66%) or clathrin coats (19.74%) can also be interpreted in functional terms, since both are typical of early endosomes. The sizes of MVBs follow a lognormal distribution, with differences across cortical layers and cellular compartments. The mean volume of dendritic MVBs is more than twice as large as the volume of axonic MVBs. In layer I, they are smaller, on average, than in the other layers.
Keywords: 3D electron microscopy; FIB-SEM; cerebral cortex; endosomal pathway; multivesicular bodies.
© The Author(s) 2019. Published by Oxford University Press.
Figures


Similar articles
-
A Quantitative Study on the Distribution of Mitochondria in the Neuropil of the Juvenile Rat Somatosensory Cortex.Cereb Cortex. 2018 Oct 1;28(10):3673-3684. doi: 10.1093/cercor/bhy159. Cereb Cortex. 2018. PMID: 30060007 Free PMC article.
-
Volume electron microscopy of the distribution of synapses in the neuropil of the juvenile rat somatosensory cortex.Brain Struct Funct. 2018 Jan;223(1):77-90. doi: 10.1007/s00429-017-1470-7. Epub 2017 Jul 18. Brain Struct Funct. 2018. PMID: 28721455 Free PMC article.
-
Study of the Size and Shape of Synapses in the Juvenile Rat Somatosensory Cortex with 3D Electron Microscopy.eNeuro. 2018 Jan 30;5(1):ENEURO.0377-17.2017. doi: 10.1523/ENEURO.0377-17.2017. eCollection 2018 Jan-Feb. eNeuro. 2018. PMID: 29387782 Free PMC article.
-
Multivesicular bodies in neurons: distribution, protein content, and trafficking functions.Prog Neurobiol. 2011 Mar;93(3):313-40. doi: 10.1016/j.pneurobio.2011.01.003. Epub 2011 Jan 7. Prog Neurobiol. 2011. PMID: 21216273 Free PMC article. Review.
-
Focus on the morphogenesis, fate and the role in tumor progression of multivesicular bodies.Cell Commun Signal. 2020 Aug 8;18(1):122. doi: 10.1186/s12964-020-00619-5. Cell Commun Signal. 2020. PMID: 32771015 Free PMC article. Review.
Cited by
-
A multivesicular body-like organelle mediates stimulus-regulated trafficking of olfactory ciliary transduction proteins.Nat Commun. 2022 Nov 12;13(1):6889. doi: 10.1038/s41467-022-34604-y. Nat Commun. 2022. PMID: 36371422 Free PMC article.
-
Keeping synapses in shape: degradation pathways in the healthy and aging brain.Neuronal Signal. 2022 Jun 15;6(2):NS20210063. doi: 10.1042/NS20210063. eCollection 2022 Jun. Neuronal Signal. 2022. PMID: 35813265 Free PMC article. Review.
-
Paracoccidioides brasiliensis Induces α3 Integrin Lysosomal Degradation in Lung Epithelial Cells.J Fungi (Basel). 2023 Sep 8;9(9):912. doi: 10.3390/jof9090912. J Fungi (Basel). 2023. PMID: 37755020 Free PMC article.
References
-
- Baddeley A, Turner R. 2005. Spatstat: an R package for analyzing spatial point patterns. J Stat Softw. 12:1–42.
-
- Baddeley AJ, Moyeed RA, Howard CV, Boyde A. 1993. Analysis of a three-dimensional point pattern with replication. J R Stat Soc Ser C Appl Stat. 42:641–668.

