. 2019 Oct 29;9(1):15485.
doi: 10.1038/s41598-019-51998-w.

Nucleosomal dsDNA Stimulates APOL1 Expression in Human Cultured Podocytes by Activating the cGAS/IFI16-STING Signaling Pathway

Affiliations

Nucleosomal dsDNA Stimulates APOL1 Expression in Human Cultured Podocytes by Activating the cGAS/IFI16-STING Signaling Pathway

Shamara E Davis et al. Sci Rep. .

Abstract

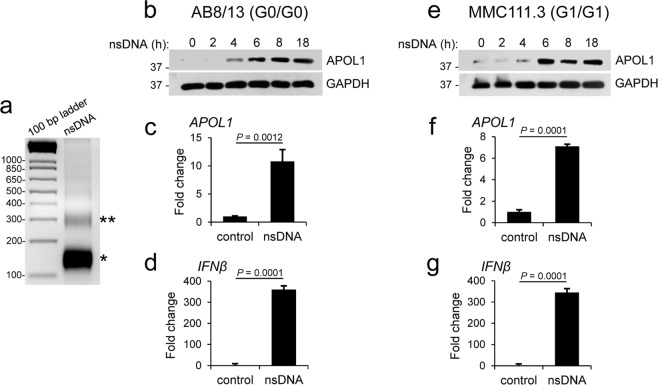
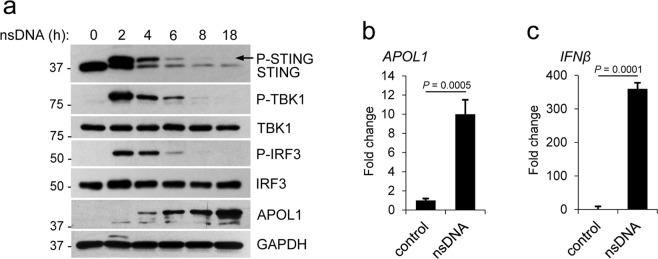
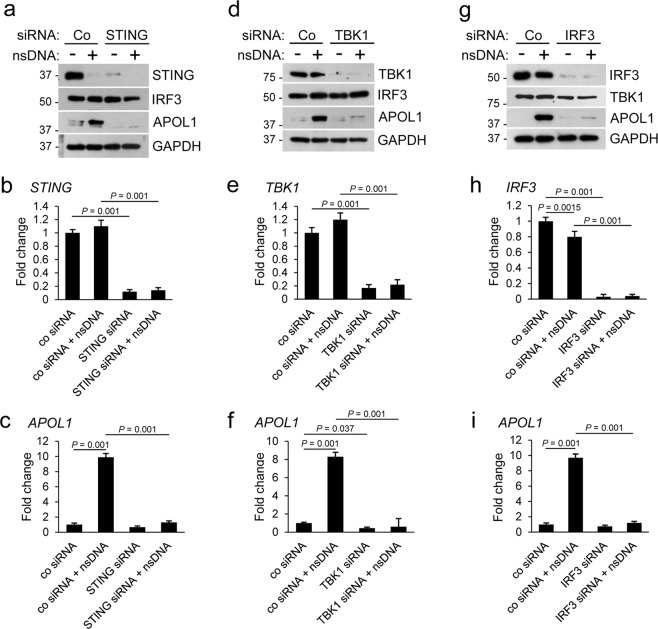
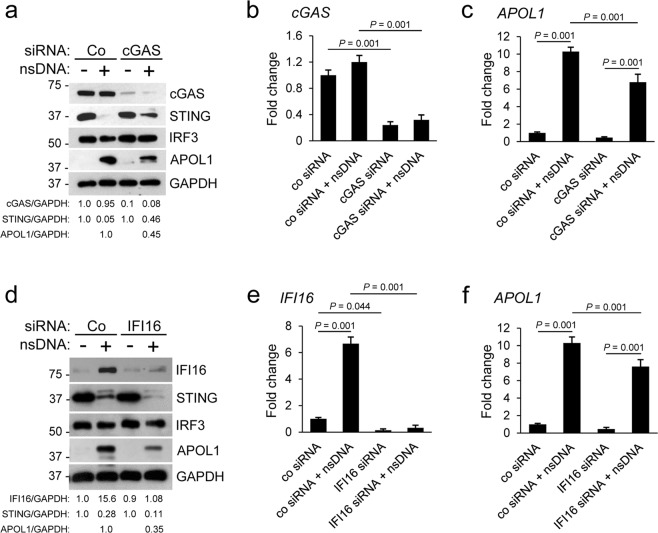
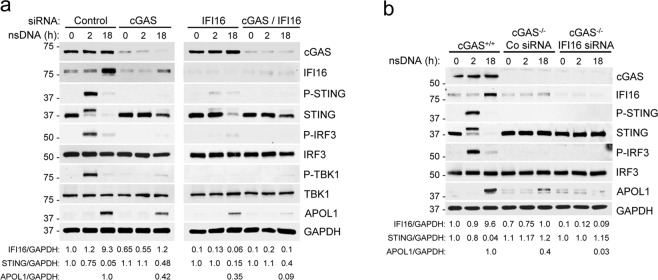
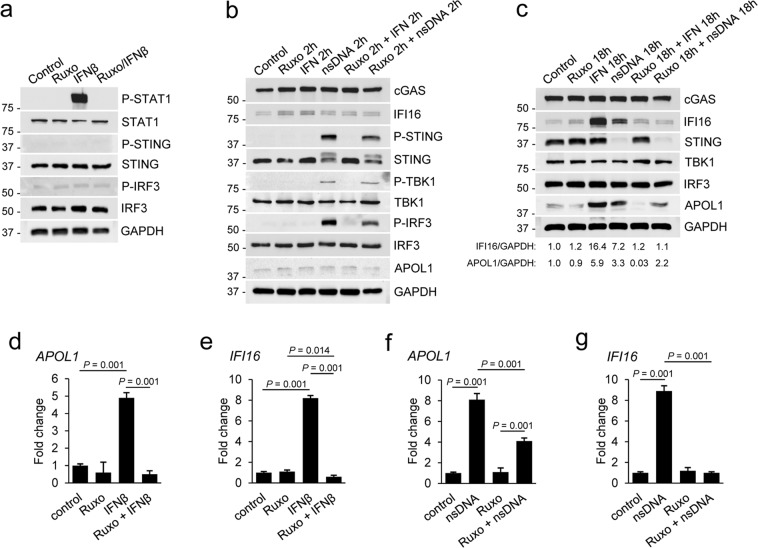
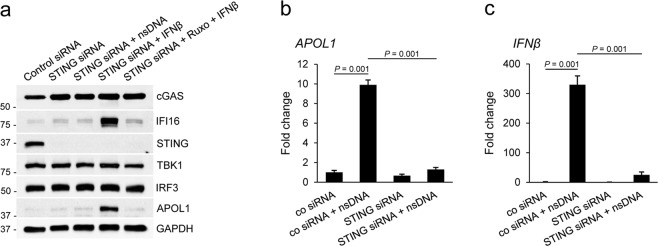
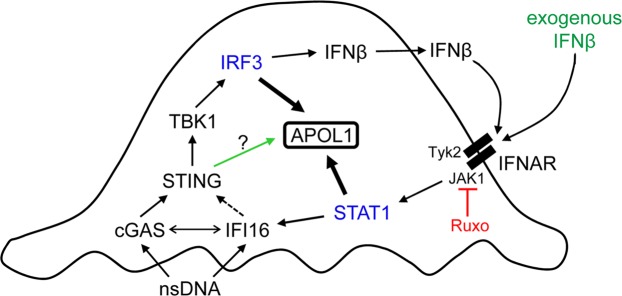
APOL1 alleles G1 and G2 are associated with faster progression to lupus nephritis (LN)-associated end-stage renal disease (LN-ESRD) in African Americans. Increased levels of type I interferons (IFNs) and nucleosome-associated double-stranded DNA (dsDNA) fragments (nsDNA) are the hallmark of this disease. Here, we identify cyclic GMP-AMP synthase (cGAS) and interferon-inducible protein 16 (IFI16) as the major DNA sensors in human immortalized podocytes. We also show that nsDNA triggers the expression of APOL1 and IFNβ via IRF3 activation through the cGAS/IFI16-STING pathway. We demonstrate that maximal APOL1 expression also requires the activation of type I IFN receptor (IFNAR) and STAT1 signaling triggered by IFNβ produced in response to nsDNA, or by exogenous IFNβ. Finally, we show that STAT1 activation is sufficient to upregulate IFI16, subsequently boosting APOL1 expression through a positive feedback mechanism. Collectively, we find that nsDNA-induced APOL1 expression is mediated by both IFNβ-independent and dependent signaling pathways triggered by activation of the cGAS/IFI16-STING pathway. We propose that simultaneous inhibition of STING and the IFNAR-STAT1 pathway may attenuate IFI16 expression, reduce IFI16-cGAS cross-talk, and prevent excessive APOL1 expression in human podocytes in response to nsDNA.


Conflict of interest statement

The authors declare no competing interests.

Figures

Figure 1
Figure 1
Nucleosome-derived dsDNA (nsDNA) stimulates APOL1 expression in human immortalized AB8/13 and urine-derived MMC111.3 podocytes. (a) Analysis of nsDNA prepared from the nuclei of AB8/13 cells on 2% agarose gel (500 ng/lane) followed by ethidium bromide staining shows that over 95% of nsDNA was mono-nucleosomal DNA (approximately 146 bp). Stars indicate mono- (*) and di- (**) nucleosomal DNA. (b) APOL1 protein expression in AB8/13 podocytes transfected with 1 μg ml−1 nsDNA for the indicated times (h) was analyzed by Western blotting. Protein size markers (kDa) are shown. GAPDH protein levels served as the loading control. The membrane was probed for APOL1 and re-probed for GAPDH. The full images are shown in Supplementary Fig. S1. (c,d) Expression of APOL1 (c) and IFNβ (d) mRNA in mock-transfected AB8/13 cells (control) and cells transfected with 1 μg ml−1 nsDNA for 18 h was analyzed by qRT-PCR. (e) APOL1 protein expression in MMC111.3 podocytes transfected with 1 μg ml−1 nsDNA for the indicated times (h) was analyzed by immunoblotting. The membrane was probed for APOL1 and re-probed for GAPDH. Full images of the blots are shown in Supplementary Fig. S1. (f,g) Expression of APOL1 (f) and IFNβ (g) mRNA in mock-transfected MMC111.3 (control) and cells transfected with 1 μg ml−1 nsDNA for 18 h was analyzed by qRT-PCR. mRNA expression was normalized to GAPDH mRNA levels. Data are expressed as means ± SEM of four (c,d) or three (f,g) biological replicates (unpaired Student’s t-test).
Figure 2
Figure 2
nsDNA-mediated APOL1 expression in human immortalized AB8/13 podocytes involves activation of the STING-TBK1-IRF3 pathway. (a) AB8/13 podocytes were transfected with 1 μg ml−1 nsDNA for the times indicated. Expression levels of APOL1, STING, TBK1, and IRF3 were analyzed by immunoblotting. STING and phospho-STING (P-STING, marked by an arrow) were detected using antibodies against STING. GAPDH protein levels (loading control) and protein size markers (kDa) are indicated. The blot images were obtained from different gels. The blot probed for IRF3 was re-probed for APOL1. Other blot images were cropped from individually probed blots. Full images of the blots are shown in Supplementary Fig. S2. (b,c) Expression of APOL1 (b) and IFNβ (c) mRNA in mock-transfected AB8/13 cells (control) and cells transfected with 1 μg ml−1 nsDNA for 18 h was analyzed by qRT-PCR. mRNA expression was normalized to GAPDH mRNA levels. Data are expressed as means ± SEM of four biological replicates (unpaired Student’s t-test).
Figure 3
Figure 3
Knockdown of STING, TBK1, or IRF3 inhibits nsDNA-mediated APOL1 expression in human immortalized AB8/13 podocytes. AB8/13 podocytes were transfected with a non-targeting control siRNA (Co) or siRNA pool targeting STING (ac), TBK1 (df), or IRF3 (g-i) for 48 h, and subsequently transfected with 1 μg ml−1 nsDNA for 18 h. Expression of indicated proteins (a,d,g) was analyzed by immunoblotting. Protein size markers (kDa) are shown. The blot images in (a) were obtained from different gels. One blot was probed for IRF3 and re-probed for GAPDH. Blot images in (d) were obtained from different gels. One blot was probed with TBK1 and re-probed with GAPDH, while two other blots were probed for APOL1 and TBK1. The blot images in (g) were obtained from different gels. The blot probed for TBK1 was re-probed for GAPDH. Two other blots were probed individually for IRF3 and APOL1. Full images of the blots are shown in Supplementary Fig. S3. Expression of STING (b), TBK1 (e), IRF3 (h), and APOL1 (c,f,i) mRNA was analyzed by qRT-PCR and normalized to GAPDH mRNA levels. Data are expressed as means ± SEM from three biological replicates (one-way ANOVA with post-hoc Tukey test).
Figure 4
Figure 4
Synthetic cGAMP activates the STING-TBK1-IRF3 pathway and stimulates APOL1 expression. Human immortalized AB8/13 podocytes were transfected with 1 μg ml−1 nsDNA or 4 μg ml−1 2′3′-cGAMP for the times indicated. Control cells were either left untreated (0 h) or mock transfected for 18 h. Expression of indicated proteins was analyzed by immunoblotting. Protein size markers (kDa) are indicated. The blot images were obtained from different gels. The blot probed for P-TBK1 was re-probed for STING. The other blots were probed individually for the indicated proteins. Full images of the blots are shown in Supplementary Fig. S4.
Figure 5
Figure 5
Knockdown of cGAS or IFI16 partly inhibits nsDNA-mediated APOL1 expression in human immortalized AB8/13 podocytes. The cells were transfected for 48 h with control siRNA (Co) or siRNA pool targeting cGAS (ac) or IFI16 (df) and subsequently transfected with 1 μg ml−1 nsDNA for 18 h. (a,d) Expression of indicated proteins was analyzed by immunoblotting. Protein size markers (kDa) are shown. Intensities of cGAS, STING, IFI16, APOL1, and GAPDH protein bands were quantified by densitometric scanning. (a) Expression levels of cGAS, STING, and APOL1 were normalized against GAPDH levels and presented as cGAS/GAPDH, STING/GAPDH, and APOL1/GAPDH ratios. In cells transfected with control siRNA only, the cGAS/GAPDH and STING/GAPDH ratios were both set as 1.0. The APOL1/GAPDH ratio in cells transfected with control siRNA and nsDNA was set as 1.0. The blot images were obtained from different individually probed gels. (d) Expression levels of IFI16, STING, and APOL1 are presented as IFI16/GAPDH, STING/GAPDH, and APOL1/GAPDH ratios. In cells transfected with control siRNA only, the IFI16/GAPDH and STING/GAPDH ratios were both set as 1.0. The APOL1/GAPDH ratio in cells transfected with control siRNA and nsDNA was set as 1.0. The blot images were obtained from different gels. The blot probed for APOL1 was re-probed for IRF3. Full images of the blots in (a) and (d) are shown in Supplementary Fig. S5. Expression of cGAS (b), IFI16 (e), and APOL1 (c,f) mRNA was analyzed by qRT-PCR and normalized to GAPDH mRNA levels. Data are expressed as means ± SEM from three biological replicates (one-way ANOVA with post-hoc Tukey test).
Figure 6
Figure 6
cGAS and IFI16 are required for maximal APOL1 expression in human immortalized AB8/13 podocytes in response to nsDNA. (a) AB8/13 podocytes were transfected for 48 h with control siRNA (Co) or siRNA pool targeting either cGAS or IFI16 or both. The cells were subsequently transfected with 1 μg ml−1 nsDNA for the times indicated. The blot images were obtained from different gels. Left panel: The blot probed for cGAS was re-probed for GAPDH. The blot probed for APOL1 was re-probed for TBK1. Right panel: The blot probed for cGAS was re-probed for GAPDH. The blot probed for APOL1 was re-probed for TBK1. Expression levels of IFI16, STING, and APOL1 are presented as IFI16/GAPDH, STING/GAPDH, and APOL1/GAPDH ratios. The IFI16/GAPDH and STING/GAPDH ratios in cells transfected with control siRNA only were both set as 1.0. The APOL1/GAPDH ratio in cells transfected with control siRNA and nsDNA (18 h) was set as 1.0. (b) cGAS−/− cells generated from parental AB8/13 podocytes (cGAS+/+) were transfected for 48 h with control siRNA (Co) or siRNA pool targeting IFI16 and subsequently transfected with 1 μg ml−1 nsDNA for the times indicated. Expression of indicated proteins was analyzed by immunoblotting. Protein size markers (kDa) are shown. The blot images were obtained from different gels. The blot probed for cGAS was re-probed for GAPDH. The other blot images were cropped from individually probed blots. The IFI16/GAPDH and STING/GAPDH ratios in cGAS+/+ cells exposed to transfection reagent only were both set as 1.0. The APOL1/GAPDH ratio in cGAS+/+ cells transfected with nsDNA (18 h) was set as 1.0. Full images of the blots are shown in Supplementary Fig. S6.
Figure 7
Figure 7
nsDNA-induced APOL1 expression is partly attenuated by JAK1/JAK2 inhibitor Ruxolitinib. (a) Ruxolitinib (Ruxo) inhibited IFNβ-mediated phosphorylation of STAT1. Sets of AB8/13 podocytes were treated with DMSO (solvent) only (Control), treated for 2 h with 5 μM Ruxo, treated for 15 min with 10 ng ml−1 IFNβ, or pretreated with Ruxo for 2 h followed by IFNβ stimulation for 15 min (Ruxo/IFNβ). The blot images were obtained from different gels. The blot probed for P-STAT1 was re-probed for GAPDH. (b,c) AB8/13 podocytes were treated with Ruxo and IFNβ as indicated and subsequently transfected with 1 μg ml−1 nsDNA for 2 h (b) or 18 h (c). The IFI16/GAPDH and APOL1/GAPDH ratios in unstimulated cells (Control) were both set as 1.0. The blot images in (b) were obtained from different gels. The blot probed for P-IRF3 was re-probed for P-STING. Other blot images were cropped from individually probed blots. The blot images in (c) were obtained from different gels. The blot probed for IFI16 was re-probed for cGAS. Other blot images were cropped from individually probed blots. Full images of all blots are shown in Supplementary Fig. S7. (d,e) Ruxo abolished expression of APOL1 (d) and IFI16 mRNA (e) induced by exogenous IFNβ. (f,g) Ruxo partially inhibited nsDNA-induced APOL1 mRNA expression (f) but abolished nsDNA-induced IFI16 mRNA expression (g). Expression of APOL1 and IFNβ mRNA was analyzed by qRT-PCR 18 h after transfection with 1 μg ml−1 nsDNA. mRNA expression was normalized to GAPDH mRNA levels. Data are expressed as means ± SEM from three biological replicates (one-way ANOVA with post-hoc Tukey test).
Figure 8
Figure 8
STING knockdown inhibits nsDNA-induced expression of APOL1 and IFI16 but does not affect expression induced by exogenous IFNβ. (a) AB8/13 podocytes were transfected for 48 h with a non-targeting control siRNA or siRNA pool targeting STING. Subsequently, sets of the transfected cells were transfected for 18 h with 1 μg ml−1 nsDNA, treated for 18 h with IFNβ (10 ng ml−1), or pretreated with 5 μM Ruxo for 2 h followed by IFNβ stimulation for 18 h. Expression of indicated proteins was analyzed by immunoblotting. The blot images were obtained from different gels. The blot probed with IFI16 was re-probed with IRF3. Other blot images were cropped from individually probed blots. Full images of the blots are shown in Supplementary Fig. S8. (b,c) STING knockdown inhibited expression of APOL1 (b) and IFNβ mRNA (c) in response to nsDNA. AB8/13 podocytes were transfected for 48 h with a non-targeting control siRNA or siRNA pool targeting STING, followed by transfection with 1 μg ml−1 nsDNA for 18 h. Expression of APOL1 and IFNβ mRNA was normalized to GAPDH mRNA levels. Data are expressed as means ± SEM from three biological replicates (one-way ANOVA with post-hoc Tukey test).
Figure 9
Figure 9
Our proposed model of nsDNA-induced APOL1 expression through engagement of the cGAS/IFI16-STING pathway in human immortalized AB8/13 podocytes. Binding of cytosolic nsDNA by cGAS and IFI16 activates STING, which subsequently activates TBK1. Activated TBK1 phosphorylates IRF3, which promotes transcription of APOL1 and IFNβ. IFNβ released from the cells (or exogenous IFNβ) binds to IFNAR. IFNAR-associated JAK1 and Tyk2 kinases then phosphorylate STAT1, which promotes transcription of APOL1 and IFI16. A putative IFI16-mediated activation of STING is indicated by a dashed arrow. A potential cooperation between cGAS and IFI16 is indicated by a double-headed arrow. Deficient STING phosphorylation observed in cGAS- or IFI16-knockdown cells (Fig. 6) suggests that nsDNA-induced APOL1 expression may be mediated by a phospho-STING-independent pathway, marked by a green arrow. A dual JAK1/JAK2 inhibitor Ruxolitinib (Ruxo) suppresses STAT1 activation and thereby inhibits IFI16 expression and STAT1-mediated APOL1 expression. Since IFNAR-mediated signaling involves JAK1 but not JAK2, our model only depicts the inhibition of JAK1 by Ruxo. Ruxo does not affect IRF3-mediated APOL1 expression.

Similar articles

Cited by

References

    1. Laster M, Shen JI, Norris KC. Kidney Disease Among African Americans: A Population Perspective. Am J Kidney Dis. 2018;72:S3–S7. doi: 10.1053/j.ajkd.2018.06.021. - DOI - PMC - PubMed
    1. Norton JM, et al. Social Determinants of Racial Disparities in CKD. J Am Soc Nephrol. 2016;27:2576–2595. doi: 10.1681/ASN.2016010027. - DOI - PMC - PubMed
    1. Tzur S, et al. Missense mutations in the APOL1 gene are highly associated with end stage kidney disease risk previously attributed to the MYH9 gene. Hum Genet. 2010;128:345–350. doi: 10.1007/s00439-010-0861-0. - DOI - PMC - PubMed
    1. Genovese G, et al. Association of trypanolytic ApoL1 variants with kidney disease in African Americans. Science. 2010;329:841–845. doi: 10.1126/science.1193032. - DOI - PMC - PubMed
    1. Kopp JB, et al. APOL1 genetic variants in focal segmental glomerulosclerosis and HIV-associated nephropathy. J Am Soc Nephrol. 2011;22:2129–2137. doi: 10.1681/ASN.2011040388. - DOI - PMC - PubMed

Publication types