IL-2 Induces Transient Arrest in the G1 Phase to Protect Cervical Cancer Cells from Entering Apoptosis
- PMID: 31662754
- PMCID: PMC6791272
- DOI: 10.1155/2019/7475295
IL-2 Induces Transient Arrest in the G1 Phase to Protect Cervical Cancer Cells from Entering Apoptosis
Abstract
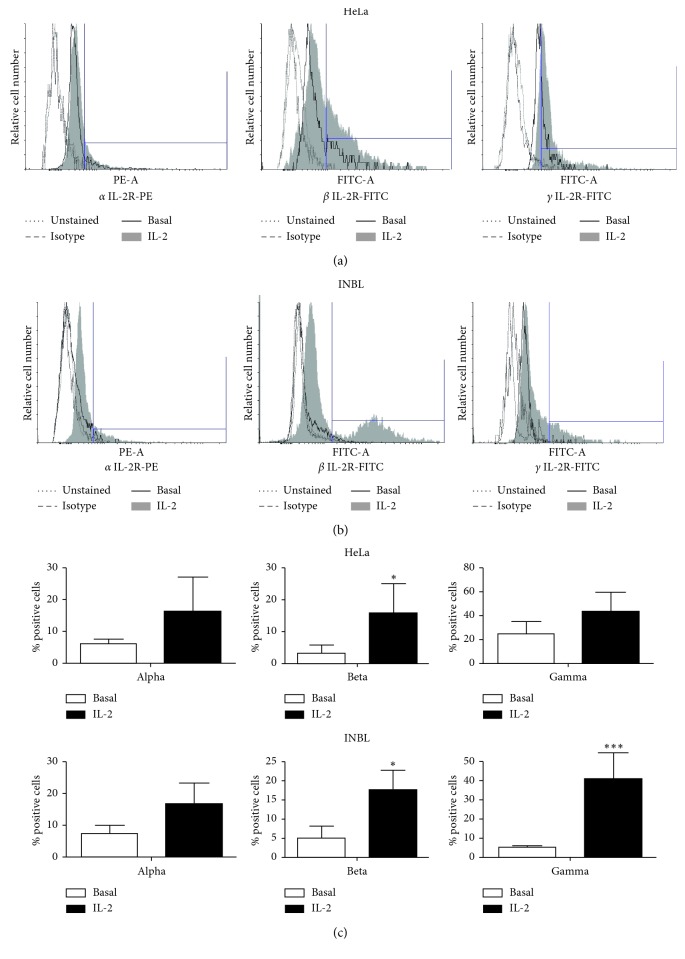
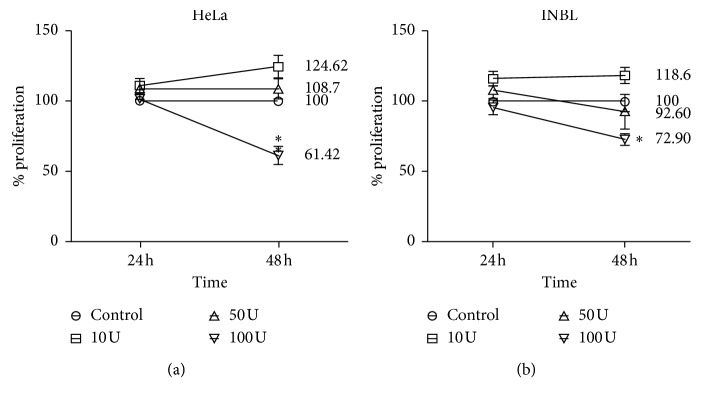
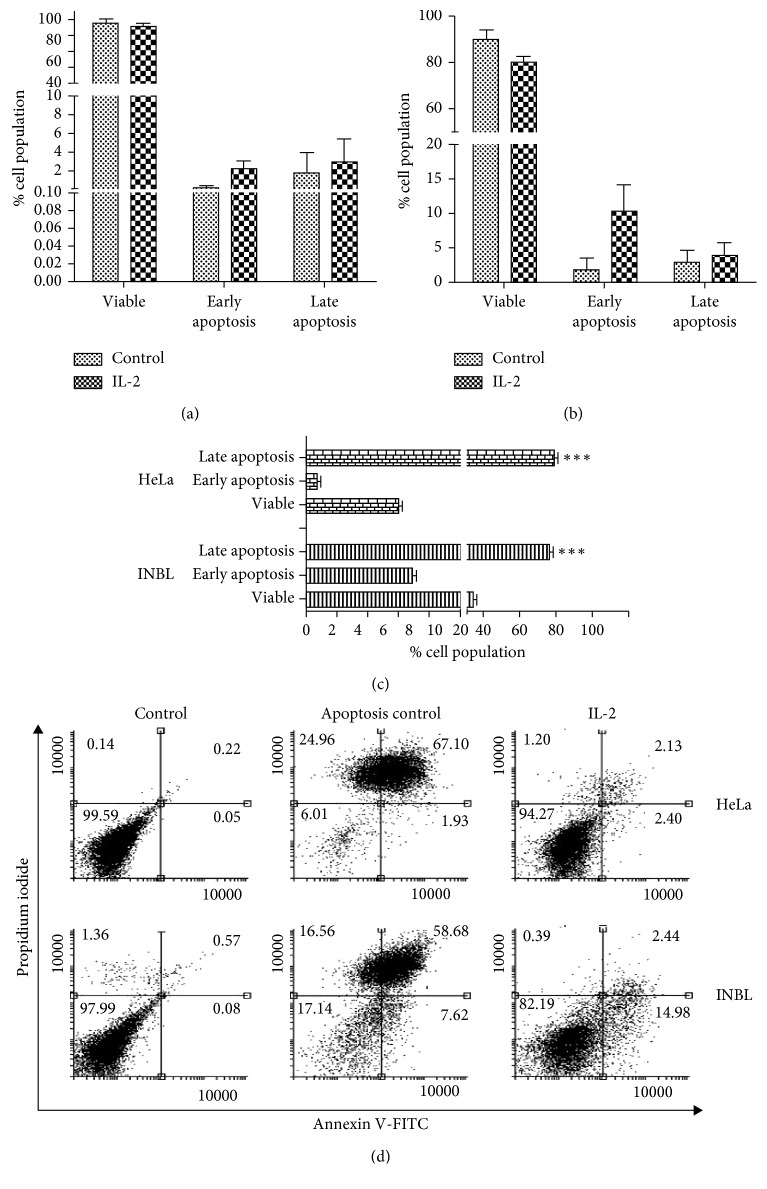
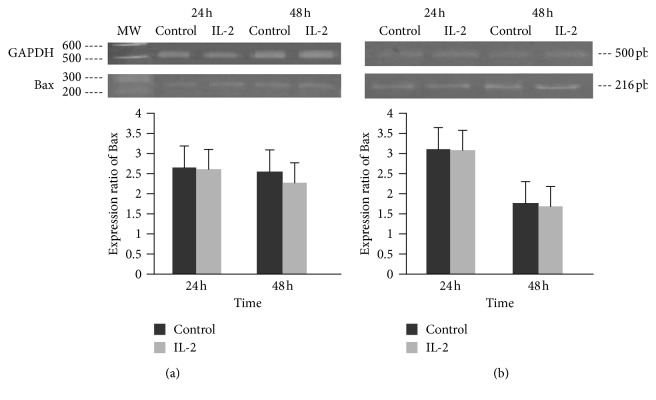
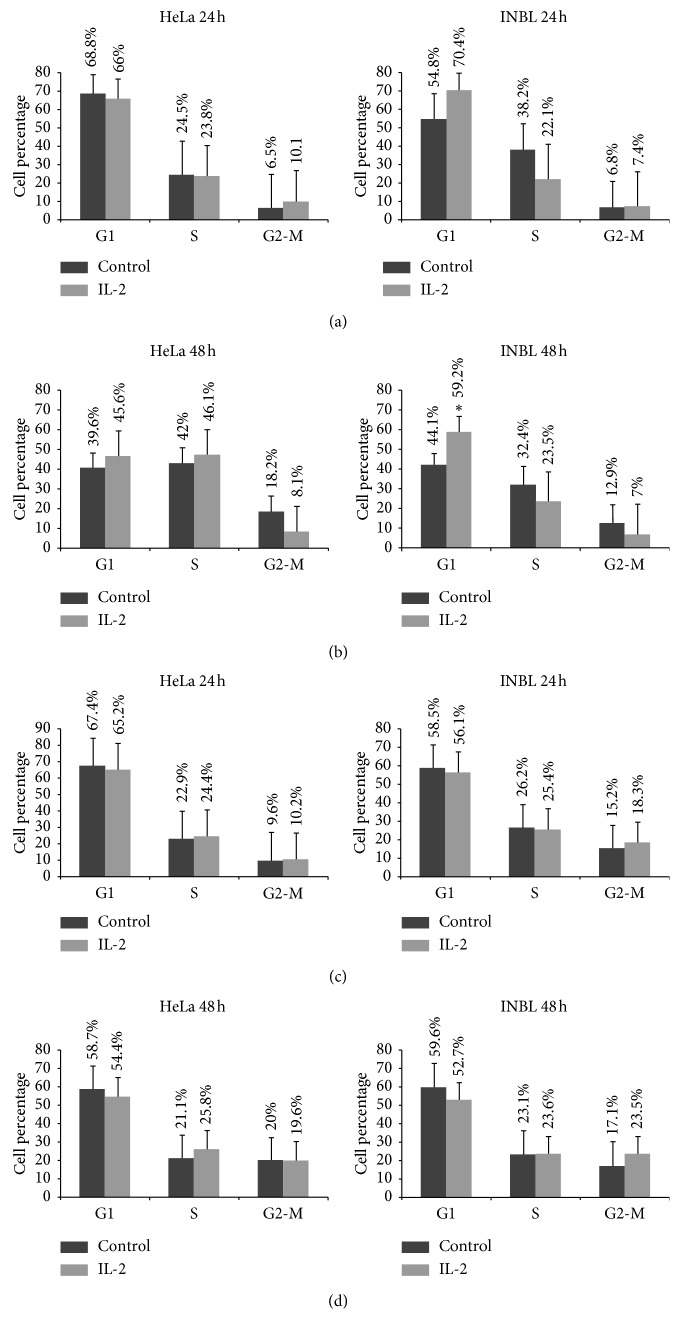
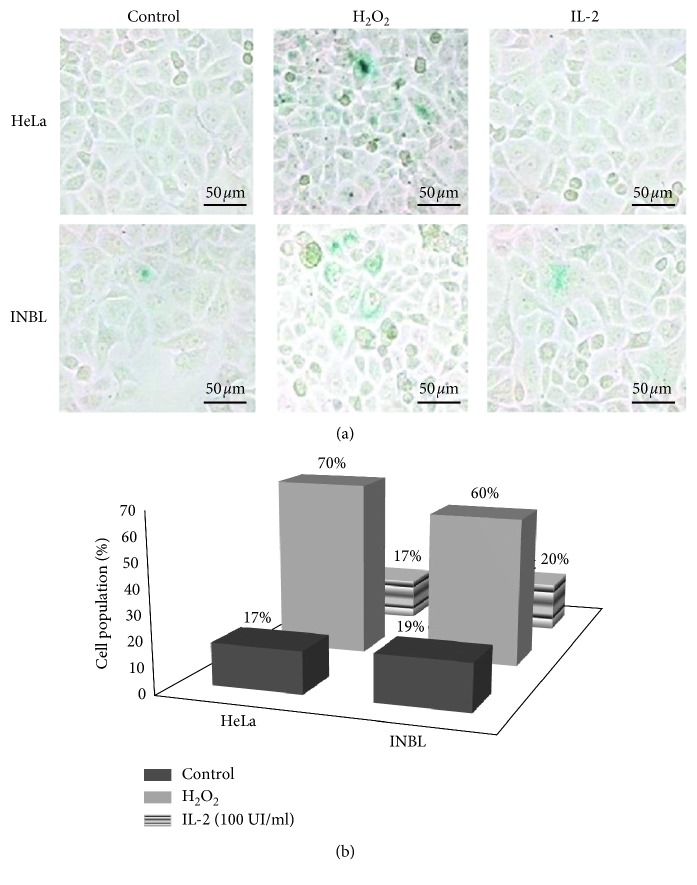
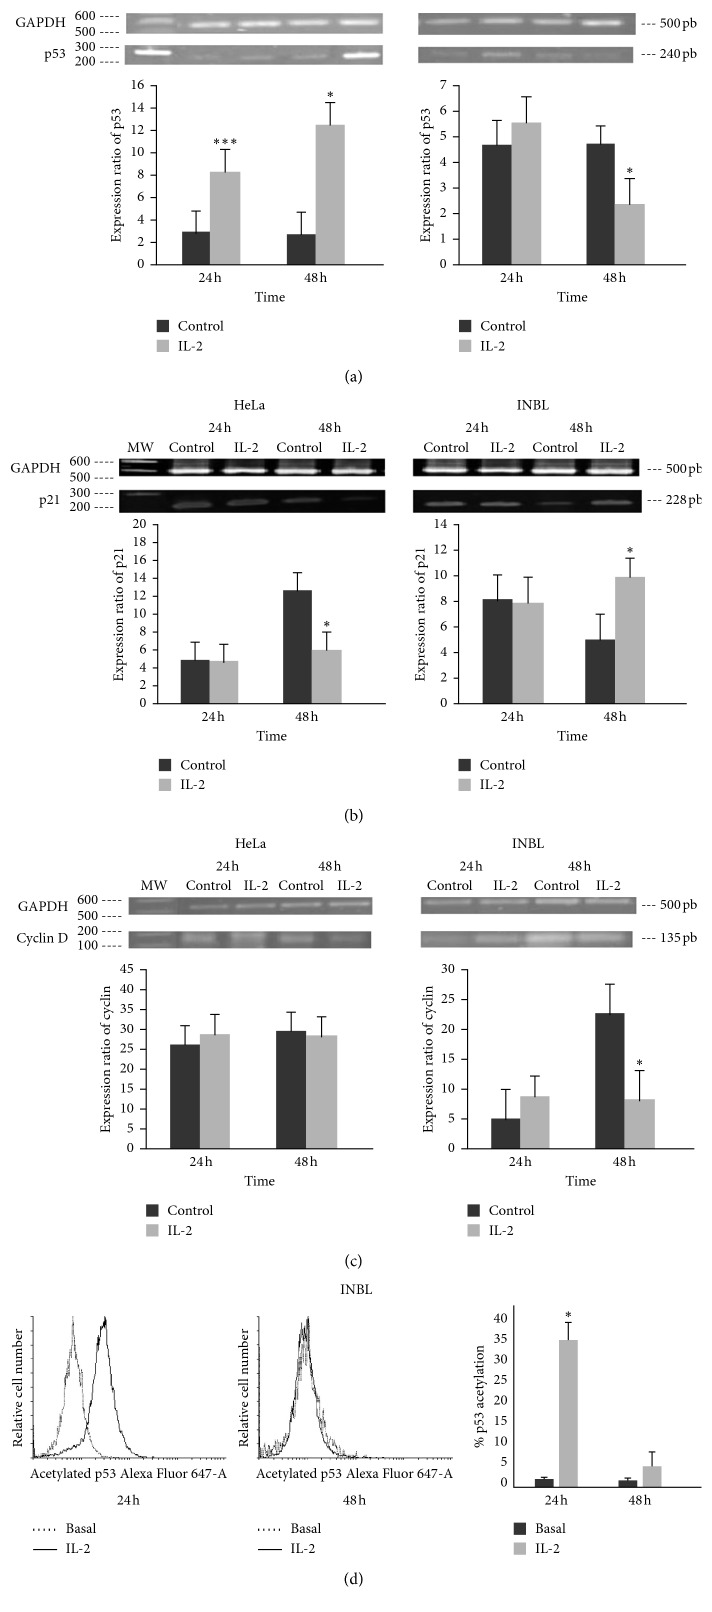
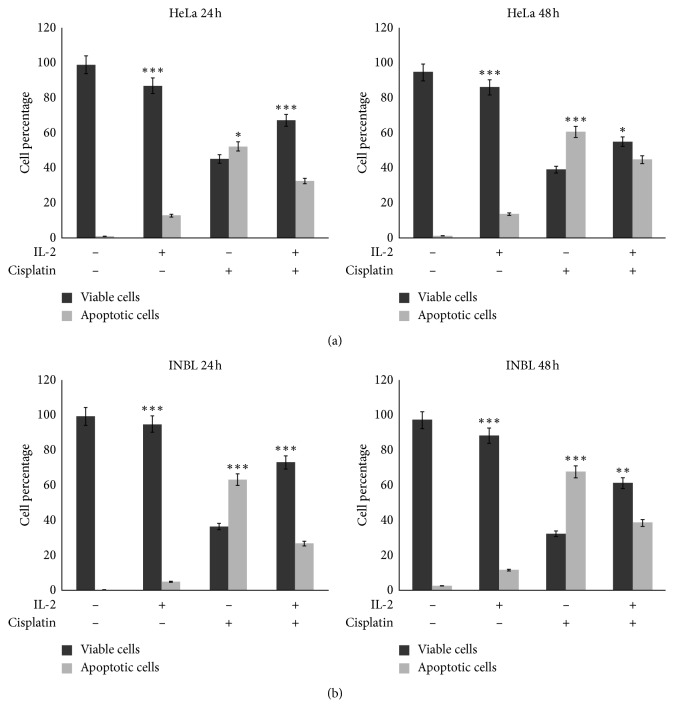
Interleukin 2 (IL-2) has been used for the treatment of different types of cancer that express the IL-2 receptor (IL-2R). However, the effect of IL-2 on cervical cancer cells is unknown. IL-2R is present in normal cells of the immune system but not in the healthy cervix. We report that IL-2R is expressed in cervical cancer cells. IL-2 decreases cervical cancer cell proliferation via transient arrest of the G1 phase, which does not result in apoptosis or senescence. IL-2 upregulates the expression of p53 and p21 and downregulates cyclin D. In addition, we report the resistance of cervical cancer cells to treatments that induce apoptosis in HeLa and INBL cells. When arrested cells were treated with cisplatin, the cytokine protected cells from apoptosis induced by cisplatin. The effects of IL-2 on the cell cycle do not induce cellular senescence or activate the proapoptotic protein Bax. The cell arrest induced by IL-2 is conferring protection to cells against apoptosis.
Copyright © 2019 María del Carmen Lagunas-Cruz et al.
Conflict of interest statement
The authors declare that they have no conflicts of interest.
Figures
Similar articles
-
N-methyl-N'-nitro-N-nitrosoguanidine-induced senescence-like growth arrest in colon cancer cells is associated with loss of adenomatous polyposis coli protein, microtubule organization, and telomeric DNA.Mol Cancer. 2004 Jan 16;3:3. doi: 10.1186/1476-4598-3-3. Mol Cancer. 2004. PMID: 14728717 Free PMC article.
-
Apoptosis or senescence-like growth arrest: influence of cell-cycle position, p53, p21 and bax in H2O2 response of normal human fibroblasts.Biochem J. 2000 Apr 15;347(Pt 2):543-51. doi: 10.1042/0264-6021:3470543. Biochem J. 2000. PMID: 10749685 Free PMC article.
-
A novel arylbenzofuran induces cervical cancer cell apoptosis and G1/S arrest through ERK-mediated Cdk2/cyclin-A signaling pathway.Oncotarget. 2016 Jul 5;7(27):41843-41856. doi: 10.18632/oncotarget.9731. Oncotarget. 2016. PMID: 27259234 Free PMC article.
-
Linalool Induces Cell Cycle Arrest and Apoptosis in Leukemia Cells and Cervical Cancer Cells through CDKIs.Int J Mol Sci. 2015 Nov 26;16(12):28169-79. doi: 10.3390/ijms161226089. Int J Mol Sci. 2015. PMID: 26703569 Free PMC article.
-
Direct inhibition of interleukin-2 receptor alpha-mediated signaling pathway induces G1 arrest and apoptosis in human head-and-neck cancer cells.J Cell Biochem. 2005 May 15;95(2):379-90. doi: 10.1002/jcb.20446. J Cell Biochem. 2005. PMID: 15779002
Cited by
-
Role of the JAK/STAT Pathway in Cervical Cancer: Its Relationship with HPV E6/E7 Oncoproteins.Cells. 2020 Oct 15;9(10):2297. doi: 10.3390/cells9102297. Cells. 2020. PMID: 33076315 Free PMC article. Review.
-
Perspectives in HPV Secondary Screening and Personalized Therapy Basing on Our Understanding of HPV-Related Carcinogenesis Pathways.Mediators Inflamm. 2020 Mar 25;2020:2607594. doi: 10.1155/2020/2607594. eCollection 2020. Mediators Inflamm. 2020. PMID: 32308553 Free PMC article. Review.
-
STAT5 Is Necessary for the Metabolic Switch Induced by IL-2 in Cervical Cancer Cell Line SiHa.Int J Mol Sci. 2024 Jun 21;25(13):6835. doi: 10.3390/ijms25136835. Int J Mol Sci. 2024. PMID: 38999946 Free PMC article.
-
Regulatory effects of comprehensive psychological intervention on adverse emotions and immune status of cervical cancer patients during the perioperative period.Am J Transl Res. 2021 Jun 15;13(6):6362-6371. eCollection 2021. Am J Transl Res. 2021. PMID: 34306375 Free PMC article.
-
Knockdown of AMIGO2 suppresses proliferation and migration through regulating PPAR-γ in bladder cancer.Hereditas. 2024 Jul 8;161(1):21. doi: 10.1186/s41065-024-00325-z. Hereditas. 2024. PMID: 38978149 Free PMC article.
References
LinkOut - more resources
Full Text Sources
Research Materials
Miscellaneous