. 2019 Oct 23:7:9.
doi: 10.1186/s40170-019-0201-3. eCollection 2019.

A yeast phenomic model for the influence of Warburg metabolism on genetic buffering of doxorubicin

Affiliations

A yeast phenomic model for the influence of Warburg metabolism on genetic buffering of doxorubicin

Sean M Santos et al. Cancer Metab. .

Abstract

Background: The influence of the Warburg phenomenon on chemotherapy response is unknown. Saccharomyces cerevisiae mimics the Warburg effect, repressing respiration in the presence of adequate glucose. Yeast phenomic experiments were conducted to assess potential influences of Warburg metabolism on gene-drug interaction underlying the cellular response to doxorubicin. Homologous genes from yeast phenomic and cancer pharmacogenomics data were analyzed to infer evolutionary conservation of gene-drug interaction and predict therapeutic relevance.

Methods: Cell proliferation phenotypes (CPPs) of the yeast gene knockout/knockdown library were measured by quantitative high-throughput cell array phenotyping (Q-HTCP), treating with escalating doxorubicin concentrations under conditions of respiratory or glycolytic metabolism. Doxorubicin-gene interaction was quantified by departure of CPPs observed for the doxorubicin-treated mutant strain from that expected based on an interaction model. Recursive expectation-maximization clustering (REMc) and Gene Ontology (GO)-based analyses of interactions identified functional biological modules that differentially buffer or promote doxorubicin cytotoxicity with respect to Warburg metabolism. Yeast phenomic and cancer pharmacogenomics data were integrated to predict differential gene expression causally influencing doxorubicin anti-tumor efficacy.

Results: Yeast compromised for genes functioning in chromatin organization, and several other cellular processes are more resistant to doxorubicin under glycolytic conditions. Thus, the Warburg transition appears to alleviate requirements for cellular functions that buffer doxorubicin cytotoxicity in a respiratory context. We analyzed human homologs of yeast genes exhibiting gene-doxorubicin interaction in cancer pharmacogenomics data to predict causality for differential gene expression associated with doxorubicin cytotoxicity in cancer cells. This analysis suggested conserved cellular responses to doxorubicin due to influences of homologous recombination, sphingolipid homeostasis, telomere tethering at nuclear periphery, actin cortical patch localization, and other gene functions.

Conclusions: Warburg status alters the genetic network required for yeast to buffer doxorubicin toxicity. Integration of yeast phenomic and cancer pharmacogenomics data suggests evolutionary conservation of gene-drug interaction networks and provides a new experimental approach to model their influence on chemotherapy response. Thus, yeast phenomic models could aid the development of precision oncology algorithms to predict efficacious cytotoxic drugs for cancer, based on genetic and metabolic profiles of individual tumors.

Keywords: Cell proliferation parameters (CPPs); Differential gene interaction networks; Doxorubicin; Genetic buffering; Human-like/HL yeast media; Pharmacogenomics; Quantitative high throughput cell array phenotyping (Q-HTCP); Recursive expectation-maximization clustering (REMc); Warburg metabolism; Yeast phenomics.


Conflict of interest statement

Competing interestsJLH has ownership in the Spectrum PhenomX, LLC, a shell company that was formed to commercialize Q-HTCP technology. The authors declare that they have no other competing interests.

Figures
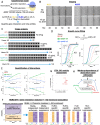
Fig. 1
Fig. 1
Experimental strategy to characterize differential doxorubicin-gene interaction, with respect to the Warburg metabolic transition. a The phenomic model incorporates treatment of individually grown cultures of the YKO/KD collection with increasing doxorubicin (0, 2.5, 5, 7.5, and 15 ug/mL) in “fermentable/glycolytic” (HLD) or “non-fermentable/respiratory” (HLEG) media. b Representative cell array images, treated and untreated with 15 ug/mL doxorubicin. c Time series of individual culture images, exemplifying gene deletion suppression (vps54-∆0) and gene deletion enhancement (mms1-∆0), relative to parental control (“RF1”) in HLEG media with indicated concentrations (0, 5, and 15 ug/mL) of doxorubicin. d After image analysis, data time series are fit to a logistic growth function, G(t), to obtain the cell proliferation parameters (CPPs), K (carrying capacity), L (time at which K/2 is reached), and r (maximum-specific rate) for each culture. “∆L” (left panel) indicates Ki (see the “Methods” section). e Interaction is quantified by linear regression of Li (indicated “Delta_L” and “Delta_K” in right panels; see the “Methods” section) across the entire dose range, which is converted to a z-score by dividing with the variance of the parental reference control (see the “Methods” section). f Gene interaction profiles were grouped by recursive expectation-maximization clustering (REMc) to reveal deletion-enhancing and deletion-suppressing doxorubicin-gene interaction modules and the influence of the Warburg effect. Resulting clusters were analyzed with GOTermFinder (GTF) to identify enriched biological functions. g Gene Ontology Term Averaging (GTA) was used as a complement to REMc/GTF. h The model for genetic buffering of doxorubicin cytotoxicity incorporates primary and interaction effects involving glycolysis (green), and respiration (red), to explain the influence of Warburg context (blue) on doxorubicin-gene interaction (black)
Fig. 2
Fig. 2
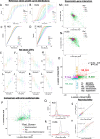
Q-HTCP provides cell proliferation parameters as phenotypes to quantify gene interaction. a, b Average pixel intensity and standard deviation for 768 reference strain cultures at indicated times after exposure to escalating doxorubicin concentrations in a HLD or b HLEG media. c, d Semi-log plots after fitting the data plotted above for c HLD or d HLEG to a logistic function (see Fig. 1d). el CPP distributions from data depicted in panels A-D for eh HLD and i, j HLEG, including L (e, i), K (f, j), r (g, k), and (h, l) AUC. m, n Comparison of doxorubicin-gene interaction scores using the L vs. K CPP in the context of either m HLD or n HLEG media. Score distributions of knockout (YKO, green), knockdown/DAmP (YKD, red), and non-mutant parental (Ref, purple) strain cultures are indicated along with thresholds for deletion enhancement and suppression (dashed lines at ± 2). o Differential doxorubicin-gene interaction (using L as the CPP) for HLD vs. HLEG, classified with respect to Warburg metabolism as non-specific (NS), respiratory-specific (R), or glycolysis-specific (G) deletion enhancement (Enh) or deletion suppression (Sup). pr Comparisons between genome-wide studies of doxorubicin-gene interaction: p Genes reported from Westmoreland et al. (green), Xia et al. (red), or both studies (purple) are plotted overlying L interaction scores (gray) in HLD vs. HLEG. q, r L interaction scores (gray) for genes reported by Westmoreland et al. (green), Xia et al. (red), or both studies (purple) in q HLD or r HLEG media. s, t Doxorubicin-gene interaction from whole-genome (WGS) and validation (V) studies on s HLD or t HLEG media
Fig. 3
Fig. 3
Characterization of Warburg-differential, doxorubicin-gene interaction profiles. a The union of enhancers (L z-score > 2) or suppressors (L z-score ≤ 2) from the HLD and HLEG analyses totaled 2802 gene interaction profiles that were subjected to REMc (see the “Methods” section). b, c The column order is the same for all heatmaps; “+” indicates doxorubicin-gene interaction and “−“ indicates “shift” (K0; see the “Methods” section). Interactions by K are negative (brown) if enhancing and positive (purple) if suppressing, while the signs of interaction are reversed for L (see the “Methods” section). The heatmap color scale is incremented by twos; red indicates no growth curve in the absence of doxorubicin. b First round cluster 1-0-7 has a gene interaction profile indicative of HLEG-specific deletion enhancement. c Second round clusters (2-0.7-X) are ordered left to right by strength of influence. d The pattern of distributions for the different doxorubicin-gene interaction scores (“+” columns only from panel c) summarizes respective clusters from panel c. Deletion enhancement is considered to be qualitatively stronger if observed for K in addition to L
Fig. 4
Fig. 4
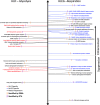
GO annotations associated with deletion enhancement or suppression of doxorubicin cytotoxicity, with respect to Warburg-dependence. Representative GO terms are listed, which were identified by REMc/GTF (orange), GTA (purple), or both methods, for HLD (left, red), HLEG (right, blue), or both media types (black), and for enhancement (above dashed line) or suppression (below dashed line) of doxorubicin cytotoxicity. Distance above or below the horizontal dashed line indicates the GTA value for terms identified by REMc or the GTA score if identified by GTA (see the “Methods” section). See Additional files 5 and 6, respectively, for all REMc and GTA results
Fig. 5
Fig. 5
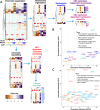
Respiration increases the role for chromatin organization in buffering doxorubicin toxicity. a GO term-specific heatmaps for chromatin organization and its child terms (indicated by arrows) clarify related but distinct biological functions that buffer doxorubicin, with respect to Warburg status. b, c L-based doxorubicin-gene interaction scores associated with GO terms that were enriched in cluster 2-0.7-2. Dashed lines indicate z-score thresholds for enhancers (> 2) and suppressors (≤ 2). Sub-threshold gene interaction values are plotted, but not labeled
Fig. 6
Fig. 6
Distinct histone modifications differentially influence doxorubicin cytotoxicity. a Rpd3L and Rpd3S complexes exert strong HLEG-specific doxorubicin-enhancing influence relative to other Sin3-type histone deacetylases and the HDA1 complex. b In contrast to histone deacetylation (panel a), histone acetylation exhibits deletion enhancement that is Warburg-independent. c Histone H3K4 methylation by the Set1C/COMPASS complex, which requires histone mono-ubiquitination of H2B by the Bre1/Rad6 complex, is opposed by Jhd2, a histone H3K4 demethylase. The respiration-specific deletion-enhancing interactions suggest the Warburg transition can protect tumors promoted by certain types of chromatin deregulation from doxorubicin
Fig. 7
Fig. 7
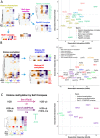
Additional respiration-specific deletion-enhancing and deletion-suppressing functions that influence doxorubicin cytotoxicity. Heatmaps depicting complete phenotypic profiles are the inset, corresponding to the plots of L-based doxorubicin-gene interaction. a Protein folding in endoplasmic reticulum and the N-terminal protein-acetylating NatC complex are largely respiratory-dependent in their deletion-enhancing influence. b DNA topological change exerts deletion-enhancing interactions in both respiratory and glycolytic contexts. c GTA-identified terms tend to be smaller in number and display greater variability in the Warburg dependence among genes sharing the same functional annotation. d Functions implicated in respiratory-dependent deletion suppression of doxorubicin toxicity
Fig. 8
Fig. 8
Glycolysis-specific enhancement and suppression of doxorubicin cytotoxicity. Doxorubicin-gene interaction profiles for HLD-specific GO terms identified by GTA are depicted for a deletion enhancement and b deletion suppression
Fig. 9
Fig. 9
Warburg-independent deletion enhancement of doxorubicin cytotoxicity. Gene interaction profiles showing deletion enhancement in both respiratory and glycolytic context included: a double-strand break repair via homologous recombination, and its child terms (indicated by arrows), and b the Cul8-RING ubiquitin ligase, Ino80 complex, Lst4-7 complex, and MCM complex
Fig. 10
Fig. 10
Warburg-independent deletion suppression of doxorubicin cytotoxicity. Doxorubicin-gene interaction profiles and L-interaction plots for genes associated with deletion suppression in HLEG or HLD media, including a cellular sphingolipid homeostasis, along with its parent term, lipid homeostasis, and related term sphingolipid metabolism and b actin cortical patch localization and telomere tethering at nuclear periphery
Fig. 11
Fig. 11
Use of the yeast phenomic model to predict doxorubicin-gene interaction in cancer cells. a BiomaRt was used to assign yeast-human gene homology for the GDSC and gCSI datasets. b PharmacoGx was used to retrieve differential gene expression for doxorubicin sensitive cell lines from the gCSI and GDSC databases, searching data from individual tissues or across data aggregated from all tissues. Human genes that are underexpressed in doxorubicin sensitive cell lines (UES) with yeast homologs that are deletion enhancers are predicted to be causal in their phenotypic association. Similarly, human genes that are overexpressed in doxorubicin sensitive cancer cell lines (OES) would be predicted to be causal if the yeast homolog was a deletion suppressor in the phenomic dataset. c, d Boxes inside of Venn diagrams indicate the genes for which gene interaction profiles are shown in the heatmaps below. Gene names are to the right of heatmaps, with blue labels indicating genes identified in both the GDSC and gCSI databases and black labels indicating genes found only in the gCSI dataset. The category of homology (see panel a) is indicated in the left column of each heatmap. c Deletion enhancement by yeast genes predicts human functions that buffer doxorubicin cytotoxicity, and thus, reduced expression of homologs in cancer cell lines is predicted to increase doxorubicin sensitivity. d Deletion suppression by yeast genes predicts functions that mediate cytotoxicity and is shown for human homologs having significant association of overexpression in cancer cell lines with increased doxorubicin sensitivity. e, f Genes representing enhancing or suppressing modules from REMc or GTA that are e UES or f OES in at least one of the two databases. Red labels indicate genes found only in the GDSC database. Additional file 11 reports all results from the analysis described above, including assessment of individual tissues
Fig. 12
Fig. 12
Yeast phenomic model for the influence of Warburg metabolism on doxorubicin-gene interaction. Shaded areas indicate influences that are relatively Warburg-dependent, being red or green if their effects are relatively specific to a respiratory or glycolytic context, respectively. Processes that influence doxorubicin cytotoxicity in a more Warburg-independent manner are unshaded. Arrowheads indicate processes for which genes predominantly transduce doxorubicin toxicity, based on their loss of function suppressing its growth inhibitory effects. Conversely, a perpendicular bar at the line head indicates a process that buffers doxorubicin toxicity, as genetic compromise of its function enhances the growth inhibitory effects of doxorubicin

Similar articles

Cited by

References

    1. Liberti MV, Locasale JW. The Warburg effect: how does it benefit cancer cells? Trends Biochem Sci. 2016;41:211–218. doi: 10.1016/j.tibs.2015.12.001. - DOI - PMC - PubMed
    1. Schwartz L, Supuran CT, Alfarouk KO. The Warburg effect and the hallmarks of cancer. Anticancer Agents Med Chem. 2017;17:164–170. doi: 10.2174/1871520616666161031143301. - DOI - PubMed
    1. Xu XD, Shao SX, Jiang HP, Cao YW, Wang YH, Yang XC, Wang YL, Wang XS, Niu HT. Warburg effect or reverse Warburg effect? A review of cancer metabolism. Oncol Res Treat. 2015;38:117–122. doi: 10.1159/000375435. - DOI - PubMed
    1. Diaz-Ruiz R, Rigoulet M, Devin A. The Warburg and Crabtree effects: on the origin of cancer cell energy metabolism and of yeast glucose repression. Biochim Biophys Acta. 1807;2011:568–576. - PubMed
    1. Diaz-Ruiz R, Uribe-Carvajal S, Devin A, Rigoulet M. Tumor cell energy metabolism and its common features with yeast metabolism. Biochim Biophys Acta. 2009;1796:252–265. - PubMed

LinkOut - more resources