. 2020 May;27(5):1569-1587.
doi: 10.1038/s41418-019-0441-3. Epub 2019 Oct 23.

Membrane-bound TNF mediates microtubule-targeting chemotherapeutics-induced cancer cytolysis via juxtacrine inter-cancer-cell death signaling

Affiliations

Membrane-bound TNF mediates microtubule-targeting chemotherapeutics-induced cancer cytolysis via juxtacrine inter-cancer-cell death signaling

Jing Zhang et al. Cell Death Differ. 2020 May.

Abstract

Microtubule-targeting agents (MTAs) are a class of most widely used chemotherapeutics and their mechanism of action has long been assumed to be mitotic arrest of rapidly dividing tumor cells. In contrast to such notion, here we show-in many cancer cell types-MTAs function by triggering membrane TNF (memTNF)-mediated cancer-cell-to-cancer-cell killing, which differs greatly from other non-MTA cell-cycle-arresting agents. The killing is through programmed cell death (PCD), either in way of necroptosis when RIP3 kinase is expressed, or of apoptosis in its absence. Mechanistically, MTAs induce memTNF transcription via the JNK-cJun signaling pathway. With respect to chemotherapy regimens, our results establish that memTNF-mediated killing is significantly augmented by IAP antagonists (Smac mimetics) in a broad spectrum of cancer types, and with their effects most prominently manifested in patient-derived xenograft (PDX) models in which cell-cell contacts are highly reminiscent of human tumors. Therefore, our finding indicates that memTNF can serve as a marker for patient responsiveness, and Smac mimetics will be effective adjuvants for MTA chemotherapeutics. The present study reframes our fundamental biochemical understanding of how MTAs take advantage of the natural tight contact of tumor cells and utilize memTNF-mediated death signaling to induce the entire tumor regression.


Conflict of interest statement

Shanghai Institute of Biochemistry and Cell Biology is in the process of applying for a patent application covering the use of paclitaxel and IAP inhibitors to treat breast cancers that lists JZ and LS as inventors (CN 201811388749.2).

Figures
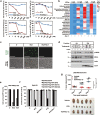
Fig. 1
Fig. 1
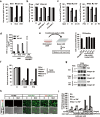
MTAs induce MLKL phosphorylation-dependent necroptosis in L929 fibrosarcoma, both in vitro and in vivo. a Dose-dependent necroptotic cytolysis effect of MTAs on L929 cells. b A panel of 21 MTAs was tested for necroptotic effect on L929 cells. Heat map analysis of cell death index was calculated based on ATP levels. c Fluorescent microscopy of SYTOX Green-labeled necroptotic L929 cells after NCZ treatment for 24 h. Plasma membrane breakdown was traced by SYTOX Green staining. Scale bar, 400 µm. d Immunoblotting analysis of MLKL phosphorylation by Triton X-114 fractionation in whole cell lysates of NCZ-treated or PTX-treated L929 cells. T, 20 ng/ml recombinant/soluble TNF treatment. Aq, aqueous fraction; Det, detergent fraction. e Effect of Rip3 knockout on MTA-induced necroptosis in L929 cells. f Effect of RIP3 kinase activity on MTA-induced necroptosis in L929 cells. Wild-type or mutants of RIP3 were stably expressed in Rip3 KO L929 cells by pHAGE infection. WT, wild-type RIP3; K51A, kinase dead form of RIP3; S232A, auto-phosphorylation site mutant of RIP3. RIP3 re-expression was detected by immunoblotting. g In vivo response of mouse allograft of L929 cells to VCR. Athymic nude mice bearing ~300 mm3 L929-fibrosarcoma were treated with vehicle or with 5 mg/kg Nec-1s and/or 5 mg/kg VCR. Upper: tumor growth was measured and calculated. Lower: representative image of L929 cells allografts on day 6. Vehicle, n = 5; VCR, n = 7; VCR + Nec-1s, n = 5. Scale bar, 1 cm. Graph shows mean ± SEM, p values were determined by the two-way ANOVA test; NS not significant; *p < 0.05; **p < 0.01; ***p < 0.001. D, DMSO; NCZ, nocodazole; VCR, vincristine; PTX, paclitaxel; DTX, docetaxel. Cell viability was determined by measuring ATP levels. The data are represented as mean ± SEM of duplicate wells (a, b, e, and f). Results are reported from one representative experiment. Experiments were repeated independently for four (a, c), three (dg), or two (b) times
Fig. 2
Fig. 2
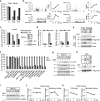
MTAs activate membrane TNF signaling to induce bystander cell death. a, b Effect of Tnfr1 (a) and Tnf (b) knockout on MTA-induced necroptosis in L929 cells. c Pretreatment (2 h) of neutralizing antibody against TNF rescued cells from MTA-induced necroptosis. d MTA-treated L929 cells were tested for the presence of soluble TNF (solTNF) in the cell culture media. Samples were harvested for ELISA analysis to determine the concentration of solTNF, as described in the “Methods” section. LPS-primed Raw264.7 cell medium was used as a positive control for measuring the autocrined soluble TNF. e MTA-treated L929 conditioned medium (CM) was applied to naïve cells. Left panel, a schematic representation of the experimental design. Right panel, conditioned medium-fed L929 cell viability was determined by ATP levels at 12 h post treatment. f Influence of TACE inhibitors on MTA-induced cell death in L929 cells. TACE inhibitors were pretreated for 2 h followed by MTAs treatment. g Immunoblotting analysis of membrane-bound TNF in crude membrane fraction of NCZ-treated WT, Tnfr1 KO, and Tnf KO L929 cells. Integrin β1 was used as the loading control of plasma membrane fraction. h, i MTA-induced bystander cell death analysis in L929 Tnf KO and Tnfr1 KO co-culture system, as described in the “Methods” section. Representative images show NCZ-induced necroptotic cells by PI staining (h). Scale bar, 100 µm. The number of necroptotic cells per well was quantified by IncuCyte (i). D, DMSO; NCZ, nocodazole; VCR, vincristine; PTX, paclitaxel. Cell viability was determined by measuring ATP levels. The data are represented as mean ± SEM of duplicate wells (af and i). Results are reported from one representative experiment. Experiments were repeated independently for four (a, b, and g) or three (cf, h, and i) times
Fig. 3
Fig. 3
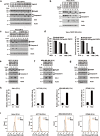
MTAs upregulate membrane TNF transcription through the JNK/c-Jun axis. a Effect of transcriptional inhibitor actinomycin D (ActD) on MTA-induced cell death in L929 cells. b RNA-sequencing analysis of Tnf and Jun gene expression patterns during MTA treatment. UCSC genome browser images depict calculated FPKM (fragments per kilobase of transcript per million mapped reads) values in RNA-sequencing data. Gene expression levels are provided in DATA SET  1. c Effect of Jun knockout on MTA-induced necroptosis in L929 cells. For complementation, wild-type c-Jun was expressed in the knockout cells and its expression was detected by immunoblotting. d qRT-PCR analysis of Tnf mRNA level in MTA-treated WT and Jun KO L929 cells. e Immunoblotting analysis of TNF in P100 fractions of NCZ-treated WT and Jun KO L929 cells. f A panel of MAPK and NF-κB inhibitors was tested for necroptosis inhibition effect on MTA-treated L929 cells. All inhibitors were pretreated for 2 h followed by NCZ challenge. i, inhibitor. g Immunoblotting analysis of the JNK/c-Jun activation in whole cell lysates of NCZ-treated L929 cells. h Immunoblotting analysis of TNF accumulation in membrane fraction (P100) in the presence of JNK inhibitor (JNKi, SP600125) for NCZ-treated L929 cells. i Immunoblotting analysis of TACE expression in whole cell lysates of NCZ-treated L929 cells. j, k Fluorimetric assay of measuring TACE activity in both cell lysate (left panel) and membrane fraction (right panel) of NCZ (j) or PTX (k) treated L929 cells. D, DMSO; NCZ, nocodazole; PTX, paclitaxel. Cell viability was determined by measuring ATP levels. The data are represented as mean ± SEM of duplicate wells (a, c, and f). Results are reported from one representative experiment. Experiments were repeated independently for four (f), three (a, c, d, and g), or two (e and hk) times
Fig. 4
Fig. 4
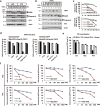
MTAs induce memTNF-mediated apoptosis in RIP3-deficient human carcinoma cell lines. a Immunoblotting analysis of apoptosis markers using whole cell lysates from recombinant TNF (soluble TNF, solTNF)-treated HeLa cells in the presence or absence of pan-caspase inhibitor z-VAD (Z). Cells were treated as indicated for 24 h. b Immunoblotting analysis of apoptosis markers using whole cell lysates from 1 µM MTA-treated HeLa cells in the presence or absence of 20 µM TACE inhibitor TAPI-1 (TACEi) or 20 µM pan-caspase inhibitor z-VAD (Z) for 36 h. c Immunoblotting analysis of apoptosis markers using whole cell lysates from 1 µM MTA-treated WT and TNFR1 KO HeLa cells for 36 h. d Effect of TNFR1 knockout on MTA-induced cell death in HeLa cells. Cells were treated as indicated for 48 h. eg Immunoblotting analysis of apoptosis markers using whole cell lysates of 1 µM MTA-treated HCT116 (colon cancer, e), MDA-MB-468 (breast cancer, f), and BT549 (breast cancer, g) cells for 36 h. h, i qRT-PCR analysis of JUN mRNA level (h) and in flow cytometric analysis of memTNF (i) in MTA-treated HeLa, HCT116, MDA-MB-468, and BT549 cells for 12 and 20 h respectively. D, DMSO; NCZ, nocodazole; PTX, paclitaxel; Z, z-VAD. Cell viability was determined by measuring ATP levels. The data are represented as mean ± SEM of duplicate wells (d). Results are reported from one representative experiment. Experiments were repeated independently three (c, d, and h) or two (a, b, eg, and i) times
Fig. 5
Fig. 5
Smac mimetics reduce adverse toxicity of MTAs by potentiating memTNF-mediated apoptosis. a Immunoblotting analysis of apoptosis markers using whole cell lysates from MTA-treated HeLa cells. Cells were treated with 1 µM NCZ or PTX for indicated time. b Immunoblotting analysis of apoptosis markers using whole cell lysates from MTAs and LCL161 co-treated HeLa cells. Cells were treated with 100 nM MTAs or 20 ng/ml recombinant/soluble TNF (T) in the presence or absence of 100 nM LCL161 as indicated for 20 h. c Time course effect of LCL161 on MTA-induced cell death in HeLa cells. d Effect of TNFR1 knockout on MTAs and LCL161 co-treatment induced apoptosis in HeLa cells. Cells were treated as indicated for 28 h. e Effect of TNF neutralization on MTAs and LCL161 co-treatment induced cell death in HeLa cells. E, Enbrel. f Dose-dependent effect of NCZ (upper) or PTX (lower) treatment on HeLa cells in the presence or absence of 100 nM LCL161 (left), 100 nM GDC-0917 (middle), or 100 nM GDC-0152 (right). D, DMSO; NCZ, nocodazole; PTX, paclitaxel; LCL, LCL161; Z, z-VAD. Cell viability was determined by measuring ATP levels. The data are represented as mean ± SEM of duplicate wells (a, ce). Results are reported from one representative experiment. Experiments were repeated independently three (be, and LCL161 in f) or two (a, GDC-0917 and GDC-0152 in f) times
Fig. 6
Fig. 6
MTAs synergize with Smac mimetics to induce massive apoptosis in various human carcinoma cell lines. a A panel of human carcinoma cell lines was tested for MTAs and LCL161 co-treatment induced apoptosis. Heat map analysis of cell death index was calculated based on ATP levels. b Dose-dependent effect of NCZ (upper) or PTX (lower) treatment on HCT116 (colon cancer), MDA-MB-468 (breast cancer), and BT549 (breast cancer) cells. c Dose-dependent effect of DTX (docetaxel), VB (vinblastine), VN (vinorelbine), or VF (vinflunine) treatment on MDA-MB-468 cells in the presence or absence of 100 nM LCL161. D, DMSO; NCZ, nocodazole; PTX, paclitaxel; LCL, LCL161. Cell viability was determined by measuring ATP levels. The data are represented as mean ± SEM of duplicate wells. Results are reported from one representative experiment. Experiments were repeated independently twice (ac)
Fig. 7
Fig. 7
MemTNF-signaling-mediated apoptosis serves as the mechanism of action (MOA) for MTA/S-induced complete regression of human breast cancer. a Schematic experimental design for combinatory use of PTX and LCL161 (LCL) in breast cancer PDX, as described in the “Methods” section. b Clinical information of breast cancer patients used for PDX study. c Effect of PTX and LCL161 combinatory treatment on TNBC PDX. Athymic nude mice bearing 200–300 mm3 TNBC PDX were treated with vehicle or with 20 mg/kg PTX and/or 25 mg/kg LCL161. Upper left panel depicts tumor growth, upper right shows representative image of tumor-bearing mice, lower left documented final tumor weight, and lower right represents the image of the final tumors. Vehicle, PTX, and LCL, n = 5; PTX/LCL, n = 6. Scale bars, 2 cm. d Effect of in vivo TNF neutralization on PTX/LCL co-treatment of TNBC PDX. PDX was developed and treated as described in c. Enbrel (20 mg/kg) was treated every 3 days. n = 8 for each group. Scale bars, 2 cm. e 10 days after treatment as in c, tumors were isolated for histology (H&E staining) and apoptosis (cleaved caspase-3 IHC) analysis. n = 5 for each group. Scale bar, 200 µm. f Quantification of apoptotic cells in tumors (right panel), assessed by flow cytometry (left panel). Numbers in quadrants (top left areas; Annexin V+ 7-AAD) indicate apoptotic cell percentage in each group. n = 4 for each group. g Membrane-bound TNF was assayed by flow cytometry after 3-day or 7-day drug treatment. n = 5–6 for each group. h In vivo toxicity test for PTX/LCL161 combinatory treatment on wild-type C57BL/6 mice. Mice were treated with vehicle or with 20 mg/kg PTX and 25 mg/kg LCL161. Body weight, body temperature, AST, and ALT were all measured at the end of the study. n = 6 for each group. PTX, paclitaxel; LCL, LCL161. All graphs show mean ± SEM. p values for c, d, f, and g were determined by the one-way ANOVA test, followed by Tukey’s multiple comparison post-test; p values for body weight and ALT in h were determined by Mann–Whitney U-test; p values for body temperature and AST in h were determined by two-tailed unpaired Student’s t-test with Welch’s correction. NS not significant; *p < 0.05; **p < 0.01; ***p < 0.001. Results are reported from one representative experiment. Experiments were repeated independently for three (c) or two (dh) times

Similar articles

Cited by

References

    1. Jordan MA, Wilson L. Microtubules as a target for anticancer drugs. Nat Rev Cancer. 2004;4:253–65. - PubMed
    1. Castedo M, Perfettini JL, Roumier T, Andreau K, Medema R, Kroemer G. Cell death by mitotic catastrophe: a molecular definition. Oncogene. 2004;23:2825–37. - PubMed
    1. Rieder CL, Maiato H. Stuck in division or passing through: what happens when cells cannot satisfy the spindle assembly checkpoint. Dev Cell. 2004;7:637–51. - PubMed
    1. Weaver BA, Cleveland DW. Decoding the links between mitosis, cancer, and chemotherapy: the mitotic checkpoint, adaptation, and cell death. Cancer Cell. 2005;8:7–12. - PubMed
    1. Mitchison TJ. The proliferation rate paradox in antimitotic chemotherapy. Mol Biol Cell. 2012;23:1–6. - PMC - PubMed

Publication types

MeSH terms

Substances