

In Vitro and In Vivo Metabolomic Profiling after Infection with Virulent Newcastle Disease Virus
- PMID: 31635316
- PMCID: PMC6832399
- DOI: 10.3390/v11100962
In Vitro and In Vivo Metabolomic Profiling after Infection with Virulent Newcastle Disease Virus
Abstract
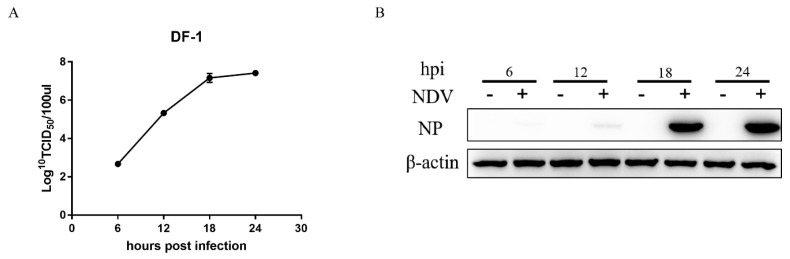
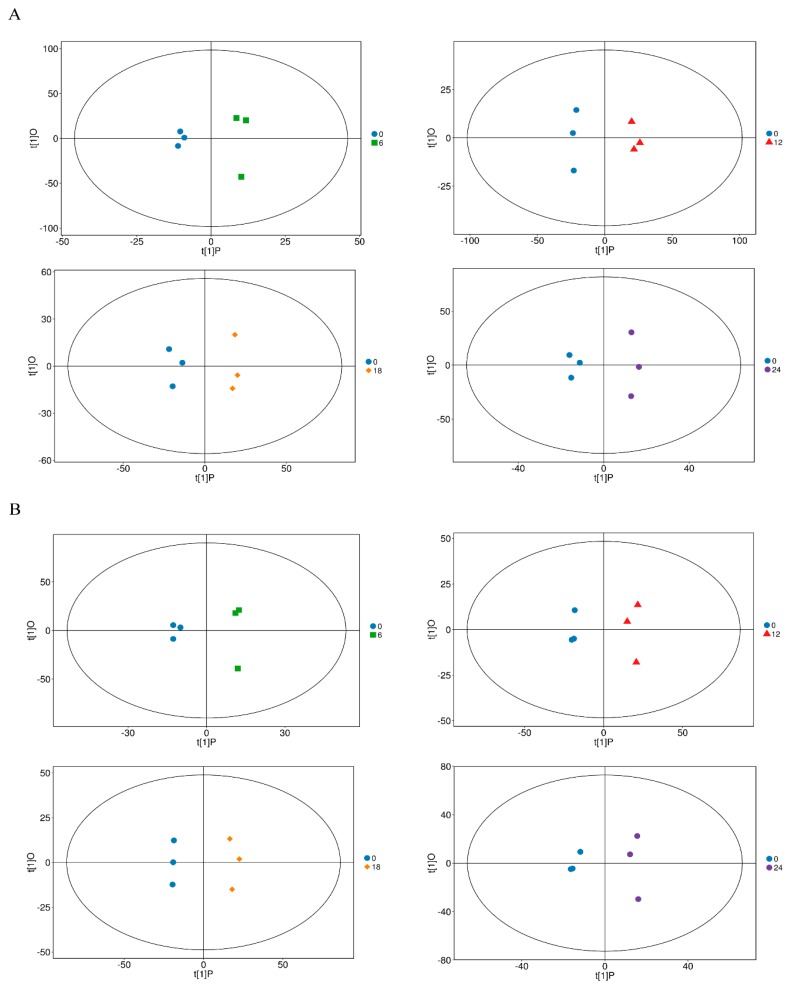
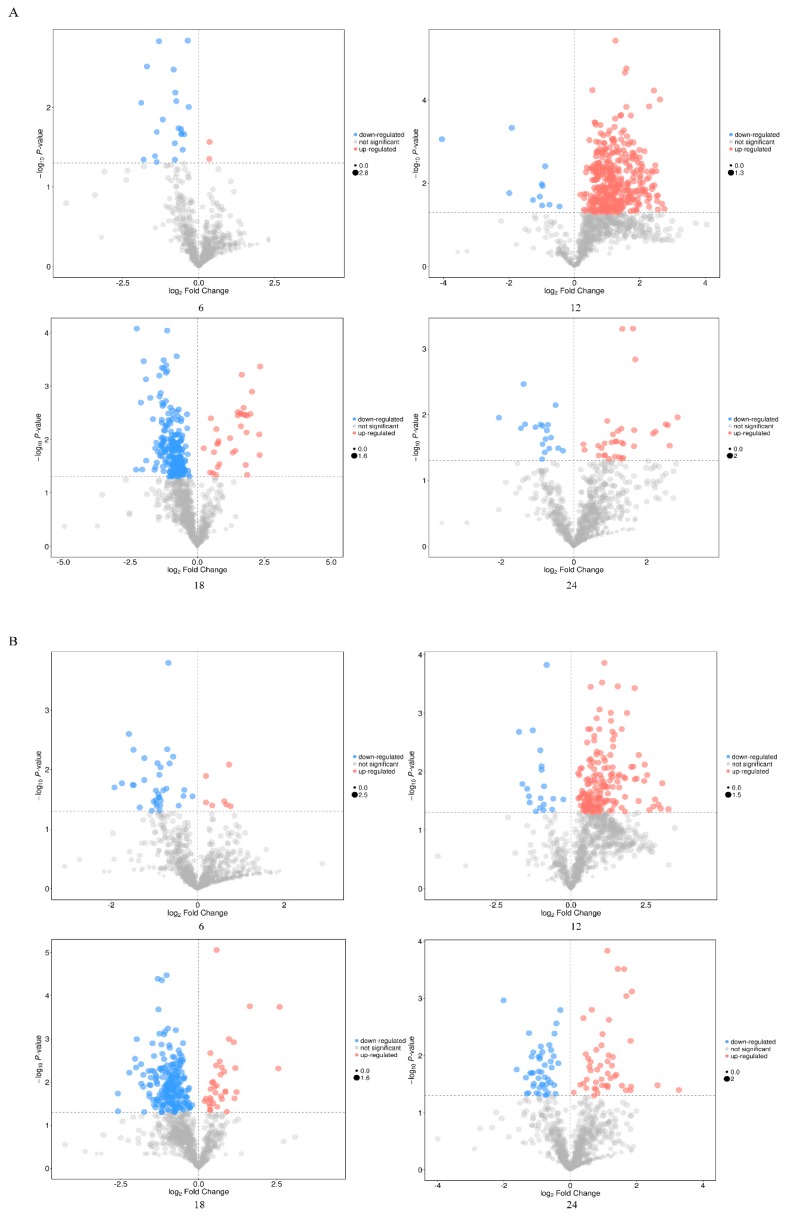
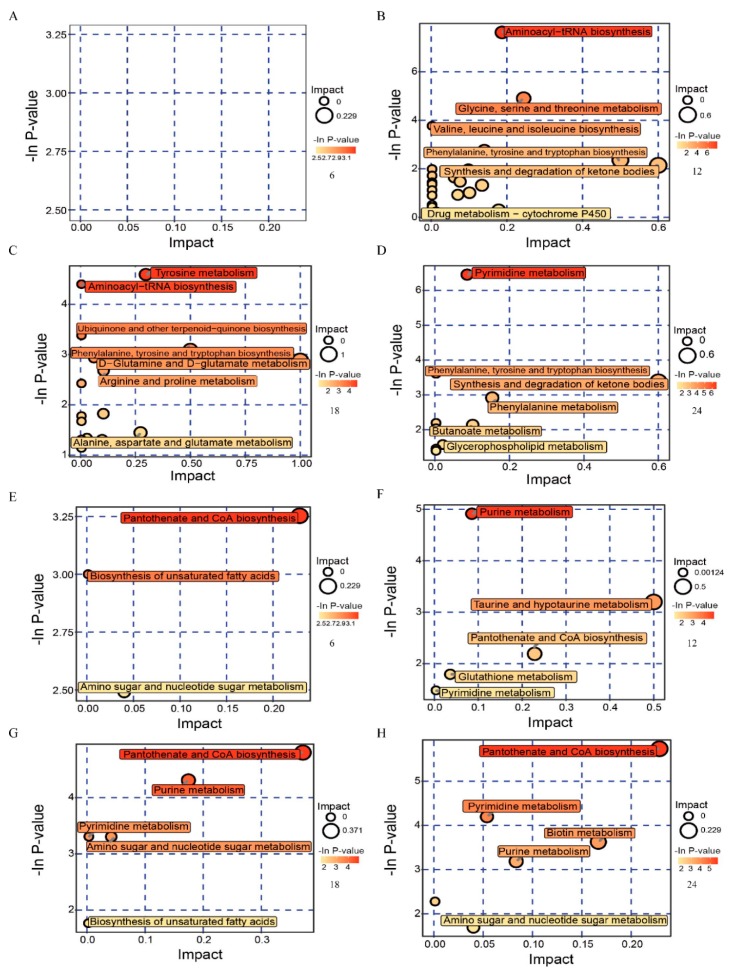
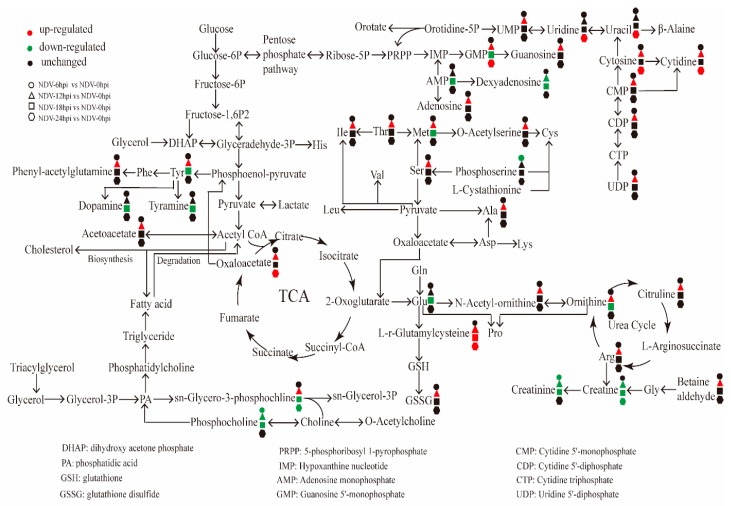
Newcastle disease (ND) is an acute, febrile, highly contagious disease caused by the virulent Newcastle disease virus (vNDV). The disease causes serious economic losses to the poultry industry. However, the metabolic changes caused by vNDV infection remain unclear. The objective of this study was to determine the metabolomic profiling after infection with vNDV. DF-1 cells infected with the vNDV strain Herts/33 and the lungs from Herts/33-infected specific pathogen-free (SPF) chickens were analyzed via ultra-high-performance liquid chromatography/quadrupole time-of-flight tandem mass spectrometry (UHPLC-QTOF-MS) in combination with multivariate statistical analysis. A total of 305 metabolites were found to have changed significantly after Herts/33 infection, and most of them belong to the amino acid and nucleotide metabolic pathway. It is suggested that the increased pools of amino acids and nucleotides may benefit viral protein synthesis and genome amplification to promote NDV infection. Similar results were also confirmed in vivo. Identification of these metabolites will provide information to further understand the mechanism of vNDV replication and pathogenesis.
Keywords: UHPLC-QTOF-MS; in vitro and in vivo; metabolomic analysis; virulent Newcastle disease virus.
Conflict of interest statement
The authors declare no conflict of interest.
Figures
Similar articles
-
Tropism of Newcastle disease virus strains for chicken neurons, astrocytes, oligodendrocytes, and microglia.BMC Vet Res. 2019 Sep 4;15(1):317. doi: 10.1186/s12917-019-2053-z. BMC Vet Res. 2019. PMID: 31484573 Free PMC article.
-
Re-emergence of a genotype VIII virulent Newcastle disease virus isolated from Chinese game fowl after 13 years.Transbound Emerg Dis. 2019 Mar;66(2):1077-1084. doi: 10.1111/tbed.13129. Epub 2019 Feb 5. Transbound Emerg Dis. 2019. PMID: 30658009
-
Single-Cell Transcriptome Atlas of Newcastle Disease Virus in Chickens Both In Vitro and In Vivo.Microbiol Spectr. 2023 Jun 15;11(3):e0512122. doi: 10.1128/spectrum.05121-22. Epub 2023 May 16. Microbiol Spectr. 2023. PMID: 37191506 Free PMC article.
-
An Australian Newcastle Disease Virus With a Virulent Fusion Protein Cleavage Site Produces Minimal Pathogenicity in Chickens.Vet Pathol. 2017 Jul;54(4):649-660. doi: 10.1177/0300985817705173. Epub 2017 May 11. Vet Pathol. 2017. PMID: 28494702
-
Immune responses of poultry to Newcastle disease virus.Dev Comp Immunol. 2013 Nov;41(3):447-53. doi: 10.1016/j.dci.2013.04.012. Epub 2013 Apr 25. Dev Comp Immunol. 2013. PMID: 23623955 Review.
Cited by
-
Intense Innate Immune Responses and Severe Metabolic Disorders in Chicken Embryonic Visceral Tissues Caused by Infection with Highly Virulent Newcastle Disease Virus Compared to the Avirulent Virus: A Bioinformatics Analysis.Viruses. 2022 Apr 27;14(5):911. doi: 10.3390/v14050911. Viruses. 2022. PMID: 35632651 Free PMC article.
-
Transcriptome Analysis of Genes Responding to Infection of Leghorn Male Hepatocellular Cells With Fowl Adenovirus Serotype 4.Front Vet Sci. 2022 Jun 14;9:871038. doi: 10.3389/fvets.2022.871038. eCollection 2022. Front Vet Sci. 2022. PMID: 35774982 Free PMC article.
-
A Review of Emerging Goose Astrovirus Causing Gout.Biomed Res Int. 2022 Aug 28;2022:1635373. doi: 10.1155/2022/1635373. eCollection 2022. Biomed Res Int. 2022. PMID: 36072471 Free PMC article. Review.
-
Metabolomic profiling of Marek's disease virus infection in host cell based on untargeted LC-MS.Front Microbiol. 2023 Nov 9;14:1270762. doi: 10.3389/fmicb.2023.1270762. eCollection 2023. Front Microbiol. 2023. PMID: 38029131 Free PMC article.
-
Picornavirus infection enhances aspartate by the SLC38A8 transporter to promote viral replication.PLoS Pathog. 2023 Feb 3;19(2):e1011126. doi: 10.1371/journal.ppat.1011126. eCollection 2023 Feb. PLoS Pathog. 2023. PMID: 36735752 Free PMC article.
References
-
- Armitage E.G., Ciborowski M. Applications of metabolomics in cancer studies. Adv. Exp. Med. Biol. 2017;965:209–234. - PubMed
Publication types
MeSH terms
LinkOut - more resources
Full Text Sources
Miscellaneous
