. 2020 Feb;117(2):466-485.
doi: 10.1002/bit.27200. Epub 2019 Nov 12.

Characterization and mutagenesis of Chinese hamster ovary cells endogenous retroviruses to inactivate viral particle release

Affiliations

Characterization and mutagenesis of Chinese hamster ovary cells endogenous retroviruses to inactivate viral particle release

Pierre-Olivier Duroy et al. Biotechnol Bioeng. 2020 Feb.

Abstract

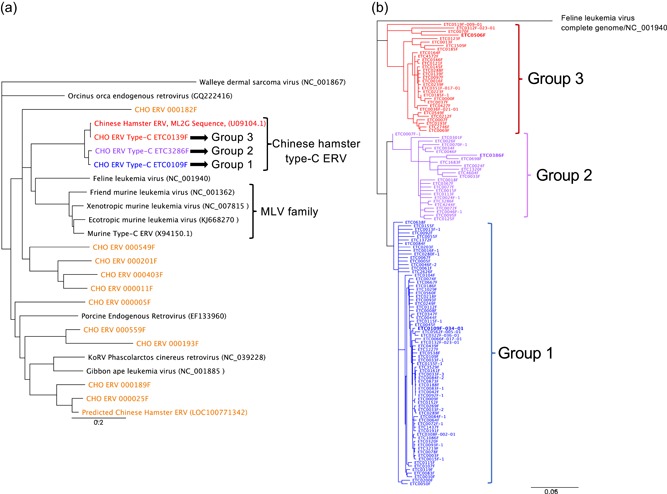
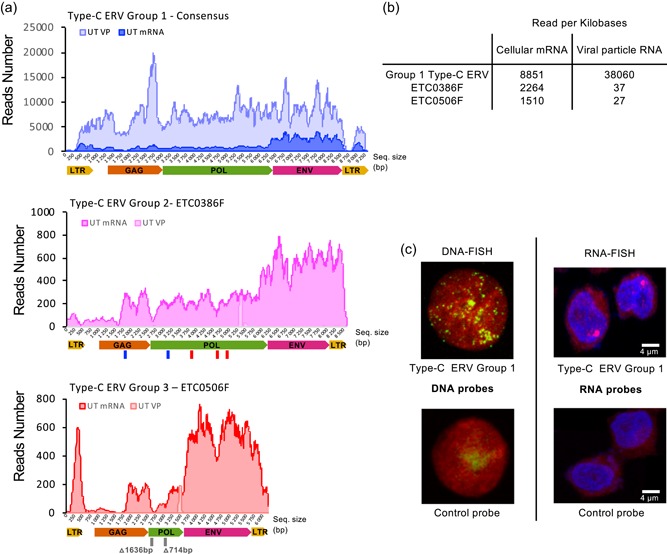
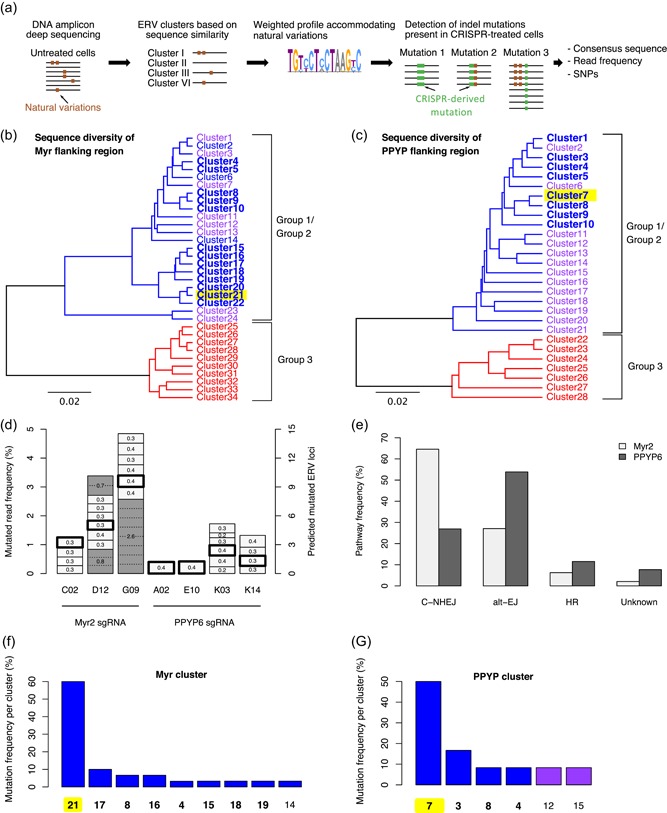
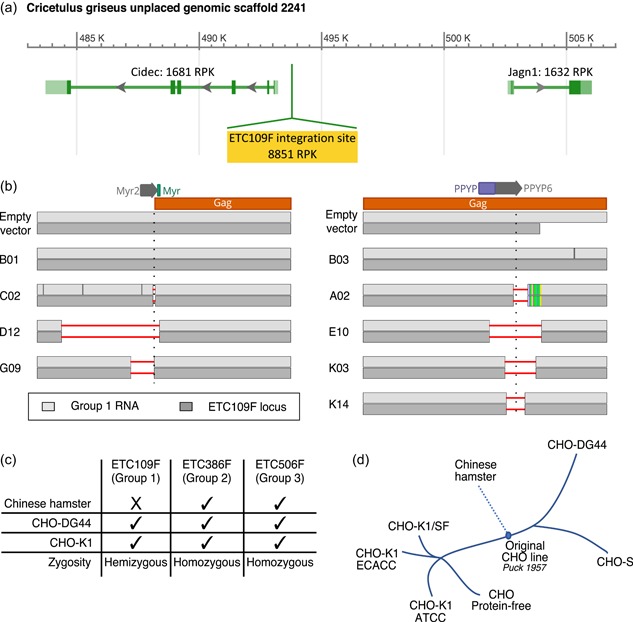
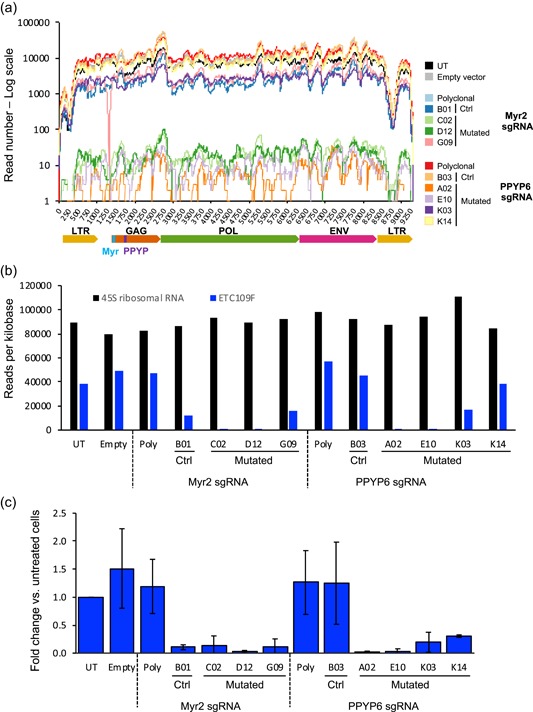
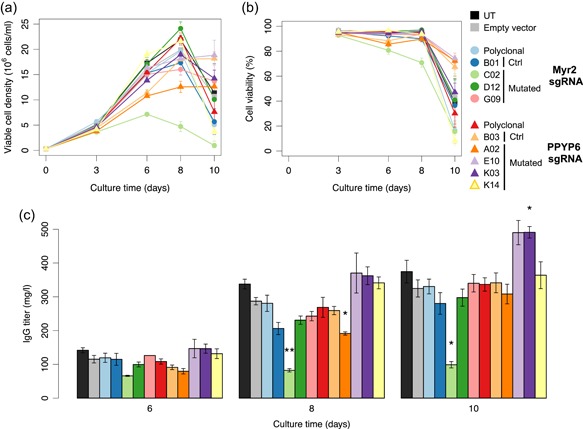
The Chinese hamster ovary (CHO) cells used to produce biopharmaceutical proteins are known to contain type-C endogenous retrovirus (ERV) sequences in their genome and to release retroviral-like particles. Although evidence for their infectivity is missing, this has raised safety concerns. As the genomic origin of these particles remained unclear, we characterized type-C ERV elements at the genome, transcriptome, and viral particle RNA levels. We identified 173 type-C ERV sequences clustering into three functionally conserved groups. Transcripts from one type-C ERV group were full-length, with intact open reading frames, and cognate viral genome RNA was loaded into retroviral-like particles, suggesting that this ERV group may produce functional viruses. CRISPR-Cas9 genome editing was used to disrupt the gag gene of the expressed type-C ERV group. Comparison of CRISPR-derived mutations at the DNA and RNA level led to the identification of a single ERV as the main source of the release of RNA-loaded viral particles. Clones bearing a Gag loss-of-function mutation in this ERV showed a reduction of RNA-containing viral particle release down to detection limits, without compromising cell growth or therapeutic protein production. Overall, our study provides a strategy to mitigate potential viral particle contaminations resulting from ERVs during biopharmaceutical manufacturing.

Keywords: Chinese hamster ovary cells; adventitious agents; endogenous retroviral elements; genome editing.


Conflict of interest statement

Some of the authors are employed by and/or are consultants of Selexis SA, a company generating therapeutic protein‐producing CHO cell lines. P.O.D. and S.B. university positions were funded in part by the Swiss government, the University of Lausanne and Selexis SA.

Figures

Figure 1
Figure 1
Phylogenetic analyses of Gammaretrovirus‐like endogenous retroviruses (ERV) DNA sequences within the Chinese hamster ovary genome. The ERV phylogenetic trees were constructed from sequence alignments using the neighbor‐joining method and corrected with the DNA evolution model of Tamura and Nei (1993). A total of 10,000 bootstraps were calculated for each tree, and the illustrations represent the consensus of these analyses. (a) The ERV phylogenic tree was based on the alignments of the pol sequences of ERVs and episomal Gammaretroviruses, and the Walleye dermal sarcoma virus was used as outgroup. The ERV sequence families identified in the CHO‐K1 genome are depicted by colors, and only one representative of each group is indicated in the phylogenetic tree. ERVs or Gammaretroviruses described in other species are shown in black letters. (b) The phylogenetic tree of the 131 full‐length type‐C ERV sequences detected in the CHO‐K1 genome was generated based on alignments of the LTRgag‐pol‐envLTR sequences, and FeLV was used as outgroup. Colors represent the different type‐C ERV sequence groups, as in panel A. The ERVs shown in this study to be transcribed in CHO‐K1 cells are indicated by bold letters [Color figure can be viewed at wileyonlinelibrary.com]
Figure 2
Figure 2
Characterization of expressed type‐C endogenous retrovirus (ERV) sequences in parental CHO‐K1 cells. (a) Illumina sequencing reads of the total cellular mRNA (UT mRNA, dark colors), or of the viral genomic RNA extracted from viral particles (UT VP, light colors) obtained from CHO‐K1 cell cultures, were mapped on group 1, 2, and 3 type‐C ERV sequences. Reads were mapped to a consensus of the possibly expressed group 1 sequences and on two distinct loci for group 2 (ETC386F) and group 3 (ETC506F) sequences. The ERV sequence sizes are represented by the x‐axis in base pairs. The lines under the schematic representation of group 2 and 3 ERVs loci indicate probable loss of function mutations occurring in these ERV sequences, blue for frameshift mutations, red for stop codon mutations and gray for deletions, with the deletion size indicated in base pairs. (b) Quantification of the average number of reads per kb of proviral sequence that mapped to the three different ERVs presented in panel A, from a total of 25 Gb and 208 Mb of mappable genomic sequences for cellular mRNA and VP RNA, respectively. (c) Confocal pictures of interphase CHO‐K1 cells subjected to DNA‐FISH (left pictures) or RNA‐FISH (right pictures), using a probe specifically targeting group 1 type‐C ERV (top pictures) or a nonspecific negative control probe (bottom pictures). Pictures were pseudocolored for visualization purposes, chromosomal DNA being represented in red and the DNA fluorescence in situ hybridization (FISH) signals of integrated retroviral sequences shown as green dots. For the RNA‐FISH, DNA staining is shown in blue, whereas ERV type‐C group 1 RNA signals are shown in red. The bright purple dot represents the nascent group 1 RNA signal at the transcription locus. Complete FISH analysis is presented in Figure S1 [Color figure can be viewed at wileyonlinelibrary.com]
Figure 3
Figure 3
Assessment of the diversity of Myr and PPYP flanking sequences and CRISPR‐derived mutations by DNA deep sequencing. (a) Schematic illustration of the pipeline established to identify CRISPR‐derived indel mutations in type‐C endogenous retrovirus (ERV) sequences from targeted DNA amplicon sequencing. Type‐C ERV specific primers were used to amplify approximately 300 bp surrounding the Myr or PPYP CRISPR target sites of the gag genes from untreated and CRISPR‐treated cells, and amplicons were analyzed by Illumina sequencing. Untreated reads were clustered as based on 97% sequence similarity to establish weighted profiles. Profiles were used to distinguish between natural ERV variations and indel mutations in CRISPR‐treated cells. (b, c) Clusters of Myr (panel B) or PPYP (panel C) deep sequencing reads of untreated parental CHO‐K1 cells. Clusters consisting of group 1, group 2 and group 3 type‐C ERV sequences are indicated in blue, purple and red lettering, respectively, according to the phylogenetic groups depicted in Figure 1. Clustered sequences expected to be targeted by CRISPR‐Cas9, as they contain the Myr2 sgRNA or PPYP6 sgRNA recognition sites and an adjacent PAM sequence, are shown in bold. The cluster representing the expressed group 1 type‐C ERV sequence is highlighted in yellow. (d) Number of distinct mutations and their corresponding read frequencies in seven clones (C02, D12, G09, A02, E10, K03, K14) isolated from Myr2 or PPYP6 sgRNA‐treated polyclonal populations, as indicated. Mutations of the expressed group 1 ERV, as previously detected in the mRNA in each clone, are indicated with a bold frame. Gray shaded boxes represent mutations occurring at a frequency higher than 0.4% (left‐hand side axis), thus implying the occurrence of the same mutation in more than one ERV locus, where the distinct ERV loci are separated by dotted lines. The estimated total number of mutated ERV loci of each clone is indicated by the right‐hand side axis. (e) Frequency of Myr2 or PPYP6 sgRNA‐induced repair junctions compatible with C‐NHEJ, alt‐EJ or HR DSB repair mechanisms. Repair junctions incompatible with these three main DSB repair mechanisms are grouped as Unknown. A total of 67 DNA repair junctions (nMyr = 45, nPPYP = 22) obtained from both Sanger cDNA and Illumina deep DNA sequencing were analyzed. (f, g) Proportion of the various mutations detected in each of the ERV sequence clusters shown in panels B and C, respectively. Clusters containing the Myr2 or PPYP6 sgRNA recognition sites including an adjacent PAM site are shown in bold letters as in panels B and C, while clusters with sgRNA possessing mismatches at position 13 or 15 in the sgRNA recognition site mismatches are shown in normal letters. The cluster representing the expressed group 1 type‐C ERV sequence is highlighted in yellow, as for panels B and C [Color figure can be viewed at wileyonlinelibrary.com]
Figure 4
Figure 4
Identification of a unique functionally active group 1 type‐C endogenous retrovirus (ERV) locus and assessment of ERV conservation and zygosity in CHO cells and Chinese hamster genome. (a) Predicted group 1 type‐C ETC109F ERV integration site (highlighted in yellow) in the publicly available NCBI CHO‐K1 genome (NW_003613637.1 assembly). The genomic region surrounding the ERV integration site contains two annotated protein‐coding genes (Cidec, Jagn1) encoding the cell death‐inducing DFFA‐like effector protein involved in lipid metabolism and an endoplasmic reticulum protein involved in the early secretory pathway, respectively (Boztug et al., 2014; Puri et al., 2007). The predicted RNA expression levels for each gene in CHO‐K1 cells were estimated by RNA sequencing data and are expressed as Reads per Kilobase (RPK). (b) Sanger sequencing results of the Myr2 (left‐hand side) and PPYP6 (right‐hand side) sgRNA flanking regions of the indicated ERV‐mutated CHO cell clones. Sanger sequencing was performed on polymerase chain reaction (PCR) amplicons obtained from reverse‐transcribed total cellular mRNA using group 1‐specific primers (in light gray), or from genomic DNA using primers specific to the ETC109F genomic locus (in the dark gray). Clones C02, D12, G09, A02, E10, K03, K14 contain deletions in the functionally active group 1 type‐C ERV locus (horizontal red lines), unlike the B01 and B03 control clones as well as the empty vector‐treated control cells. The predicted Myr2 and PPYP6 sgRNA‐mediated DNA cleavage sites are indicated with a vertical dotted line. (c) Genomic sequences of the expressed ETC109F, ETC386F, and ETC506F and flanking sequences were PCR amplified from CHO‐K1, CHO‐DG44, and Chinese hamster genomic DNA using primers specific to the left and right DNA borders or the ERV extremities, and the amplified DNA was analyzed by gel electrophoresis. Summary of the detection (tick) or absence (cross) of stably integrated ERVs into their corresponding genomic locus as well as their zygosity in the indicated genomes for the three expressed group 1, 2, or 3 ERVs (d) Description of the history of CHO cell lines, adapted from Lewis et al. (2013). CHO, Chinese hamster ovary [Color figure can be viewed at wileyonlinelibrary.com]
Figure 5
Figure 5
Assessment of viral RNA amounts released in VP by ERV‐mutated CHO cells. The retroviral RNA genomes were isolated from viral particles present within the supernatants of five‐day cultures of untreated cells (UT), empty sgRNA vector‐treated cells (Empty), bulk‐sorted polyclonal CRISPR‐treated cells (Poly), as well as clones containing mutations in the expressed type‐C group 1 ERV locus (C02, D12, G09, A02, E10, K03, and K14) or without a detected ERV mutation (B01, B03). (a) The RNA was processed for Illumina sequencing and the obtained reads were mapped onto the group 1 type‐C ERV locus ETC109F sequence. The ERV sequence coordinates are shown by the x‐axis in base pairs and the numbers of reads beginning at each ERV sequence position are shown by the log scale y‐axis. (b) The reads as analyzed in panel A were mapped to the sequences of the expressed group 1 ERV locus ETC109F (blue bars) and to the 45S ribosomal RNA (black bars) sequences of CHO cells used as a control. The y‐axis represents the number of reads per kilobases for each sequencing reaction. (c) Quantitative polymerase chain reaction (qPCR) analysis of the reverse‐transcribed total RNA isolated from VP released in cell culture supernatants. Reverse transcription and qPCR analysis were performed in triplicates from samples obtained from three independent CHO cell cultures. The genomic retroviral sequences were quantified using group 1 ERV LTR‐specific primers. Data were normalized to the number of analyzed cells and are represented as the average and standard deviation of the fold change relative to those of UT cells. CHO, Chinese hamster ovary; ERV, endogenous retrovirus [Color figure can be viewed at wileyonlinelibrary.com]
Figure 6
Figure 6
Analysis of cell growth and therapeutic immunoglobulin protein production by ERV‐mutated CHO cell clones. Untreated (UT) or empty sgRNA vector‐treated (Empty) control cells, bulk‐sorted polyclonal CRISPR‐treated cells (Poly), as well as cells from isolated clones containing mutations in the expressed ERV locus (C02, D12, G09, A02, E10, K03, and K14) or not (B01, B03) were stably transfected to express the trastuzumab immunoglobulin (IgG), and the stable polyclonal cell pools were assessed for cell density (a), cell viability (b) and IgG production (c) during 10‐days fed‐batch cultures. Statistical significance relative to the empty vector control was calculated using the two‐tailed unpaired Student's t‐test with Benjamini and Hochberg false discovery rate correction (n = 3 for all samples, except for A02 for which n = 2, error bars represent standard error of mean, *p < .05; **p < .01). CHO, Chinese hamster ovary; ERV, endogenous retrovirus [Color figure can be viewed at wileyonlinelibrary.com]

Similar articles

Cited by

References

    1. Aguirre, A. J. , Meyers, R. M. , Weir, B. A. , Vazquez, F. , Zhang, C. Z. , Ben‐David, U. , & Hahn, W. C. (2016). Genomic copy number dictates a gene‐independent cell response to CRISPR/Cas9 targeting. Cancer Discovery, 6(8), 914–929. 10.1158/2159-8290.CD-16-0154 - DOI - PMC - PubMed
    1. Altschul, S. F. , Gish, W. , Miller, W. , Myers, E. W. , & Lipman, D. J. (1990). Basic local alignment search tool. Journal of Molecular Biology, 215(3), 403–410. 10.1016/S0022-2836(05)80360-2 - DOI - PubMed
    1. Anderson, K. P. , Lie, Y. S. , Low, M. A. , Williams, S. R. , Fennie, E. H. , Nguyen, T. P. , & Wurm, F. M. (1990). Presence and transcription of intracisternal A‐particle‐related sequences in CHO cells. Journal of Virology, 64(5), 2021–2032. - PMC - PubMed
    1. Anderson, K. P. , Low, M.‐A. , Lie, Y. S. , Keller, G.‐A. , & Dinowitz, M. (1991). Endogenous origin of defective retroviruslike particles from a recombinant Chinese hamster ovary cell line. Virology, 181(1), 305–311. 10.1016/0042-6822(91)90496-x - DOI - PubMed
    1. Bae, S. , Kweon, J. , Kim, H. S. , & Kim, J. (2014). Microhomology‐based choice of Cas9 nuclease target sites. Nature Methods, 11(7), 705–706. 10.1038/nmeth.3015 - DOI - PubMed

Publication types