. 2019 Oct 17:8:e49882.
doi: 10.7554/eLife.49882.

Obesity-linked suppression of membrane-bound O-acyltransferase 7 (MBOAT7) drives non-alcoholic fatty liver disease

Affiliations

Obesity-linked suppression of membrane-bound O-acyltransferase 7 (MBOAT7) drives non-alcoholic fatty liver disease

Robert N Helsley et al. Elife. .

Abstract

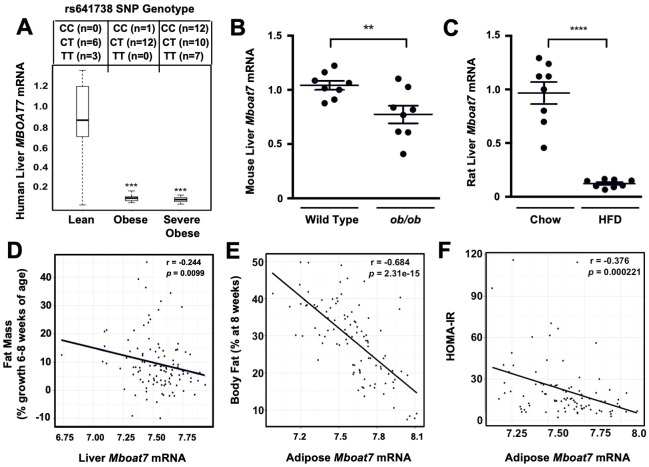
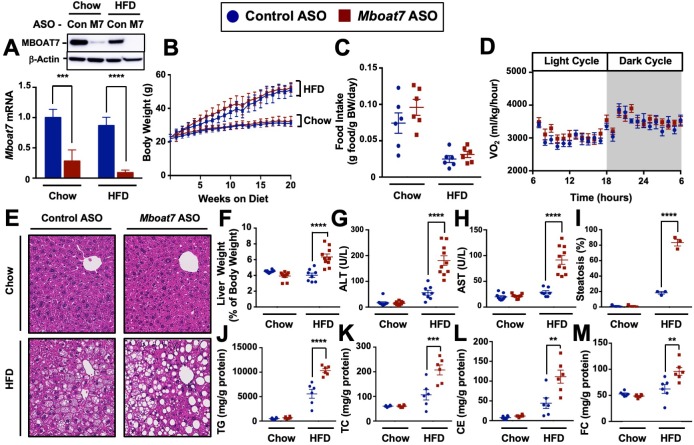
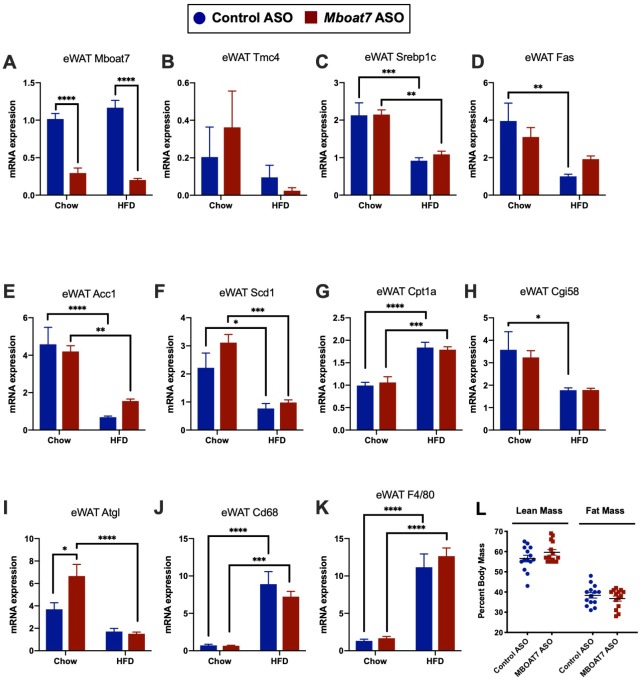
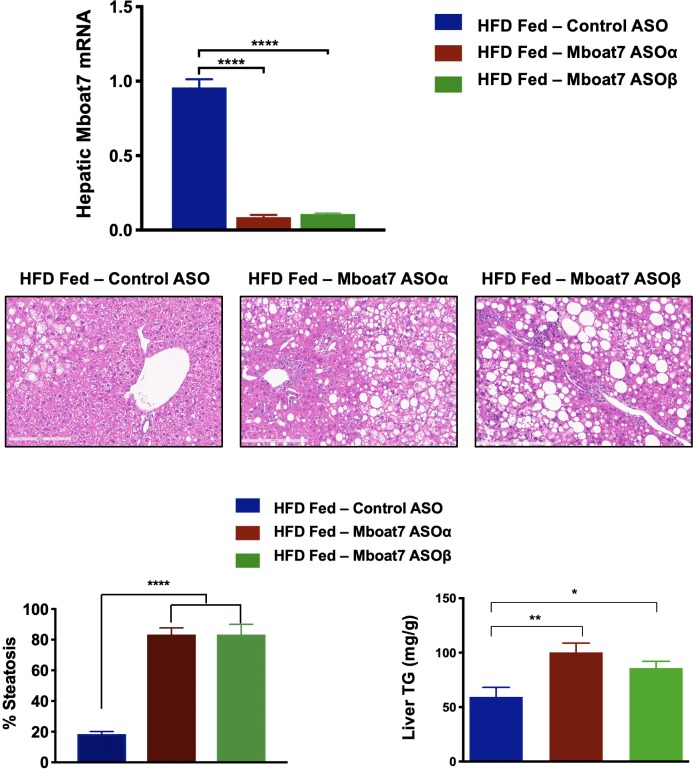
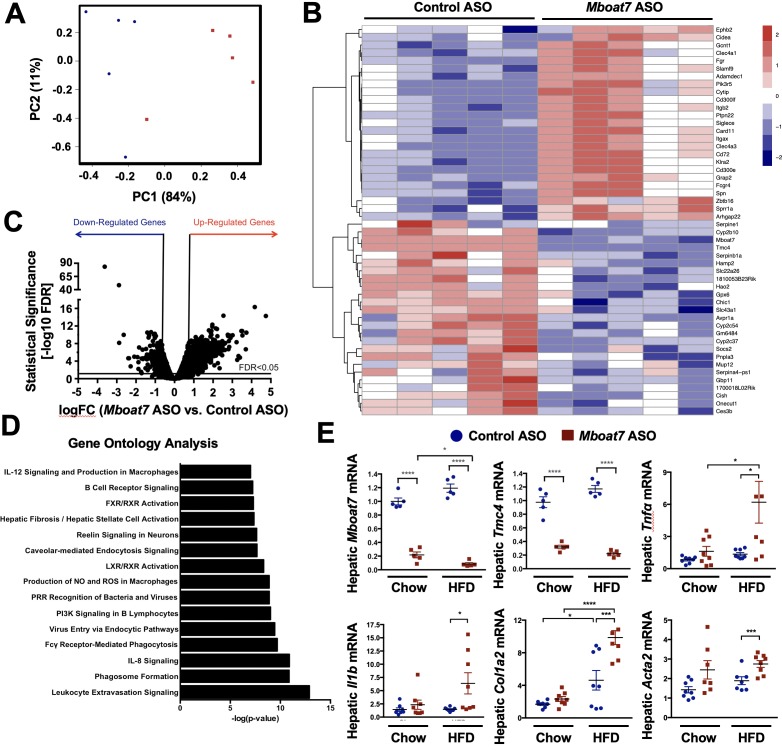
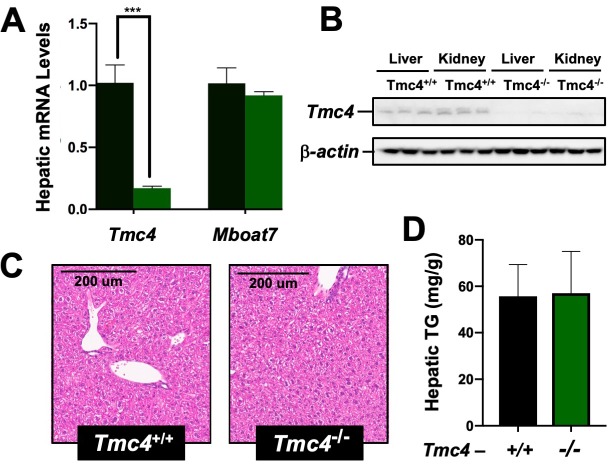
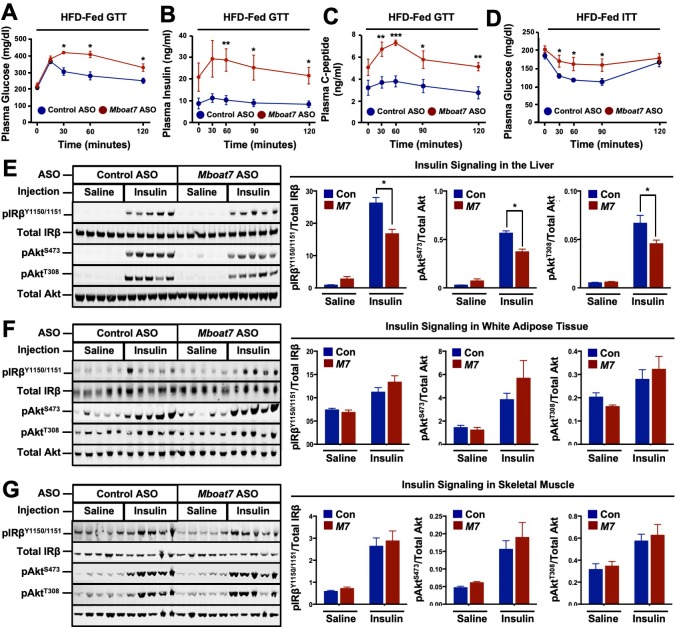
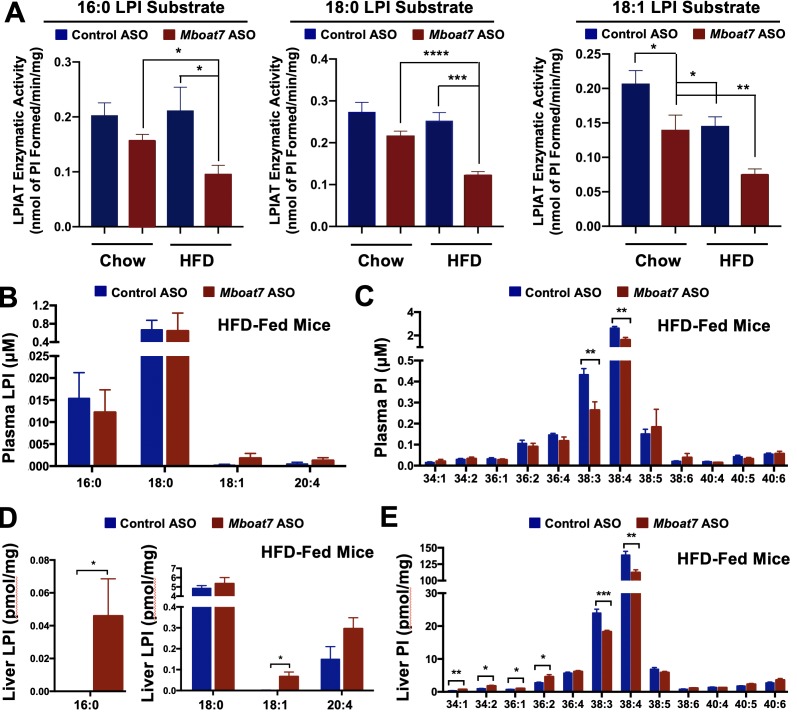
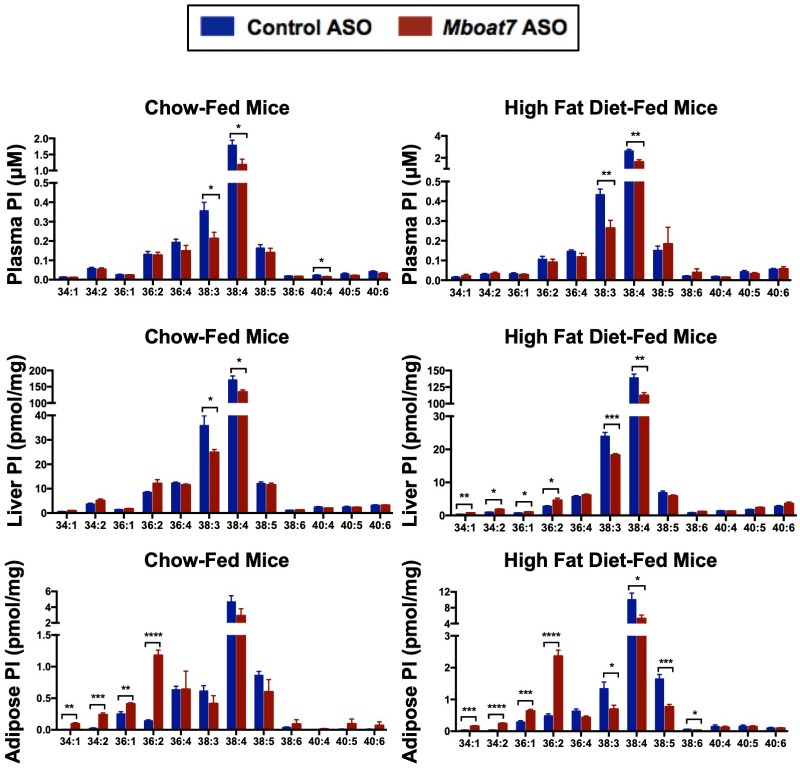
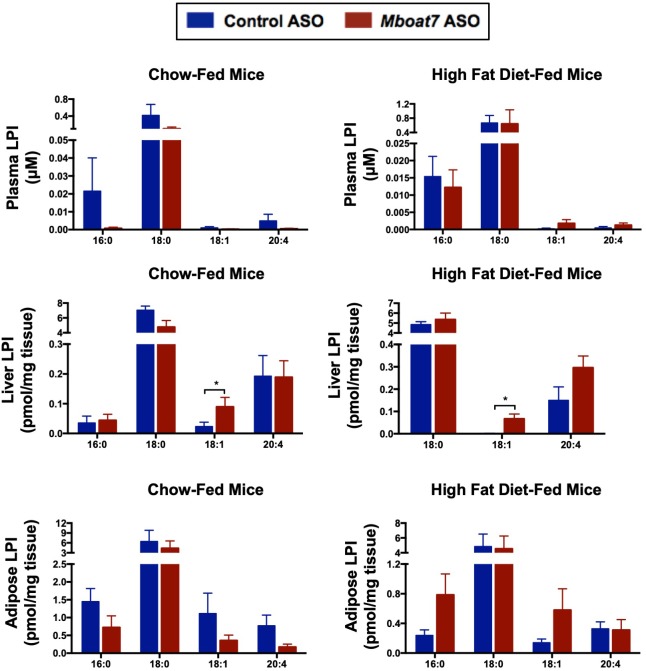
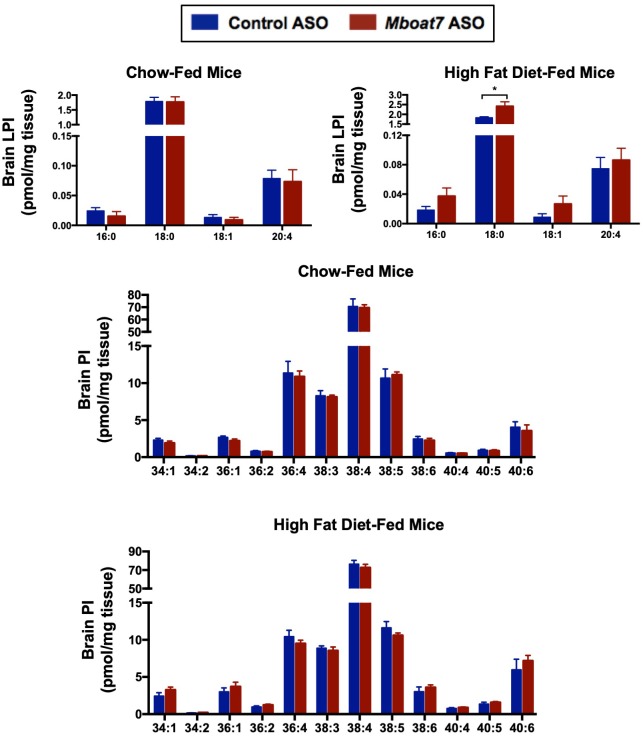
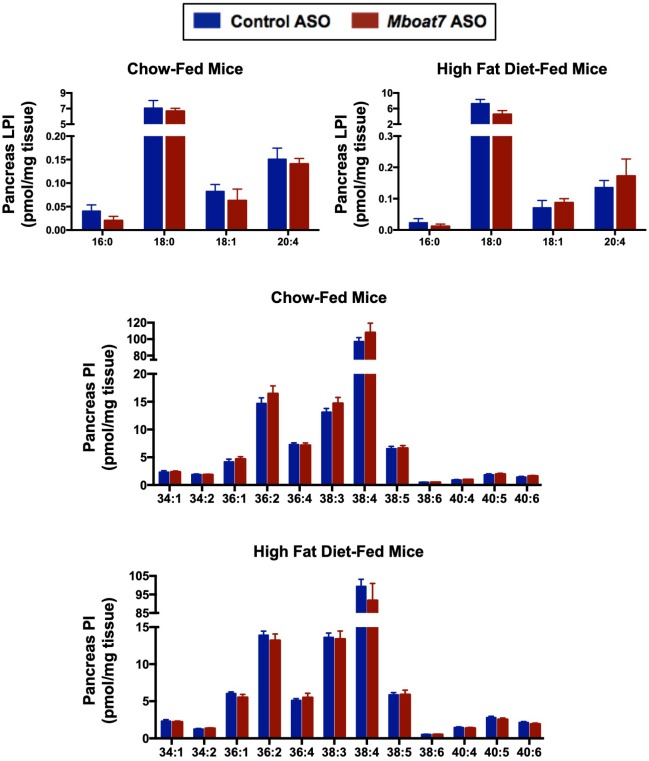
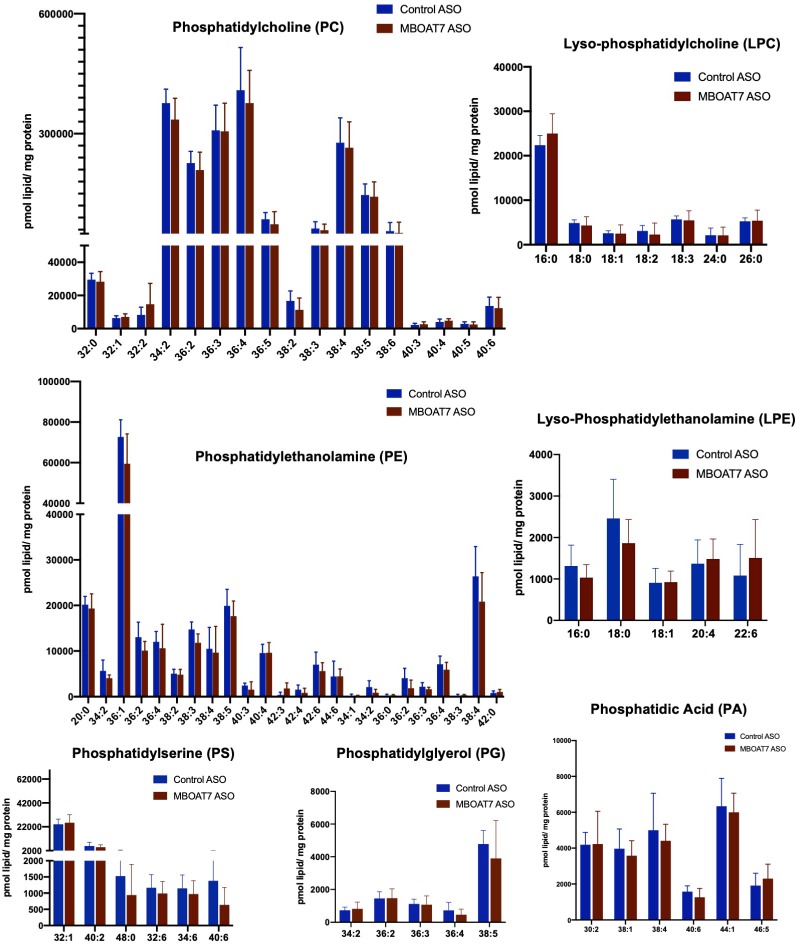
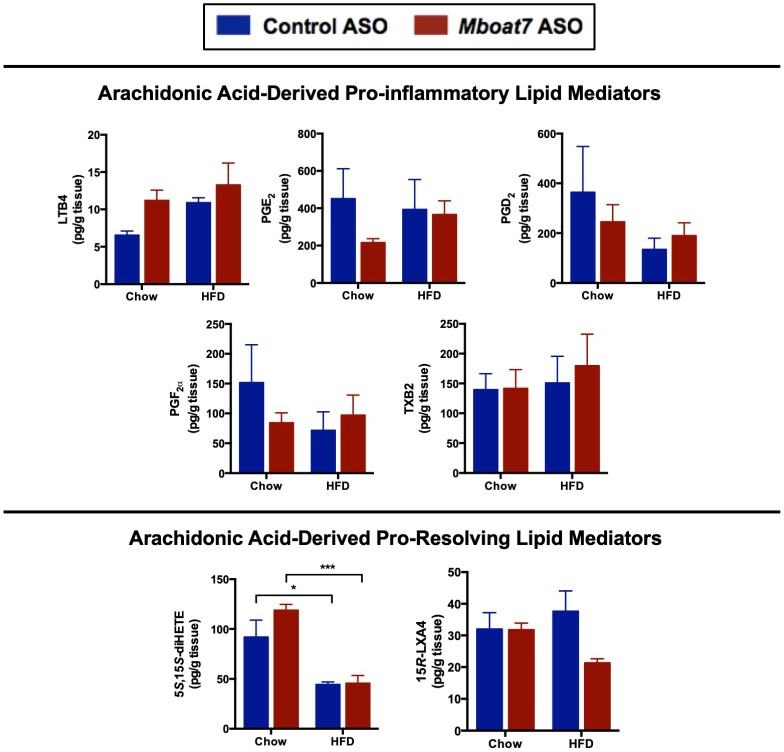
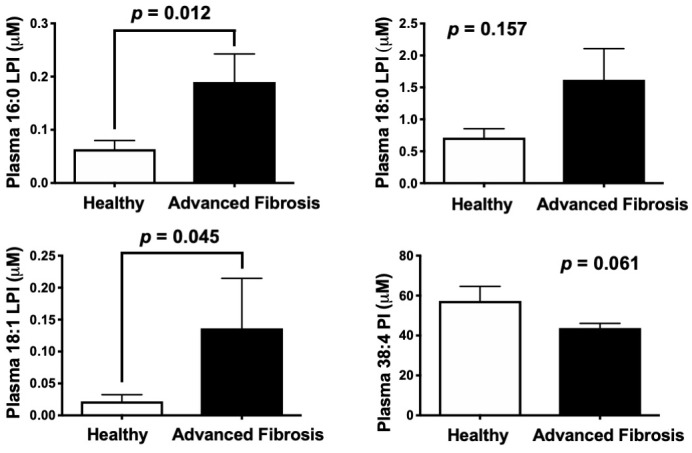
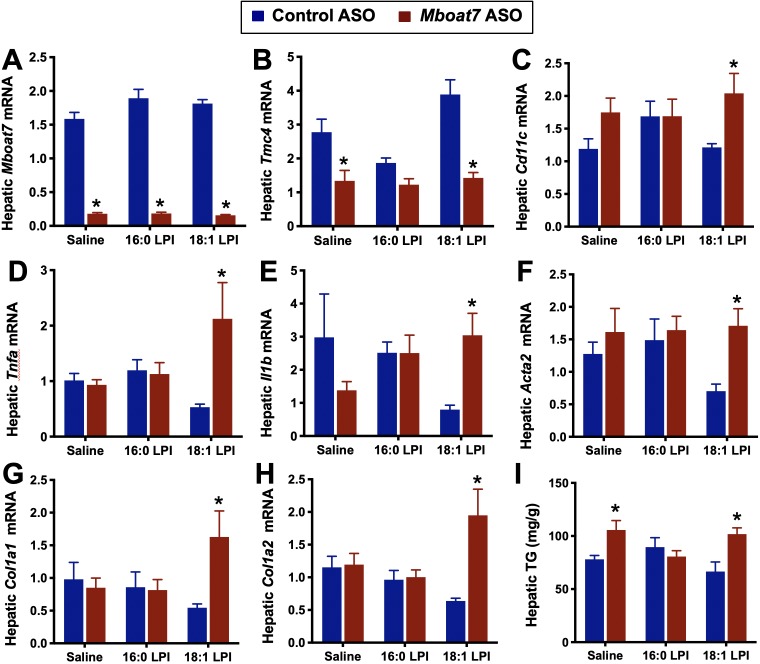
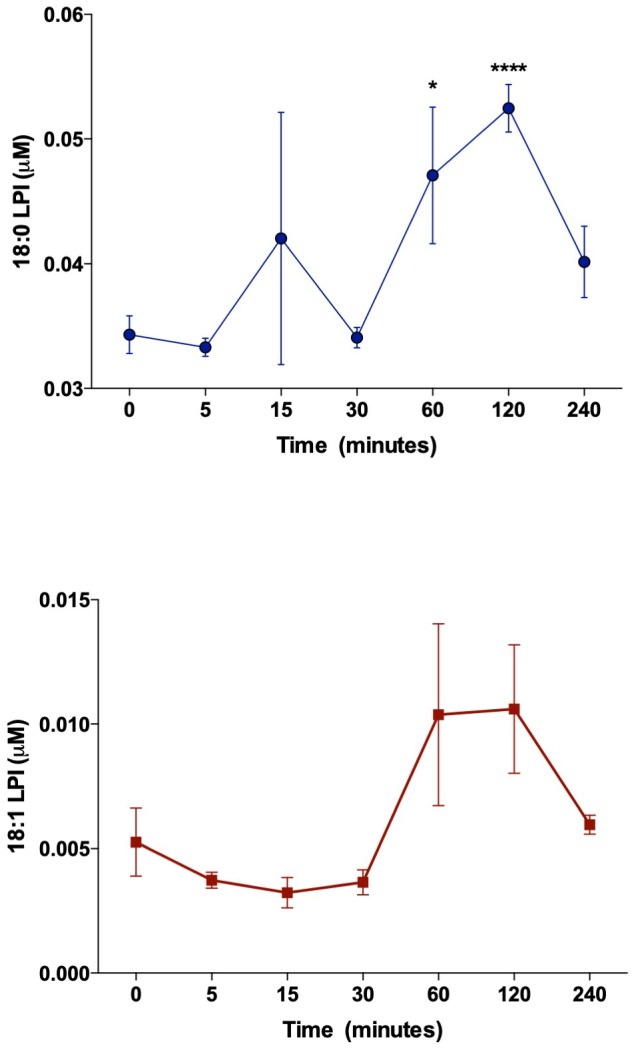
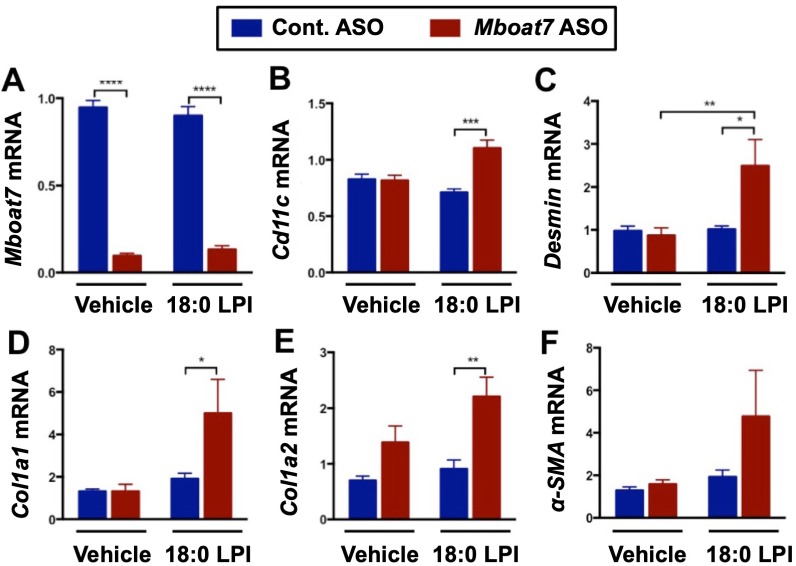
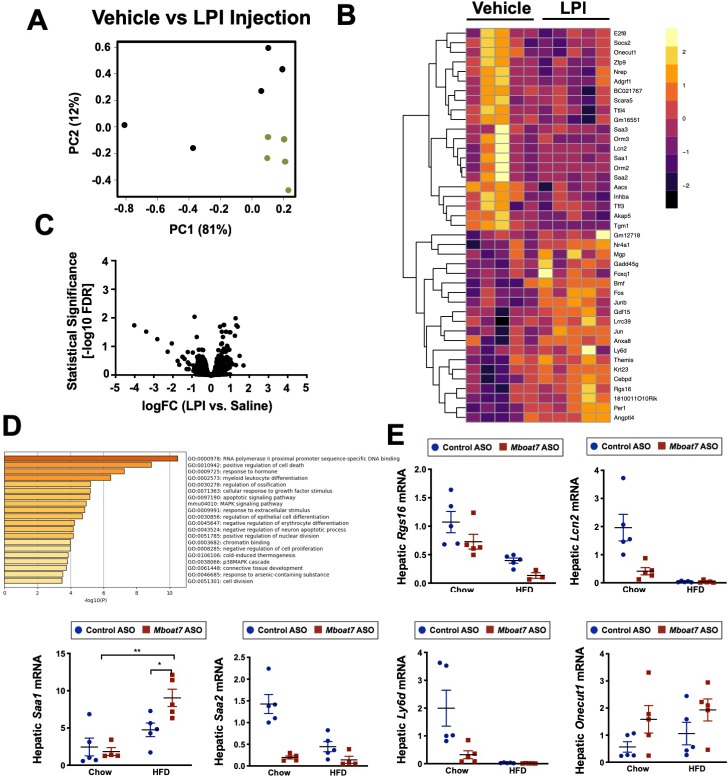
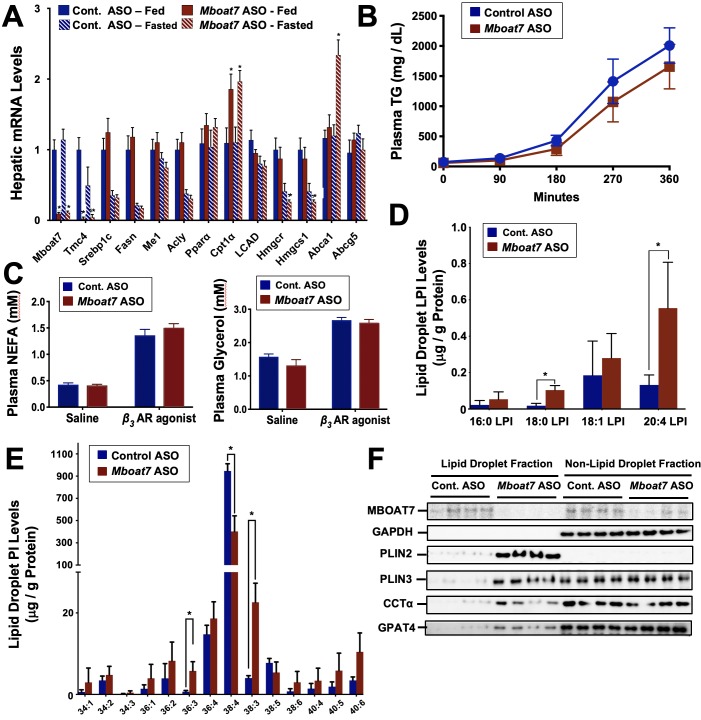
Recent studies have identified a genetic variant rs641738 near two genes encoding membrane bound O-acyltransferase domain-containing 7 (MBOAT7) and transmembrane channel-like 4 (TMC4) that associate with increased risk of non-alcoholic fatty liver disease (NAFLD), non-alcoholic steatohepatitis (NASH), alcohol-related cirrhosis, and liver fibrosis in those infected with viral hepatitis (Buch et al., 2015; Mancina et al., 2016; Luukkonen et al., 2016; Thabet et al., 2016; Viitasalo et al., 2016; Krawczyk et al., 2017; Thabet et al., 2017). Based on hepatic expression quantitative trait loci analysis, it has been suggested that MBOAT7 loss of function promotes liver disease progression (Buch et al., 2015; Mancina et al., 2016; Luukkonen et al., 2016; Thabet et al., 2016; Viitasalo et al., 2016; Krawczyk et al., 2017; Thabet et al., 2017), but this has never been formally tested. Here we show that Mboat7 loss, but not Tmc4, in mice is sufficient to promote the progression of NAFLD in the setting of high fat diet. Mboat7 loss of function is associated with accumulation of its substrate lysophosphatidylinositol (LPI) lipids, and direct administration of LPI promotes hepatic inflammatory and fibrotic transcriptional changes in an Mboat7-dependent manner. These studies reveal a novel role for MBOAT7-driven acylation of LPI lipids in suppressing the progression of NAFLD.

Keywords: NAFLD; hepatology; human biology; medicine; mouse; triacylglycerol.


Conflict of interest statement

RH, VV, AB, AG, RS, IR, KF, MK, RB, CN, CF, PP, DO, LO, WM, RZ, AK, BS, CP, JS, ML, VG, JK, DA, MC, PF, LR, AL, MS, JB No competing interests declared, RL, RC, MG employee at Ionis Pharmaceuticals, Inc

Figures

Figure 1.
Figure 1.. Obesity suppress MBOAT7 expression in humans, mice, and rats.
(A) To investigate the impact human obesity has on MBOAT7 expression, we obtained wedged liver biopsies from sequentially consenting bariatric surgery patients and normal weight controls. We used these biopsies to isolate RNA and measure MBOAT7 expression via qPCR. The data are stratified based on BMI. A total of 52 liver biopsies were analyzed. Lean (BMI <30; n = 10), Obese (30 < BMI > 40; n = 13), and Severely Obese (BMI >40; n = 29) ***p≤0.001 compared to the lean group. Status of the rs641738 SNP is shown in the top inset. (B) Liver MBOAT7 expression was measured by QPCR from wild type and ob/ob mice 16–20 weeks of age (n = 8; **p≤0.01; two-tailed t-test; Data are presented as mean ± S.E.M.) (C) Liver MBOAT7 expression was measured by QPCR from Sprague Dawley rats fed a low fat or high fat high diet for 24 weeks (n = 8; **p≤0.01; two-tailed t-test; Data are presented as mean ± S.E.M.). (D–F) We used a systems genetics approach to examine links between MBOAT7 expression and metabolic traits in mice from the hybrid mouse diversity panel (HMDP). To induce obesity, all mouse strains represented in the HMDP were fed an obesity-promoting high fat and high sucrose diet. Across the different strains in the HMDP, we found that the expression of MBOAT7 in adipose tissue was strongly negatively correlated with body fat percentage (E), and HOMA-IR (F), while liver MBOAT7 expression was also negatively correlated with fat mass (D).
Figure 2.
Figure 2.. Mboat7 knockdown promotes hepatic steatosis and worsen liver injury.
(A and B) C57BL/6 mice were fed chow or HFD with concurrent Control and Mboat7 ASO Injections at 12.5 mg/kg week for 20 weeks. Liver Mboat7 expression was measured via qPCR (A); n = 8–10; *p≤0.05, ****p≤0.0001; Two-way ANOVA with Tukey’s post-hoc test). The inset show a representative Western blot for hepatic MBOAT7 protein levels, which was replicated in n = 4 mice. (B) Body weight was measured weekly. (C) Food intake was measured in C57BL/6 mice at 12 weeks of diet and ASO injections (n = 6). (D) Oxygen consumption was measured by indirect calorimetry in C57BL/6 mice after 12 weeks of diet and ASO injections (n = 6). (E) Representative liver hematoxylin and eosin stained sections. 20x magnification. (F) Liver-to-body weight measurements from mice fed Chow and HFD with Control and Mboat7 ASO Injections for 20 weeks (n = 8–10; ****p≤0.0001; Two-way ANOVA with Tukey’s post-hoc test). (G and H) Plasma ALT (G) and AST (H) levels were measured after 20 weeks of diet feeding and ASO injections (n = 8–10; ****p≤0.0001; Two-way ANOVA with Tukey’s post-hoc test). (I) Percent steatosis quantified by a blinded board certified pathologist at the Cleveland Clinic (n = 3; ****p≤0.0001; Two-way ANOVA with Tukey’s post-hoc test). (J–M) Hepatic triglycerides (J), hepatic cholesterol (K), hepatic esterified cholesterol (L), and hepatic free cholesterol (M) were measured colorimetrically (n = 8–10; **p≤0.01, ***p≤0.001, ****p≤0.0001; Two-way ANOVA with Tukey’s post-hoc test). All data are presented as mean ± S.E.M., unless otherwise noted.
Figure 2—figure supplement 1.
Figure 2—figure supplement 1.. Mboat7 ASO treatment reduces Mboat7 expression in white adipose tissue (WAT), but does not dramatically alter WAT gene expression or adiposity.
C57BL/6 mice were fed chow or HFD with concurrent Control and Mboat7 ASO Injections at 12.5 mg/kg week for 20 weeks. Panels (A–K): WAT gene expression was measured using qPCR. (L) Lean and fat mass were quantified using EchoMRI imaging in HFD-fed mice.
Figure 2—figure supplement 2.
Figure 2—figure supplement 2.. Mboat7 ASO treatment does not alter Mboat7 expression in several extrahepatic tissues.
C57BL/6 mice were fed chow with concurrent Control and MBOAT7 ASO Injections at 12.5 mg/kg week for 20 weeks. Brain, spleen, heart, and skeletal muscle MBOAT7 expression was measured via qPCR (n = 5). Data are presented as mean ± S.E.M.
Figure 2—figure supplement 3.
Figure 2—figure supplement 3.. A reduction in hepatic MBOAT7 expression does not alter metabolic parameters.
C57BL/6 mice were fed chow or HFD with concurrent Control and MBOAT7 ASO injections at 12.5 mg/kg week for 12 weeks. Oxygen consumption (VO2), carbon dioxide expiration (VCO2), respiratory exchange ratio (RER), heat, and movement (X and Z plane) were measured using the Oxymax CLAMS indirect calorimetry system (n = 6 per group).
Figure 2—figure supplement 4.
Figure 2—figure supplement 4.. Hepatic steatosis is observed in two distinct ASOs targeting different regions of the Mboat7 mRNA.
C57BL/6 mice were fed chow or HFD with concurrent Control (non-targeting) or two distinct Mboat7 ASOs (Mboat7 ASOα or Mboat7 ASOβ) Injections at 12.5 mg/kg week for 20 weeks. Shown are representative H and E-stained liver sections, blinded pathology scoring of hepatic steatosis (n = 3 per group), and enzymatic measurement of liver triacylglycerol (TG).
Figure 2—figure supplement 5.
Figure 2—figure supplement 5.. Knockdown of Mboat7 alters plasma lipid levels in chow but not HFD-fed mice.
Male C57BL/6 mice were fed either chow or a HFD for 20 weeks while receiving concurrent ASO injections. (A and B) Plasma cholesterol (A) and triglyceride (B) levels were measured enzymatically (n = 5). (C–F) Plasma lipoprotein profile of cholesterol in chow (C, D) and HFD-fed (E, F) mice (n = 5; *p≤0.05; two-tailed t-test). Data are presented as mean ± S.E.M.
Figure 3.
Figure 3.. Mboat7 inhibition exacerbates inflammation and fibrotic gene expression in the liver.
(A–C) C57BL/6 mice were fed a HFD with concurrent Control and Mboat7 ASO Injections at 12.5 mg/kg week for 20 weeks. Liver RNA was used for RNA-sequencing. ASO groups clustered by principal component analysis (A). Row-normalized expression for the top 50 DEGs are shown by heat map (B) while the volcano plot (C) summarizes log2 fold changes vs significance in response to Mboat7 inhibition (n = 5; genes with FDR < 0.05 and fold change >2 were considered significantly differentially expressed). (D) Summary of significantly differentially regulated pathways in mice treated with a non-targeting Control ASO vs the Mboat7 ASO. (E) qPCR validation of selected gene expression changes discovered in the RNA-sequencing analysis in both Chow and HFD-fed mice receiving Control or MBOAT7 ASOs for 20 weeks (n = 8–10; *p≤0.05, ***p≤0.001, ****p≤0.0001; Two-way ANOVA with Tukey’s post-hoc test). All data are presented as mean ± S.E.M., unless otherwise noted.
Figure 3—figure supplement 1.
Figure 3—figure supplement 1.. A reduction in Mboat7 expression alters hepatic immune cell populations.
Male C57BL/6 mice were fed a HFD with concurrent Control and MBOAT7 ASO Injections at 12.5 mg/kg week for 20 weeks. Distinct inflammatory cell populations in the liver were assessed by flow cytometry (n = 5; *p≤0.05, **p≤0.01; two-tailed t-test). Data are presented as mean ± S.E.M.
Figure 4.
Figure 4.. Tmc4 knockout mice do not exhibit fatty liver.
Male wild type (Tmc4+/+) or Tmc4 global knockout mice (Tmc4-/-) were fed a high fat diet for 2 weeks. (A) Hepatic gene expression for Tmc4 and Mboat7 measured by qPCR. (B) Western blot of TMC4 protein levels in the liver and kidney. (C) Representative H and E-stained liver sections from Tmc4+/+ and Tmc4-/-. (D) Hepatic triglyceride (TG) levels in Tmc4+/+ and Tmc4-/- were quantified biochemically. Data shown represent n = 5–6 mice per group, ***p<0.001; two-tailed t-test relative to Tmc4+/+ mice.
Figure 5.
Figure 5.. A reduction in Mboat7 expression exacerbates hepatic insulin resistance in HFD-fed mice.
(A–C) C57BL/6 mice were fed a HFD with concurrent Control and Mboat7 ASO Injections at 12.5 mg/kg week for 20 weeks. Plasma glucose (A), plasma insulin (B), and plasma C-peptide (C) levels were measured throughout the course of an intraperitoneal glucose tolerance test (n = 4–5; *p≤0.05, **p≤0.01; two-tailed t-test relative to control ASO at same time point). (D) Plasma glucose was measured after an intraperitoneal insulin injection in mice fed HFD for 20 weeks with Control and Mboat7 ASO injections (n = 4–5; *p≤0.05, **p≤0.01; two-tailed t-test relative to control ASO at same time point). (E–G) Mice were fed a HFD for 20 weeks while injected with Control or Mboat7 ASOs, then saline or insulin (0.35 U/kg) was injected into the portal vein for 5 min. The insulin signaling pathway was examined via western blot in tissues: liver (E), skeletal muscle (F), and white adipose tissue (G) (n = 5) each sample represents an independent mouse; western blot is quantified by densitometry on the right; *p≤0.05; Two-way ANOVA with Tukey’s post-hoc test). All data are presented as mean ± S.E.M., unless otherwise noted.
Figure 6.
Figure 6.. HFD-feeding and Mboat7 inhibition results in an accumulation of LysoPIs.
Male C57BL/6 mice were fed either chow or a HFD for 20 weeks along with receiving a control non-targeting ASO or an ASO targeting the knockdown of Mboat7. (A) Liver microsomes were isolated and assayed for lyso-phosphatidylinositol acyltransferase (LPIAT) activity, using [14C]-arachidonyl-CoA and either 16:0 LPI, 18:0 LPI, or 18:1 LPI as substrates. Plasma LPI (B) or PI (C) species were measured by LC-MS/MS (n = 5; *p≤0.05; two-tailed t-test). Liver LPI (D) and PI (E) species were measured by LC-MS/MS (n = 5–10 per group; *p≤0.05, **p≤0.01, ***p≤0.001; two-tailed t-test). All data are presented as mean ± S.E.M.
Figure 6—figure supplement 1.
Figure 6—figure supplement 1.. Mboat7 ASO treatment impacts PI metabolism.
Male C57BL/6 mice were fed either chow or a HFD for 20 weeks while receiving concurrent ASO injections. Plasma, liver, and adipose PI levels were measured by semi-quantitative LC-MS/MS in both chow and HFD-feeding conditions (n = 5; *p≤0.05, **p≤0.01, ***p≤0.001, ****p≤0.0001; two-tailed t-test). Data are presented as mean ± S.E.M.
Figure 6—figure supplement 2.
Figure 6—figure supplement 2.. Mboat7 ASO treatment impacts LPI metabolism.
Male C57BL/6 mice were fed either chow or a HFD for 20 weeks while receiving concurrent ASO injections. Plasma, liver, and adipose LPI levels were measured by semi-quantitative LC-MS/MS in both chow and HFD-feeding conditions (n = 5; *p≤0.05, **p≤0.01; two-tailed t-test). Data are presented as mean ± S.E.M.
Figure 6—figure supplement 3.
Figure 6—figure supplement 3.. Mboat7 ASO treatment does not influence brain LPI and PI levels.
Male C57BL/6 mice were fed either chow or a HFD for 20 weeks while receiving concurrent ASO injections. Brain LPI and PI species were measured by semi-quantitative LC-MS/MS in both chow and HFD-feeding conditions (n = 5). Data are presented as mean ± S.E.M.
Figure 6—figure supplement 4.
Figure 6—figure supplement 4.. Mboat7 ASO treatment does not influence pancreas LPI and PI levels.
Male C57BL/6 mice were fed either chow or a HFD for 20 weeks while receiving concurrent ASO injections. Pancreas LPI and PI species were measured by semi-quantitative LC-MS/MS in both chow and HFD-feeding conditions (n = 5). Data are presented as mean ± S.E.M.
Figure 6—figure supplement 5.
Figure 6—figure supplement 5.. Mboat7 ASO treatment does not significantly alter other major phospholipid species.
Male C57BL/6 mice were fed HFD with concurrent Control or Mboat7 ASO Injections at 12.5 mg/kg week for 20 weeks. Liver samples were subjected to untargeted shotgun lipidomics to measure the levels of major phospholipids including phosphatidylcholines (PC), lysophosphatidylcholines (LPC), phosphatidylethanolamines (PE), lysophosphatidylethanolamines (LPE), phosphatidylserines (PS), phosphatidylglycerols (PG), or phosphatidic acids (PA).
Figure 6—figure supplement 6.
Figure 6—figure supplement 6.. Mboat7 ASO treatment does not drastically influence AA-derived lipid mediators.
Male C57BL/6 mice were a chow or a HFD with concurrent Control and MBOAT7 ASO Injections at 12.5 mg/kg week for 20 weeks. Liver samples were subjected to LC-MS/MS metabololipidomic profiling. Levels of individual arachidonic acid-derived pro-inflammatory and pro-resolving lipid mediators and were measured (n = 5; *p≤0.05, ***p≤0.001; Two-way ANOVA with Tukey’s post-hoc test). Data are presented as mean ± S.E.M.
Figure 7.
Figure 7.. Circulating levels of saturated lysophosphatidylinositol (LPI) lipids are increased in humans with advanced fibrosis.
Plasma from healthy subjects with no fibrosis (Ishak score = 0) or pathology proven advanced fibrosis (Ishak score = 4) were analyzed by LC-MS/MS to quantify MBOAT7 substrates (16:0 LPI, 18:0 LPI, and 18:1 LPI) and product (38:4 PI) lipids. All data are presented as mean ± S.E.M from n = 10 subjects per group, and group differences were determined using Mann-Whitney testing.
Figure 8.
Figure 8.. Lysophosphatidylinositol (LPI) lipids stimulate pro-inflammatory and pro-fibrotic gene expression in a Mboat7-dependent manner.
Male C57BL/6 mice were treated with either a non-targeting control ASO or Mboat7 ASO while being fed a high fat diet for 11 weeks. Thereafter, mice were injected IP with saline (vehicle) or 12.5 μg of the Mboat7 substrate lipids 16:0 or 18:1 LPI (2 injections at 7 am and seven pm), and liver was collected 12 hr later. (A–H) Liver mRNA levels were measured by qPCR. (I) Liver triacylglycerol (TG) levels. Data are presented as mean ± S.E.M. (n = 5; *p≤0.05).
Figure 8—figure supplement 1.
Figure 8—figure supplement 1.. Accumulation of LPI species elevate after 4 hr post-injection.
For dose testing 8–10 week old male WT C57BL/6 mice were fasted for 5 hr prior to an IP injection of the MBOAT7 substrate 18:0 LPI or 18:1 LPI. Over the course of 4 hr, plasma was isolated and 18:0 and 18:1 LPI levels were measured by quantitative LC-MS/MS (n = 4; *p≤0.05, ****p≤0.001; One-way ANOVA Tukey’s post-hoc test). Data are presented as mean ± S.E.M.
Figure 8—figure supplement 2.
Figure 8—figure supplement 2.. 18:0 LPI stimulates pro-inflammatory and pro-fibrotic gene expression in a Mboat7-dependent manner.
Male C57BL/6 mice were treated with either a non-targeting control ASO or Mboat7 ASO while being fed a high fat diet for 11 weeks. Thereafter, mice were injected IP with saline (vehicle) or 12.5 μg of the Mboat7 substrate lipid 18:0 LPI (2 injections at 7 am and seven pm), and liver was collected 12 hr later. Hepatic RNA levels of Mboat7 (A), Cd11c (B), Desmin (C), Col1A1 (D), Col1A2 (E), and Acta2 (F) were measured by qPCR (n = 5; *p≤0.05, **p≤0.01, ***p≤0.001, ****p≤0.0001; Two-way ANOVA with Tukey’s post-hoc test). Data are presented as mean ± S.E.M.
Figure 8—figure supplement 3.
Figure 8—figure supplement 3.. LPI lipids alter hepatic gene expression.
C57BL/6 mice were fed chow and injected IP with saline (vehicle) or 12.5 μg of the Mboat7 substrate lipid 18:0 LPI (2 injections at 7 am and seven pm), and liver was collected 12 hr later. Liver RNA was used for RNA-sequencing. Injection groups clustered by principal component analysis (A). Row-normalized expression for the top 50 DEGs are shown by heat map (B) while the volcano plot (C) summarizes log2 fold changes vs significance in response to LPI injection (n = 5; genes with FDR < 0.05 and fold change >2 were considered significantly differentially expressed). (D) Summary of significantly differentially regulated pathways in mice treated with a saline vehicle or 18:0 LPI. (E) qPCR validation of selected gene expression changes discovered in the RNA-sequencing analysis in both Chow and HFD-fed mice receiving Control or MBOAT7 ASOs for 20 weeks (n = 8–10; *p≤0.05, ***p≤0.001, ****p≤0.0001; Two-way ANOVA with Tukey’s post-hoc test). All data are presented as mean ± S.E.M., unless otherwise noted.
Figure 9.
Figure 9.. Mboat7 knockdown promotes hepatic steatosis by altering the lipidome and proteome of the cytosolic lipid droplets.
Male C57BL/6 mice were fed either chow or a HFD for 12–20 weeks along with receiving a control non-targeting ASO or an ASO targeting the knockdown of Mboat7. (A) Mice were necropsied either in the fed or fasted (12 hr fast) state, and the hepatic expression of genes involved in lipogenesis, fatty acid oxidation, or sterol sensing analyzed using qPCR. (B) Plasma triglyceride (TG) secretion rate in mice administered Triton WR-1339 (tyloxapol). (C) Fed mice were treated with either saline vehicle or the β3-adrenergic receptor agonist CL316243 (0.1 mg/g body weight) to stimulate adipocyte lipolysis, and plasma glycerol and NEFA were measured after 15 min. Panels D–F), ASO-treated mice were fasted for 4 hr (from 9:00 a.m. to 1:00 p.m.) prior to necropsy, and hepatic lipid droplets were isolated using sucrose gradient fractionation to analyze both the lipidome and proteome of cytosolic lipid droplets. Lipid droplet fractions were extracted and analyzed by LC-MS/MS to quantify either lysophosphatidylinositol (D) or phosphatidylinositol (E) species on isolated lipid droplets. (F) Lipid droplet fractions were analyzed using Western blotting for MBOAT7, glycerol 3-phosphate dehydrogenase (as a non-lipid droplet fraction control), perilipin 2 (PLIN2), perilipin 3 (PLIN3), CTP:phosphocholine cytidylyltransferase α (CCTα), or glycerol-3-phosphate 4 (GPAT4); four individual mice per group are shown. Data are presented as mean ± S.E.M, (n = 4–6 per group; *p≤0.05, **p≤0.01, ***p≤0.001, ****p≤0.0001; Two-way ANOVA with Tukey’s post-hoc test).
Figure 10.
Figure 10.. Genetic deletion of MBOAT7 in Huh7 cells results in cell autonomous alterations in lipogenesis and fatty acid oxidation.
CRISPR-Cas9 gene editing was used to delete the MBOAT7 gene from Huh7 hepatoma cells: (A), Immunoblot confirmation of genetic deletion of MBOAT7 (MBOAT7Δ): Microsome were isolated from WT and MBOAT7Δcells, and MBOAT7 protein levels were detected via Western blotting. (B) Fluorescent microscopy image of control and MBOAT7Δ-Huh7 cells were supplemented with 400 µM oleic acid for 24 hr. Following 24 hr of lipid loading, cells were washed with PBS and stained with Bodipy (493/503). Scale bar = 10 µm. (C) Effect of MBOAT7Δ on de novo lipogenesis: Control and MBOAT7Δ-Huh7 cells were incubated [14C]acetate in the presence of broad lipase inhibitors. Cells were harvested at various time point, lipids extracted and the incorporation of [14C]acetate into [14C]triacylglycerol. (D) Effect of MBOAT7Δ on complete fatty acid oxidation: The graph shows the amount of 14C-palmitic acid oxidized to 14C-CO (Mancina et al., 2016). (E–F), Effect of MBOAT7Δ on triacylglycerol (E) and cholesterol ester (F) hydrolysis: Control and MBOAT7Δ-Huh7 cells were incubated with 100 µM oleate complexed to bovine serum albumin + 1 µCi[3H]-cholesterol + 0.5 µCi-[14C]-oleate for 24 hr to label cellular cholesteryl ester and triacylglycerol pools to steady state. The supplemental fatty acids were withdrawn, and the cells were incubated with 6 µM triacsin C to inhibit triacylglycerol synthesis and re-esterificaiton. Cells were harvested, lipids were extracted and separated by thin layer chromatography to determine the turnover of cholesteryl esters and triacylglycerols. Data shown are mean ± S.E.M. and are representative of two separate experiments; ***p<0.0002, ****p<0.0001; two-way ANOVA with Bonferroni’s multiple comparisons test.

Similar articles

Cited by

References

    1. Anderson KE, Kielkowska A, Durrant TN, Juvin V, Clark J, Stephens LR, Hawkins PT. Lysophosphatidylinositol-acyltransferase-1 (LPIAT1) is required to maintain physiological levels of PtdIns and PtdInsP(2) in the mouse. PLOS ONE. 2013;8:e58425. doi: 10.1371/journal.pone.0058425. - DOI - PMC - PubMed
    1. BasuRay S, Smagris E, Cohen JC, Hobbs HH. The PNPLA3 variant associated with fatty liver disease (I148M) accumulates on lipid droplets by evading ubiquitylation. Hepatology. 2017;66:1111–1124. doi: 10.1002/hep.29273. - DOI - PMC - PubMed
    1. BasuRay S, Wang Y, Smagris E, Cohen JC, Hobbs HH. Accumulation of PNPLA3 on lipid droplets is the basis of associated hepatic steatosis. PNAS. 2019;116:9521–9526. doi: 10.1073/pnas.1901974116. - DOI - PMC - PubMed
    1. Brasaemle DL, Rubin B, Harten IA, Gruia-Gray J, Kimmel AR, Londos C. Perilipin A increases triacylglycerol storage by decreasing the rate of triacylglycerol hydrolysis. Journal of Biological Chemistry. 2000;275:38486–38493. doi: 10.1074/jbc.M007322200. - DOI - PubMed
    1. Brown JM, Boysen MS, Jensen SS, Morrison RF, Storkson J, Lea-Currie R, Pariza M, Mandrup S, McIntosh MK. Isomer-specific regulation of metabolism and PPARgamma signaling by CLA in human preadipocytes. Journal of Lipid Research. 2003;44:1287–1300. doi: 10.1194/jlr.M300001-JLR200. - DOI - PMC - PubMed

Publication types

Associated data