. 2020 Apr;235(4):3950-3972.
doi: 10.1002/jcp.29290. Epub 2019 Oct 15.

Voltage-dependent activation of Rac1 by Nav 1.5 channels promotes cell migration

Affiliations

Voltage-dependent activation of Rac1 by Nav 1.5 channels promotes cell migration

Ming Yang et al. J Cell Physiol. 2020 Apr.

Abstract

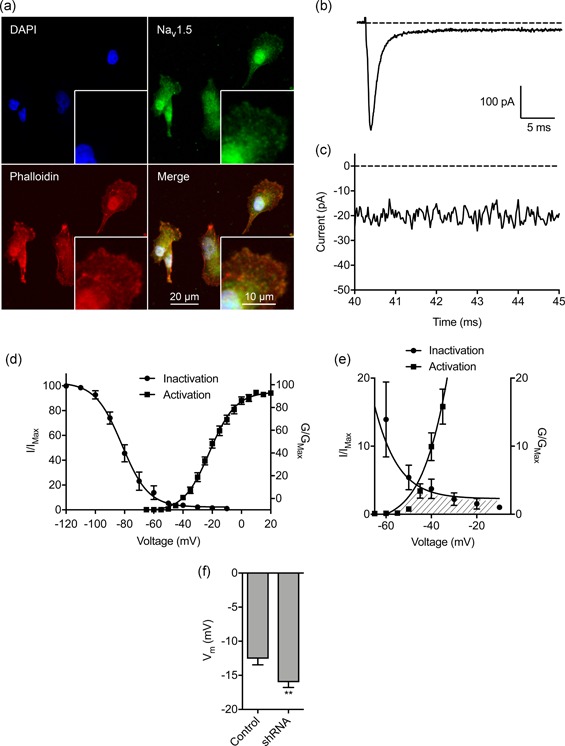
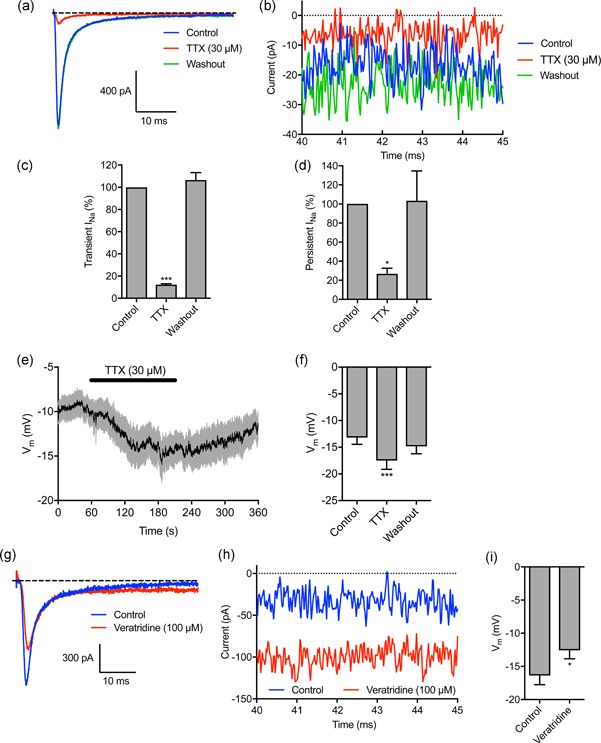
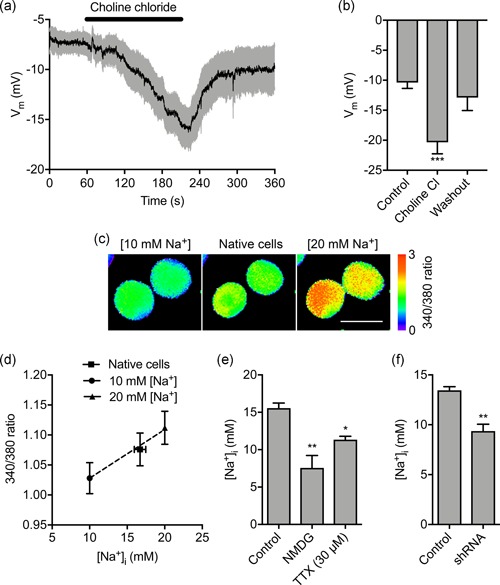
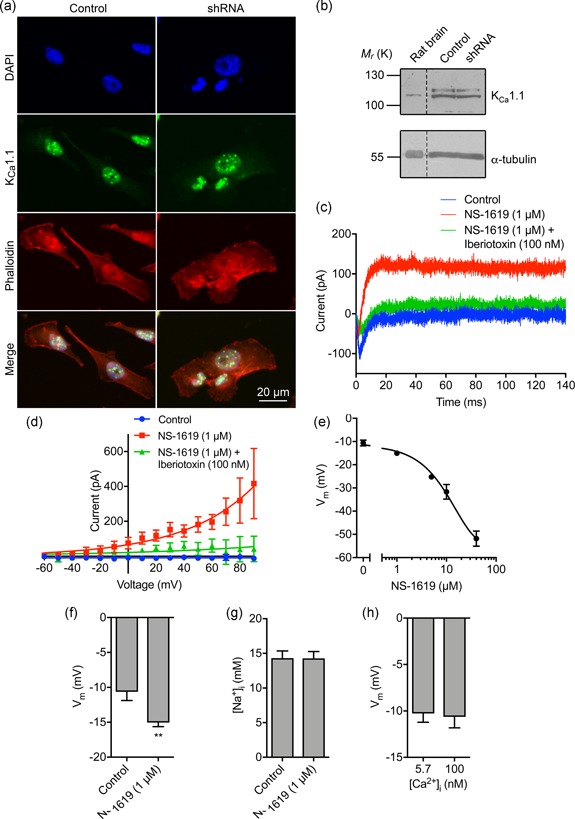
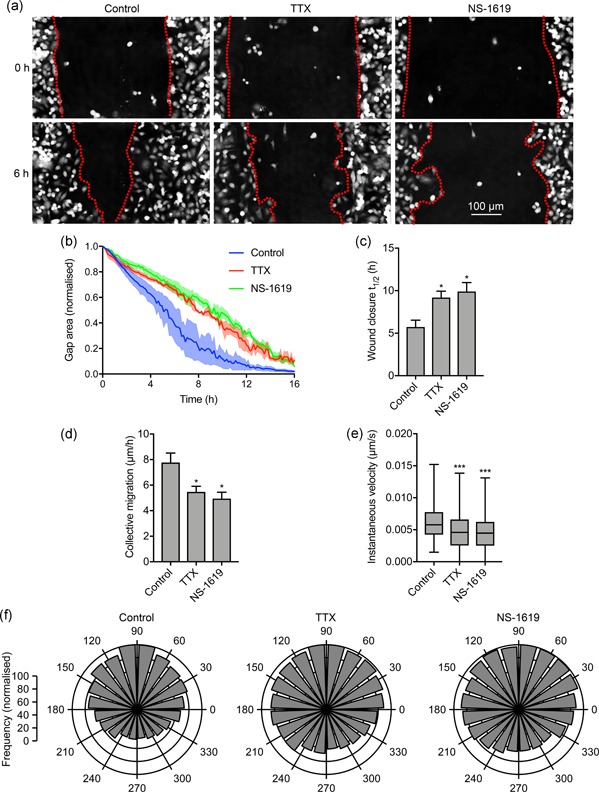
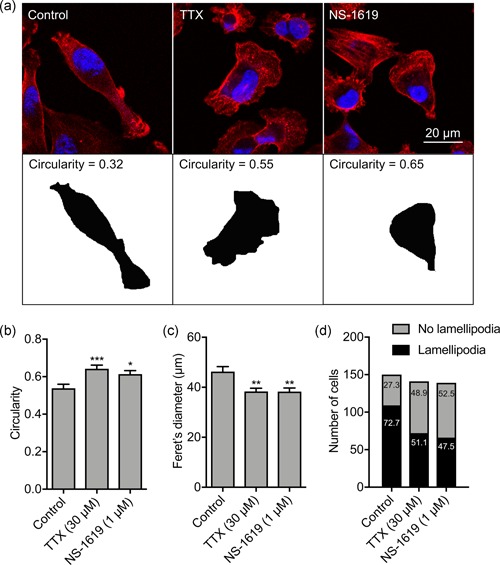
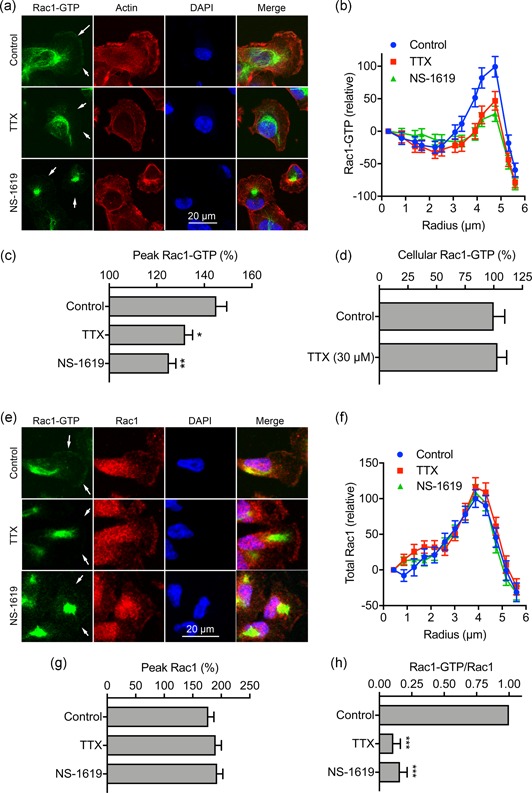
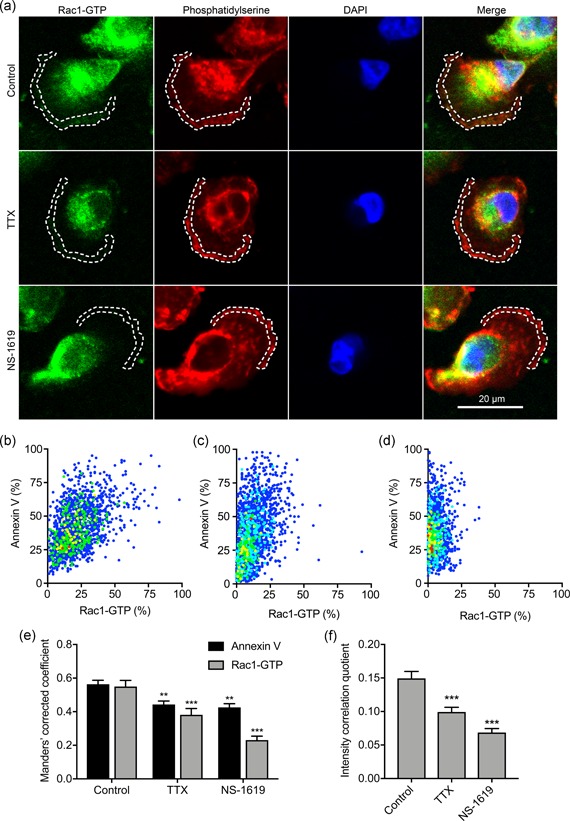
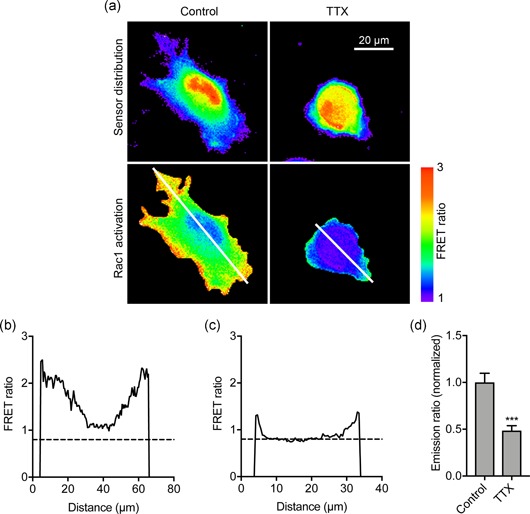
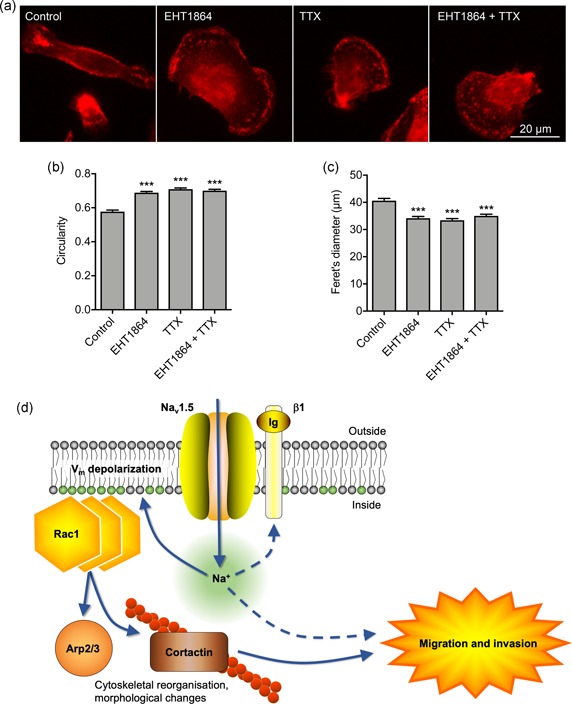
Ion channels can regulate the plasma membrane potential (Vm ) and cell migration as a result of altered ion flux. However, the mechanism by which Vm regulates motility remains unclear. Here, we show that the Nav 1.5 sodium channel carries persistent inward Na+ current which depolarizes the resting Vm at the timescale of minutes. This Nav 1.5-dependent Vm depolarization increases Rac1 colocalization with phosphatidylserine, to which it is anchored at the leading edge of migrating cells, promoting Rac1 activation. A genetically encoded FRET biosensor of Rac1 activation shows that depolarization-induced Rac1 activation results in acquisition of a motile phenotype. By identifying Nav 1.5-mediated Vm depolarization as a regulator of Rac1 activation, we link ionic and electrical signaling at the plasma membrane to small GTPase-dependent cytoskeletal reorganization and cellular migration. We uncover a novel and unexpected mechanism for Rac1 activation, which fine tunes cell migration in response to ionic and/or electric field changes in the local microenvironment.

Keywords: Nav1.5; Rac1; breast cancer; membrane potential; migration.


Conflict of interest statement

The authors declare that there are no conflict of interests.

Figures

Figure 1
Figure 1
Nav1.5 is endogenously expressed in breast carcinoma cells and regulates the membrane potential. (a) MDA‐MB‐231 cells labeled with Nav1.5 antibody (green), phalloidin to label the actin cytoskeleton (red), and DAPI to label the nucleus (blue). Insets show cell peripheries at higher magnification. (b) Typical whole‐cell recording showing large transient and small persistent Na+ current. The cell was depolarized to −10 mV for 50 ms following a 250 ms pre‐pulse at −120 mV. (c) Expanded view of persistent Na+ current 40–45 ms following onset of depolarization. (d) Activation and steady‐state inactivation of Na+ current. Normalized conductance (G/GMax) was calculated from the current data and plotted as a function of voltage (n = 14). Normalized current (I/IMax) was plotted as a function of the pre‐pulse voltage (n = 9). Data are fitted with Boltzmann functions. (e) Expanded view of shaded area under activation and inactivation traces highlighting the window current. (f) Effect of Nav1.5 shRNA knock‐down on the Vm compared to nontargeting shRNA control (n = 16). Data are mean and SEM. *p < .05; **p < .01; Student's t test. DAPI, 4',6‐diamidino‐2‐phenylindole; shRNA, short hairpin RNA
Figure 2
Figure 2
Tetrodotoxin hyperpolarizes, and veratridine depolarizes, the membrane potential. (a) Representative trace showing the inhibitory effect of tetrodotoxin (TTX; 30 µM) on Na+ current, and recovery after washout. The cell was held at −120 mV for 250 ms before depolarizing to −10 mV for 50 ms. (b) Expanded view of persistent Na+ current 40–45 ms following onset of depolarization. (c) Quantification of the normalized transient Na+ current after TTX (30 µM) treatment and following washout (n = 7). (d) Quantification of the normalized persistent Na+ current after TTX (30 µM) treatment and following washout (n = 4). (e) Vm in control physiological saline solution, after TTX (30 µM) treatment and following washout. Solid line, mean; gray shading, SEM (n = 17). (f) Quantification of Vm over the last 5 s in control, TTX, and washout (n = 17). (g) Representative trace showing effect of veratridine (100 µM) on Na+ current. The cell was held at −120 mV for 250 ms before depolarizing to 0 mV for 50 ms. (h) Expanded view of persistent Na+ current 40–45 ms following onset of depolarization. (i) Vm in control PSS and 120 s after perfusion with veratridine (n = 13). Data are mean and SEM. **p < .01; ***p < .001; repeated measures ANOVA with Tukey test for (c), (d), (f); Student's t test for (i). ANOVA, analysis of variance; PSS, physiological saline solution; SEM, standard error of mean
Figure 3
Figure 3
Extracellular Na+ sets the membrane potential and intracellular Na+ level. (a) Vm in control physiological saline solution, after extracellular Na+ replacement with choline chloride and following washout. Solid line, mean; gray shading, SEM (n = 10). (b) Quantification of Vm over the last 5 s in control, choline chloride, and washout (n = 10). (c) Representative SBFI fluorescence intensity (ratio of emission at 340 nm/380 nm) when cells were perfused with standard physiological saline (center panel), solution containing 10 mM Na+ and 20 μM gramicidin (left panel) and solution containing 20 mM Na+ and 20 μM gramicidin (right panel). Ratio images are color‐coded so that warm and cold colors represent high and low [Na+], respectively. Scale bar = 10 μm. (d) Calibration of relationship between SBFI fluorescence intensity (340/380 ratio) and [Na+]i. Dashed line, linear regression (r2 = 0.99; n = 40). (e) Quantification steady‐state [Na+]i in control physiological saline solution (n = 6), when extracellular Na+ was replaced with NMDG (n = 3), and in TTX (30 μM; n = 3). (f) Effect of Nav1.5 shRNA knock‐down on [Na+]i compared with nontargeting shRNA control (n = 3). Data are mean and SEM. *p < .05; **p < .01; ***p < .001; ANOVA with Tukey post hoc test for (a) and (e); Student's t test for (f). ANOVA, analysis of variance; NMDG, N‐methyl‐D‐glucamine; SEM, standard error of mean; shRNA, short hairpin RNA; TTX, tetrodotoxin
Figure 4
Figure 4
The large conductance Ca2+‐activated K+ channel KCa1.1 regulates the membrane potential but not intracellular Na+. (a) MDA‐MB‐231 cells labeled with KCa1.1 antibody (green), phalloidin to label the actin cytoskeleton (red), and DAPI to label the nucleus (blue). (b) Western blot of KCa1.1 in control MDA‐MB‐231 cells and cells in which Nav1.5 has been knocked down with shRNA. Positive control = rat brain lysate. Loading control = α‐tubulin. (c) Representative perforated patch clamp recording showing activation of outward current using the KCa1.1 activator (NS‐1619; 1 µM) and inhibition with iberiotoxin (100 nM). The cell was held at −120 mV for 250 ms before depolarization to + 60 mV for 300 ms. (d) Current–voltage relationship of the KCa1.1 current. Cells were held at −120 mV for 250 ms before depolarization to voltages ranging from −60 to +90 mV in 10 mV steps for 300 ms (n = 5). Data are fitted with single exponential functions. (e) Dose‐dependent effect of NS‐1619 on the steady‐state Vm (n ≥ 6). Data are fitted to a sigmoidal logistic function. (f) Effect of NS‐1619 (1 µM) on steady‐state Vm (n = 12). (g) Effect of NS‐1619 (1 µM, 5 min) on [Na+]i (n = 22). (h) Vm recorded using intracellular solution with free [Ca2+] buffered to 5.7 nM versus 100 nM (n ≥ 10). Data are mean and SEM. **p < .01; Student's paired t test. DAPI, 4',6‐diamidino‐2‐phenylindole; shRNA, short hairpin RNA
Figure 5
Figure 5
Nav1.5‐dependent membrane potential depolarization regulates cell migration. (a) Representative scratch wounds at 0 hr and 6 hr into a wound healing assay ± TTX (30 μM) or NS‐1619 (1 μM). Red dotted lines highlight wound edges. (b) Wound area during the migration assay (“gap remaining”), normalized to starting value (n = 3). (c) t 1/2 of wound closure (n ≥ 5). (d) Collective migration (µm/hr) of cells closing the wound (n ≥ 5). (e) Instantaneous velocity (µm/s) of segmented cells (n ≥ 2,662). (f) Polar histograms showing directionality of migrating cells at the leading edge of wounds (p < .001; Friedman with Dunn's test). 90˚ =  axis perpendicular to wound. Data in (b–d) are mean and SEM. Box plot whiskers in (e) show maximum and minimum values and horizontal lines show 75th, 50th, and 25th percentile values. *p < .05; **p < .01; ***p < .001; ANOVA with Tukey test (c, d); Kruskal–Wallis with Dunn's test (e). ANOVA, analysis of variance; SEM, standard error of mean; TTX, tetrodotoxin
Figure 6
Figure 6
Nav1.5‐dependent membrane potential depolarization regulates lamellipodia formation. (a) Images of representative cells after treatment with TTX (30 μM) or NS‐1619 (1 μM) for 3 hr. Cells were fixed and stained with phalloidin (red) and DAPI (blue). Lower row shows masks of cells in the upper row, from which the circularity was calculated. (b) Circularity (n ≥ 61). (c) Feret's diameter (µm; n ≥ 57). (d) Number of MDA‐MB‐231 cells with a lamellipodium (p < .001; χ 2 test). Numbers in bars are %. Bars in (b) and (c) are mean and SEM. *p < .05; **p < .01; ***p < .001; ANOVA with Tukey test. ANOVA, analysis of variance; DAPI, 4',6‐diamidino‐2‐phenylindole; SEM, standard error of mean; TTX, tetrodotoxin
Figure 7
Figure 7
Nav1.5 and Vm regulate Rac1 activation/distribution. (a) Images of representative cells after treatment with TTX (30 µM) and NS‐1619 (1 µM) for 3 hr. Cells were labeled with Rac1‐GTP antibody (green), phalloidin (red), and DAPI (blue). Arrows in the Rac1‐GTP panels highlight the distribution or lack of expression at the leading edge. (b) Rac1‐GTP signal density, measured across 20 arcs, in 0.43 µm radius increments, within a quadrant mask region of interest at the leading edge, normalized to the first arc (n ≥ 66). (c) Peak Rac1‐GTP signal density per cell from (b), normalized to the first arc (n ≥ 66). (d) Total Rac1‐GTP quantified in whole‐cell lysates using colorimetric small GTPase activation assay (n = 6). (e) Images of representative cells after treatment with TTX (30 µM) and NS‐1619 (1 µM) for 3 hr. Cells were labeled with Rac1‐GTP antibody (green), total Rac1 antibody (red), and DAPI (blue). Arrows in the Rac1‐GTP panels highlight the distribution or lack of expression at the leading edge. (f) Total Rac1 signal density, measured across 20 arcs, in 0.43 µm radius increments, within a quadrant mask region of interest at the leading edge, normalized to the first arc (n ≥ 59). (g) Peak Rac1 signal density per cell from (f), normalized to the first arc (n ≥ 59). (h) Ratio of Peak Rac1‐GTP/Peak total Rac1 for each experimental repeat, normalized to control (n = 3). Data are mean and SEM. *p < .05; **p < .01; ***p < .001; ANOVA with Tukey test. ANOVA, analysis of variance; DAPI, 4',6‐diamidino‐2‐phenylindole; SEM, standard error of mean; TTX, tetrodotoxin
Figure 8
Figure 8
Nav1.5 and Vm regulate Rac1‐GTP colocalization with phosphatidylserine. (a) Images of representative cells after treatment with TTX (30 µM) and NS‐1619 (1 µM) for 3 hr. Cells were labeled with Rac1‐GTP antibody (green), annexin V (red), and DAPI (blue). Dashed lines highlight regions of interest at the leading edge. (b) Cytofluorogram showing colocalization of annexin V and Rac1‐GTP staining in region of interest in control cell from (a), normalized to maximum in each channel. (c) Cytofluorogram showing colocalization of annexin V and Rac1‐GTP staining in region of interest in TTX cell from (a), normalized to maximum in each channel. (d) Cytofluorogram showing colocalization of annexin V and Rac1‐GTP staining in region of interest in NS‐1619 cell from (a), normalized to maximum in each channel. (e) Manders' corrected colocalization coefficients for annexin V and Rac1‐GTP staining in regions of interest of cells after treatment with TTX (30 µM) and NS‐1619 (1 µM) for 3 hr (n = 30). (f) Li's intensity correlation quotient for Rac1‐GTP and annexin V colocalization (n = 30). Data are mean and SEM. **p < .01; ***p < .001; ANOVA with Tukey test. ANOVA, analysis of variance; DAPI, 4',6‐diamidino‐2‐phenylindole; SEM, standard error of mean; TTX, tetrodotoxin
Figure 9
Figure 9
Nav1.5 regulates Rac1 activation in live cells detected using a genetically encoded Rac1 FRET biosensor. (a) Images of representative cells after treatment ± TTX (30 µM) for 3 hr. Rac1 activation biosensor distribution is shown in the donor (mTFP) channel. Images are color‐coded so that warm and cold colors represent high and low values, respectively, for sensor distribution and activation (FRET). (b) Fluorescence intensity profile along line drawn across control cell in (a). (c) Fluorescence intensity profile along line drawn across TTX‐treated cell in (a). (d) Emission ratio (FRET), for cells measured after treatment ± TTX (30 µM) for 3 hr, normalized to control (n ≥ 33). Data are mean and SEM. **p < .01; Student's t test. TTX, tetrodotoxin
Figure 10
Figure 10
Nav1.5‐mediated morphological changes and migration are dependent on Rac1 activation. (a) Images of representative cells after treatment with TTX (30 µM) ± Rac1 inhibitor (EHT1864; 0.5 µM) for 3 hr. Cells are labeled with CD44 antibody (red). (b) Circularity of cells after treatment with TTX (30 µM) ± EHT1864 (0.5 µM) for 3 hr (n ≥ 308). (c) Feret's diameter (µm) of cells after treatment with TTX (30 µM) ± EHT1864 (0.5 µM) for 3 hr (n ≥ 308). Data are mean and SEM. ***p < .001; ANOVA with Tukey test. (d) Proposed mechanism underlying Nav1.5‐mediated Vm‐dependent morphological changes and migration. Nav1.5 channels carry Na+ influx, which depolarizes the Vm, causing redistribution of charged phosphatidylserine in the inner leaflet of the phospholipid bilayer, promoting Rac1 redistribution and activation. Rac1 regulates cytoskeletal modification via the Arp2/3 complex and increasing phosphorylation of cortactin and cofilin, promoting acquisition of a promigratory phenotype (Pollard, 2007; Stock & Schwab, 2015). Na+ influx through Nav1.5 channels may also impact on migration and invasion through other mechanism(s), including via β1 subunit‐dependent adhesion (Brisson et al., 2013; House et al., 2010, 2015; Nelson et al., 2014). ANOVA, analysis of variance; TTX, tetrodotoxin

Similar articles

Cited by

References

    1. Amara, S. , Ivy, M. T. , Myles, E. L. , & Tiriveedhi, V. (2016). Sodium channel γENaC mediates IL‐17 synergized high salt induced inflammatory stress in breast cancer cells. Cellular Immunology, 302, 1–10. 10.1016/j.cellimm.2015.12.007 - DOI - PMC - PubMed
    1. Antonov, A. S. , Antonova, G. N. , Fujii, M. , ten Dijke, P. , Handa, V. , Catravas, J. D. , & Verin, A. D. (2012). Regulation of endothelial barrier function by TGF‐β type I receptor ALK5: Potential role of contractile mechanisms and heat shock protein 90. Journal of Cellular Physiology, 227(2), 759–771. 10.1002/jcp.22785 - DOI - PMC - PubMed
    1. Armstrong, C. M. , & Bezanilla, F. (1977). Inactivation of the sodium channel. II. Gating current experiments. The Journal of General Physiology, 70(5), 567–590. - PMC - PubMed
    1. Baldassa, S. , Zippel, R. , & Sturani, E. (2003). Depolarization‐induced signaling to Ras, Rap1 and MAPKs in cortical neurons. Brain Research: Molecular Brain Research, 119(1), 111–122. - PubMed
    1. Baylor, D. A. , & Fettiplace, R. (1977). Transmission from photoreceptors to ganglion cells in turtle retina. Journal of Physiology, 271(2), 391–424. - PMC - PubMed

Publication types

MeSH terms