. 2019 Dec 12;94(1):e00999-19.
doi: 10.1128/JVI.00999-19. Print 2019 Dec 12.

Differential Modulation of Innate Immune Responses in Human Primary Cells by Influenza A Viruses Carrying Human or Avian Nonstructural Protein 1

Affiliations

Differential Modulation of Innate Immune Responses in Human Primary Cells by Influenza A Viruses Carrying Human or Avian Nonstructural Protein 1

Paula L Monteagudo et al. J Virol. .

Abstract

The influenza A virus (IAV) nonstructural protein 1 (NS1) contributes to disease pathogenesis through the inhibition of host innate immune responses. Dendritic cells (DCs) release interferons (IFNs) and proinflammatory cytokines and promote adaptive immunity upon viral infection. In order to characterize the strain-specific effects of IAV NS1 on human DC activation, we infected human DCs with a panel of recombinant viruses with the same backbone (A/Puerto Rico/08/1934) expressing different NS1 proteins from human and avian origin. We found that these viruses induced a clearly distinct phenotype in DCs. Specifically, viruses expressing NS1 from human IAV (either H1N1 or H3N2) induced higher levels of expression of type I (IFN-α and IFN-β) and type III (IFN-λ1 to IFNλ3) IFNs than viruses expressing avian IAV NS1 proteins (H5N1, H7N9, and H7N2), but the differences observed in the expression levels of proinflammatory cytokines like tumor necrosis factor alpha (TNF-α) or interleukin-6 (IL-6) were not significant. In addition, using imaging flow cytometry, we found that human and avian NS1 proteins segregate based on their subcellular trafficking dynamics, which might be associated with the different innate immune profile induced in DCs by viruses expressing those NS1 proteins. Innate immune responses induced by our panel of IAV recombinant viruses were also characterized in normal human bronchial epithelial cells, and the results were consistent with those in DCs. Altogether, our results reveal an increased ability of NS1 from avian viruses to antagonize innate immune responses in human primary cells compared to the ability of NS1 from human viruses, which could contribute to the severe disease induced by avian IAV in humans.IMPORTANCE Influenza A viruses (IAVs) cause seasonal epidemics which result in an important health and economic burden. Wild aquatic birds are the natural host of IAV. However, IAV can infect diverse hosts, including humans, domestic poultry, pigs, and others. IAVs circulating in animals occasionally cross the species barrier, infecting humans, which results in mild to very severe disease. In some cases, these viruses can acquire the ability to be transmitted among humans and initiate a pandemic. The nonstructural 1 (NS1) protein of IAV is an important antagonist of the innate immune response. In this study, using recombinant viruses and primary human cells, we show that NS1 proteins from human and avian hosts show intrinsic differences in the modulation of the innate immunity in human dendritic cells and epithelial cells, as well as different cellular localization dynamics in infected cells.

Keywords: NS1 protein; dendritic cells; epithelial cells; influenza; innate immunity; interferons.


Figures

FIG 1
FIG 1
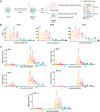
Generation and selection of PR8 recombinant viruses expressing different NS1 proteins. (A) Schematic representation of PR8 recombinant viruses (7:1) bearing NS1 proteins from different origins (PR8-NS1) and representation of the wild-type (WT) segments of eight of influenza A vRNAs which encode two proteins (NS1 and NEP) and modified segment eight encoding separated reading frames (PR8-Split). (B) Selection of PR8-NS1 viruses of interest. (C) Neighbor joining phylogenetic tree of a selection of 58 NS1 amino acid sequences representative of the global diversity of NS1 proteins from influenza A viruses. Sequences used in this study are shown in red. (D) Multicycle replication kinetics of PR8-Split and PR8-WT or PR8-Split and PR8-NS1 viruses in A549 cells. Cells were infected at an MOI of 0.1 with the indicated virus, and supernatants were harvested at various time points for plaque assay titration. Data points show mean values (n = 3), and error bars represent standard deviations. (E) Impact of hNS1 and aNS1 proteins on IFN-β induction in human cells. 293T cells were cotransfected with pDZ plasmid encoding the indicated NS1 protein (or empty vector), together with a firefly luciferase (FF-Luc) IFN-β promoter reporter plasmid (p125Luc) and a herpes simplex virus-thymidine kinase promoter-driven Renilla luciferase (Ren-Luc) plasmid. At 24 h posttransfection, cells were infected with a DI-rich SeV preparation for 16 h. Relative FF-Luc activity was normalized to the level of the empty vector plus SeV (set to 100%).
FIG 2
FIG 2
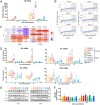
Differential IFN responses induced by recombinant viruses expressing NS1 proteins from human or avian IAVs in primary human DCs. (A) Experimental design created with BioRender. WB, Western blotting. (B) Levels of type I IFN (IFN-α and IFN-β) and type III IFN (IFN-λ1) protein detected in supernatants of infected cells by multiplex ELISA at 12 hpi. (C) Analysis of the expression levels of mRNAs for type I IFN (IFN-α and IFN-β) and type III IFN (IFN-λ1, IFN-λ2, and IFN-λ3) at 6 and 12 hpi, normalized to the level of the housekeeping gene (RPS11) by qRT-PCR. DCs were infected at an MOI of 1 independently with 8 different recombinant viruses. Data from 6 to 8 infected donors are shown. Statistical significance was determined using two-way ANOVA followed by a Tukey’s test for multiple comparisons. Adjusted P values are indicated as follows: ****, <0.0001; ***, <0.001; **, <0.01; *, <0.1.
FIG 3
FIG 3
Similar proinflammatory responses induced by recombinant viruses expressing NS1 proteins from human or avian IAVs in primary human DCs. (A) Levels of IL-6, TNF-α, and IL-1β protein detected in supernatants of infected cells by multiplex ELISA at 12 hpi. (B) Analysis of the expression of mRNA levels for IL-6 and TNF-α at 6 and 12 hpi normalized to the level of RPS11 by qRT-PCR. DCs were infected at an MOI of 1 independently with 8 different recombinant viruses. Data from 7 to 8 different infected donors are shown. Statistical significance was determined using two-way ANOVA, followed by Tukey’s test for multiple comparisons. Adjusted P values are indicated as follows: ****, <0.0001; ***, <0.001; **, <0.01; *, <0.1.
FIG 4
FIG 4
Characterization of recombinant IAVs expressing NS1 proteins from human or avian viruses in primary human DCs. (A) Expression of vRNA levels for NP at 6 and 12 hpi by qRT-PCR. (B) Analysis of the correlation between levels of intracellular vRNA and IFN induction across all the samples from 5 donors (individual viruses are indicated with differently colored data points). The blue line indicates the linear regression model fit to the observed data, and the shadow indicates the 95% confidence interval for predictions from that linear model. Pearson’s coefficient (r) and the P value for the correlation (P) are shown in each plot. (C) Heat maps showing the correlation between vRNA levels and IFN induction for samples from different infected donors. Color scale indicates the Pearson’s correlation coefficient (r), and labels in the heat map cells indicate the P value for that correlation. (D) Analysis of the expression of mRNA levels for NP, M1, HA, and NEP at 6 and 12 hpi by qRT-PCR. (E) Expression of viral PB2, NP, and NS1 protein levels and β-actin in infected DCs at 6 and 12 hpi by Western blotting of samples from one representative donor of three independent experiments with different donors. (F) MFIs for NS1 proteins in infected DCs at 6 and 12 hpi are shown. Bars represent means ± standard deviations of four different donors. Statistical significance (A, D, and F) was determined using two-way ANOVA followed by Tukey’s test for multiple comparisons. Adjusted P values are as indicated follows: ****, <0.0001; ***, <0.001; **, <0.01; *, <0.1.
FIG 5
FIG 5
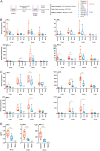
Differential immune responses induced by recombinant viruses expressing NS1 proteins from human or avian IAVs in primary NHBE cells. (A) Experimental design created with Biorender. (B) Analysis of the expression of mRNA levels for type I IFN (IFN-α and IFN-β) and type III IFN (IFN-λ1 and IFN-λ3). (C) ISG IRF7 and IFIT1 levels at different time points by qRT-PCR. (D) Levels of type I IFN (IFN-α and IFN-β) and type III IFN (IFN-λ1) protein detected in bottom chambers of infected cells by multiplex ELISA at 48 hpi. Data were grouped as human or avian depending the origin of the NS1 proteins carried by the viruses. Data from 3 biological replicates for each virus are shown (dots); each column represents the mean of the group with the corresponding standard error of the mean. Statistical significance was determined using a t test. P values are as indicated follows: ****, <0.0001; ***. <0.001; **, <0.01; *, <0.1.
FIG 6
FIG 6
Chemokines and proinflammatory responses induced by recombinant viruses expressing NS1 proteins from human or avian IAVs in primary NHBE cells. (A and B) Analysis of the mRNA expression levels for chemokines IP-10 and RANTES and proinflammatory cytokines IL-6 and TNF-α, as indicated, at different time points, normalized to the level of a housekeeping gene by qRT-PCR. (C) Levels of IP-10 protein detected in bottom chambers of infected NHBE cells by multiplex ELISA at 48 hpi. Data were grouped as human or avian depending the origin of the NS1 protein carried by the virus. Data from 3 biological replicates for each virus are shown (dots); each column represents the mean of the group with the corresponding standard error of the means. Statistical significance was determined using the t test. P values are indicated as follows: ****, <0.0001; ***, <0.001; **, <0.01; *, <0.1.
FIG 7
FIG 7
Characterization of recombinant IAVs expressing NS1 proteins from human or avian viruses in primary NHBE cells. (A) Analysis of multicycle replication kinetics of the recombinant viruses in NHBE cells infected at an MOI of 0.2 with the indicated virus as measured by plaque assay. Data points show mean values of 3 biological replicates, and error bars represent standard errors of the means. (B) Expression levels of mRNAs for NP, M1, NEP, and HA in infected NHBE cells at different time points by qRT-PCR. Data were grouped as human or avian depending the origin of the NS1 proteins carried by the viruses. Each column represents the mean of the group (n = 3) with the corresponding standard error of the means. Statistical significance was determined using a t test. P values are indicated as follows: ****, <0.001; ***, <0.001; **, <0.01; *, <0.1.
FIG 8
FIG 8
Multiple sequence alignment of full-length NS1 proteins from IAVs. (A) Schematic representation of an NS1 monomer with the two functionally different domains, the N-terminal RNA binding domain and the C-terminal the effector domain, separated by a short linker region. The last residues of the C terminus form a tail. The NS1 protein is 218 to 237 amino acids long depending upon the strain. (B) Amino acid sequence alignment of the NS1 proteins from IAVs included in this study: A/Memphis/19/1983 (H1N1), A/California/07/2009 (H1N1), A/Peru271/2011 (H3N2), A/Udorn/1972 (H3N2), A/chicken/Moscow/2/2007 (H5N1), A/Vietnam/277/2007 (H5N1), A/duck/Tasmania/277/2007 (H7N2), and A/Shanghai/02/2003 (H7N9). Identity (·) and amino acid changes between strains are indicated. Blue shading highlights NLS1, green shading indicates the NES, and pink shading indicates NLS2. Black boxes indicate residues that are different between human and avian proteins and common in at least 3 out of 4 sequences.
FIG 9
FIG 9
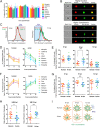
hNS1 and aNS1 have different kinetics of nuclear export during primary human DC infection. (A) Infectivity in DCs measured as the percentage of M1/2-positive cells (MOI of 1 PFU/cell). Cells were stained, fixed, permeabilized, and stained with M1/2 E10-PacBlue, NS1-AF488, and a nuclear marker (DRAQ5). Images were obtained using an ImageStream instrument (Amnis). In order to quantify the localization of NS1-AF488 in the nucleus for each cell, a bright detail similarity (BDS) score was calculated between the images (NS1 nuclear localization score; see Materials and Methods). (B) Representative images of cells in which NS1 is localized mainly in the nucleus (highly nuclear) or in the cytoplasm (highly cytoplasmic). (C) Representative histograms. (D to G) Percentage of infected cells with highly nuclear or cytoplasmic localization per virus (D and F) or per time point (E and G), grouped by avian or human strains. (H) Rate of export to the cytoplasm (percent change per hour) for human and avian strains from 6 to 9 hpi and for 9 to 12 hpi. *, P < 0.05; **, P < 0.01. (I) Working model. NS1 localization (in green) during time.

Similar articles

Cited by

References

    1. Iwasaki A, Pillai PS. 2014. Innate immunity to influenza virus infection. Nat Rev Immunol 14:315–328. doi:10.1038/nri3665. - DOI - PMC - PubMed
    1. Guillot L, Le Goffic R, Bloch S, Escriou N, Akira S, Chignard M, Si-Tahar M. 2005. Involvement of toll-like receptor 3 in the immune response of lung epithelial cells to double-stranded RNA and influenza A virus. J Biol Chem 280:5571–5580. doi:10.1074/jbc.M410592200. - DOI - PubMed
    1. Lund JM, Alexopoulou L, Sato A, Karow M, Adams NC, Gale NW, Iwasaki A, Flavell RA. 2004. Recognition of single-stranded RNA viruses by Toll-like receptor 7. Proc Natl Acad Sci U S A 101:5598–5603. doi:10.1073/pnas.0400937101. - DOI - PMC - PubMed
    1. Pandey GN, Rizavi HS, Ren X, Bhaumik R, Dwivedi Y. 2014. Toll-like receptors in the depressed and suicide brain. J Psychiatr Res 53:62–68. doi:10.1016/j.jpsychires.2014.01.021. - DOI - PMC - PubMed
    1. Rehwinkel J, Tan CP, Goubau D, Schulz O, Pichlmair A, Bier K, Robb N, Vreede F, Barclay W, Fodor E, Reis e Sousa C. 2010. RIG-I detects viral genomic RNA during negative-strand RNA virus infection. Cell 140:397–408. doi:10.1016/j.cell.2010.01.020. - DOI - PubMed

Publication types

MeSH terms