. 2019 Nov 20;39(47):9306-9315.
doi: 10.1523/JNEUROSCI.1566-19.2019. Epub 2019 Oct 9.

Tiam1 is Critical for Glutamatergic Synapse Structure and Function in the Hippocampus

Affiliations

Tiam1 is Critical for Glutamatergic Synapse Structure and Function in the Hippocampus

Sadhna Rao et al. J Neurosci. .

Abstract

Mounting evidence suggests numerous glutamatergic synapse subtypes exist in the brain, and that these subtypes are likely defined by unique molecular regulatory mechanisms. Recent work has identified substantial divergence of molecular composition between commonly studied Schaffer collateral synapses and perforant path-dentate gyrus (DG) synapses of the hippocampus. However, little is known about the molecular mechanisms that may confer unique properties to perforant path-DG synapses. Here we investigate whether the RhoGEF (Rho guanine-nucleotide exchange factor) protein Tiam1 plays a unique role in the regulation of glutamatergic synapses in dentate granule neurons using a combination of molecular, electrophysiological, and imaging approaches in rat entorhino-hippocampal slices of both sexes. We find that inhibition of Tiam1 function in dentate granule neurons reduces synaptic AMPA receptor function and causes dendritic spines to adopt an elongated filopodia-like morphology. We also find that Tiam1's support of perforant path-DG synapse function is dependent on its GEF domain and identify a potential role for the auto-inhibitory PH domain of Tiam1 in regulating Tiam1 function at these synapses. In marked contrast, reduced Tiam1 expression in CA1 pyramidal neurons produced no effect on glutamatergic synapse development. Together, these data identify a critical role for Tiam1 in the hippocampus and reveal a unique Tiam1-mediated molecular program of glutamatergic synapse regulation in dentate granule neurons.SIGNIFICANCE STATEMENT Several lines of evidence independently point to the molecular diversity of glutamatergic synapses in the brain. Rho guanine-nucleotide exchange factor (RhoGEF) proteins as powerful modulators of glutamatergic synapse function have also become increasingly appreciated in recent years. Here we investigate the synaptic regulatory role of the RhoGEF protein Tiam1, whose expression appears to be remarkably enriched in granule neurons of the dentate gyrus. We find that Tiam1 plays a critical role in the development of glutamatergic perforant path-dentate gyrus synapses, but not in commonly studied in Schaffer collateral-CA1 synapses. Together, these data reveal a unique RhoGEF-mediated molecular program of glutamatergic synapse regulation in dentate granule neurons.

Keywords: RhoGEF; Tiam1; dentate gyrus; hippocampus; maturation; synapse.


Figures

Figure 1.
Figure 1.
Tiam1 knockdown reduces AMPAR-mediated neurotransmission in DG granule neurons. A, Hippocampal Tiam1 mRNA expression data from the Allen Mouse Brain Atlas. Scale bar, 200 μm. B, Tiam1 RNA sequencing data in CA1 and CA3 pyramidal neurons and DG granule neurons from the Hipposeq RNA-seq database. **p < 0.01, one-way ANOVA with post hoc Tukey HSD. C, Immunolabeling of Prox1 and Tiam1 in DG granule neurons in hippocampal slices. GL, granule layer; ML, molecular layer. D, Western blot showing shRNA-mediated reduction of Tiam1 expression in HEK293 cells (top) and hippocampal neurons (bottom). E, Schematic representation of electrophysiological recording setup for DG granule neurons. F, G, Scatterplots show eEPSC amplitudes for pairs of untransfected and transfected cells (open circles) with corresponding mean ± SEM (filled circles). Insets, Representative current traces from control and transfected (green) neurons with stimulation artifacts removed. Calibration: 20 pA for both AMPAR-eEPSC and NMDAR-eEPSC, 20 ms for AMPAR-eEPSC, 50 ms for NMDAR-eEPSC. Barplots show the average AMPAR-eEPSC and NMDAR-eEPSC amplitudes (±SEM) of DG granule neurons expressing Tiam1 shRNA normalized to their respective control cell average eEPSC amplitudes. Tiam1 shRNA expression decreases AMPAR-eEPSC amplitude in DG granule neurons (n = 12 pairs) but has no detectable effect on NMDAR-eEPSC amplitude (n = 12 pairs). ***p < 0.001; . n.s., Not significant, Wilcoxon signed-rank test. H, Paired-pulse facilitation ratios (mean ± SEM) for Tiam1 shRNA expressing DG granule neurons and paired control neurons with no detectable difference in facilitation (n = 7 pairs). n.s., Not significant, Student's t test. Representative scaled current traces from control and transfected (green) neurons. Calibration: 20 pA, 20 ms. I, Coefficient of variation analysis of AMPAR-eEPSCs from pairs of control and Tiam1 shRNA expressing DG granule neurons. CV−2 values are plotted against corresponding ratios of mean amplitudes within each pair (open circles) with mean ± SEM (filled circle). Red line represents “best-fit” linear regression, and gray-shaded area indicates 95% confidence interval for regression (n = 12 pairs). J, Failure analysis of AMPAR-eEPSCs from pairs of control and Tiam1 shRNA-expressing DG granule neurons with DG granule neurons exhibiting higher failure rates than control neurons (n = 12 pairs). **p < 0.01, Wilcoxon signed-rank test.
Figure 2.
Figure 2.
Tiam1 knockdown does not affect AMPAR- or NMDAR-mediated neurotransmission in CA1 pyramidal neurons. A, Hippocampal Tiam1 mRNA expression data from the Allen Mouse Brain Atlas. Scale bar, 200 μm. Dashed blue box shows enlarged CA1 region. B, Immunolabeling of Tiam1 in CA1 pyramidal neurons (top) and DG granule neurons (bottom) in hippocampal slices. SP, stratum pyramidale; SR, stratum radiatum; GL, granule layer; ML, molecular layer. C, Schematic representation of electrophysiological recording setup for CA1 pyramidal neurons. D, E, Scatterplots show eEPSC amplitudes for pairs of untransfected and transfected cells (open circles) with corresponding mean ± SEM (filled circles). Insets, Representative current traces from control and transfected (green) neurons with stimulation artifacts removed. Calibration: 20 pA for both AMPAR-eEPSC and NMDAR-eEPSC, 20 ms for AMPAR-eEPSC, 50 ms for NMDAR-eEPSC. Barplots show the average AMPAR-eEPSC and NMDAR-eEPSC amplitudes (±SEM) of CA1 pyramidal neurons expressing Tiam1 shRNA normalized to their respective control cell average eEPSC amplitudes. Tiam1 shRNA expression did not significantly affect AMPAR-eEPSC amplitude (n = 9 pairs) or NMDAR-eEPSC amplitude (n = 8 pairs) in CA1 pyramidal neurons. n.s., Not significant, Wilcoxon signed-rank test.
Figure 3.
Figure 3.
Tiam1 knockdown increases dendritic spine length in DG granule neurons, but not in CA1 pyramidal neurons. A, D, Schematic representation of areas of image acquisition from DG granule neuron dendrites and apical CA1 pyramidal neuron dendrites, respectively. B, E, Representative dendritic segments and corresponding reconstructed segments from GFP and Tiam1 shRNA-expressing DG granule neurons and CA1 pyramidal neurons. Scale bars, 4 μm. C, F, Boxplots show significant differences in spine length and spine neck length in DG granule neurons expressing Tiam1 shRNA (colored boxes) compared with GFP-expressing control neurons (gray boxes; p = 0.00024 for spine length; p = 0.0014 for spine neck length; for GFP, n = 19 segments; for Tiam1 shRNA, n = 17 segments), no significant differences in head volume or spine density were detected (p = 0.9 for head volume; p = 0.6 for spine density; for GFP, n = 19 segments; for Tiam1 shRNA, n = 17 segments). No significant differences were detected in any spine parameters in Tiam1 shRNA-expressing spines in CA1 pyramidal neurons compared with corresponding GFP-expressing control neurons (for GFP, n = 12 segments; for Tiam1 shRNA, n = 25 segments; p = 0.26 for spine length; p = 0.55 for spine neck length; p = 0.17 for head volume; p = 0.7 for spine density; Wilcoxon rank-sum test) ***p < 0.001, **p < 0.01, Wilcoxon rank-sum test. n.s., Not significant.
Figure 4.
Figure 4.
Full-length Tiam1 but not Tiam1 ΔDH expression rescues Tiam1 shRNA-mediated effects on glutamatergic synapses of DG granule neurons. A, B, Scatterplots with AMPAR-eEPSC and NMDAR-eEPSC amplitudes for DG granule neurons coexpressing Tiam1 shRNA and Tiam1 ΔDH, respectively, plotted against paired control neuron eEPSCs (open circles) with corresponding mean ± SEM (filled circles). Barplots show average AMPAR-eEPSC and NMDAR-eEPSC amplitudes (±SEM) of DG granule neurons expressing Tiam1 shRNA (gray bars) and DG granule neurons coexpressing Tiam1 shRNA, Tiam1 cDNA (yellow bars), and Tiam1 ΔDH (blue bars) normalized to respective control cell average eEPSC amplitudes (black bar). ***p < 0.001, *p < 0.05, Wilcoxon signed-rank test. A, Tiam1 cDNA expression restores AMPAR-eEPSC amplitude in DG granule neurons coexpressing Tiam1 shRNA (n = 10 pairs). Inset, Representative current traces from control and transfected (yellow) neurons stimulation artifacts removed. Calibration: 20 pA, 20 ms for AMPAR-eEPSC. B, Tiam1 ΔDH expression does not restore AMPAR-eEPSC (p = 0.02148, n = 13 pairs, Wilcoxon signed-rank test) and has no significant effect on NMDAR-eEPSC amplitudes in DG granule neurons coexpressing Tiam1 shRNA (p = 0.47, n = 7, Wilcoxon signed-rank test). Insets, Representative current traces from control and transfected (blue) neurons. Calibration: 20 pA, 20 ms for AMPAR-eEPSC. C, Average AMPAR-eEPSC and NMDAR-eEPSC amplitudes (±SEM) of DG granule neurons expressing Tiam1 shRNA (gray bar) and DG granule neurons coexpressing Tiam1 shRNA, Tiam1 (yellow bar), and Tiam1 ΔDH normalized to respective control cell average eEPSC amplitudes (black bar). ***p < 0.001, *p < 0.05, Wilcoxon signed-rank test. D, Western blot showing Tiam1 ΔDH is expressed in HEK293 cells. E, Representative dendritic segments and corresponding reconstructed filaments from control neurons expressing GFP and Tiam1 and Tiam1 shRNA-expressing DG granule neurons. Scale bars, 4 μm. F, Boxplots show no detectable differences in any spine parameters in DG granule neurons coexpressing Tiam1 and Tiam1 shRNA (colored boxes) compared with GFP-expressing control neurons (gray boxes; p = 1 for spine length; p = 0.96 for spine neck length; p = 0.60 for head volume; p = 0.14 for spine density; for GFP, n = 28 segments; for Tiam1 rescue, n = 29 segments). n.s., Not significant, Wilcoxon rank-sum test.
Figure 5.
Figure 5.
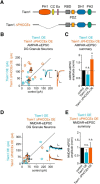
Tiam1 ΔPHCCEx expression increases AMPAR-mediated neurotransmission in DG granule neurons. A, Illustration of the protein domains of Tiam1; full-length Tiam1 (top) and Tiam1 ΔPHnCC-Ex (bottom). B, D, Scatterplots with AMPAR-eEPSC amplitudes for DG granule neurons expressing Tiam1 plotted against paired control neuron eEPSC (open circles) with corresponding mean ± SEM (filled circles). Insets, Representative current traces from control and transfected (blue for Tiam1 OE; vermillion for Tiam1 ΔPHn-CC-Ex) neurons with stimulation artifacts removed. Calibration: 20 pA for both AMPAR-eEPSC and NMDAR-eEPSC, 20 ms for AMPAR-eEPSC, 50 ms for NMDAR-eEPSC. B, Tiam1 overexpression (OE) produces no detectable differences in AMPA-eEPSC amplitude (p = 0.67, n = 9 pairs); Tiam1 ΔPHCCEx expression increases AMPAR-eEPSC amplitude (p = 0.04, n = 12 pairs). D, NMDAR-eEPSC amplitudes were not significantly affected in Tiam1 or Tiam1 ΔPHn-CC-Ex-expressing neurons and paired controls (p = 0.38, n = 7 pairs for Tiam1 OE; p = 0.50, n = 8 pairs for Tiam1 ΔPHCCEx). C, E, Bar plots of average AMPAR-eEPSC and NMDAR-eEPSC amplitudes (±SEM) of DG granule neurons overexpressing Tiam1 (blue for Tiam1 OE; vermillion for Tiam1 ΔPHCCEx OE) respective control cell average eEPSC amplitudes. Wilcoxon signed-rank test was used to compare across independent conditions. *p < 0.05, n.s., Not significant, Wilcoxon signed-rank test.

Similar articles

Cited by

References

    1. Bekkers JM, Stevens CF (1990) Presynaptic mechanism for long-term potentiation in the hippocampus. Nature 346:724–729. 10.1038/346724a0 - DOI - PubMed
    1. Bonnici B, Kapfhammer JP (2009) Modulators of signal transduction pathways can promote axonal regeneration in entorhino-hippocampal slice cultures. Eur J Pharmacol 612:35–40. 10.1016/j.ejphar.2009.04.007 - DOI - PubMed
    1. Cembrowski MS, Wang L, Sugino K, Shields BC, Spruston N (2016) Hipposeq: a comprehensive RNA-seq database of gene expression in hippocampal principal neurons. eLife 5:e14997. 10.7554/eLife.14997 - DOI - PMC - PubMed
    1. Chen X, Macara IG (2005) Par-3 controls tight junction assembly through the rac exchange factor Tiam1. Nat Cell Biol 7:262–269. 10.1038/ncb1226 - DOI - PubMed
    1. Cohen-Cory S. (2002) The developing synapse: construction and modulation of synaptic structures and circuits. Science 298:770–776. 10.1126/science.1075510 - DOI - PubMed

Publication types

MeSH terms

Substances

LinkOut - more resources