The effect of maternal high-fat/high-sugar diet on offspring oocytes and early embryo development
- PMID: 31588490
- PMCID: PMC6884416
- DOI: 10.1093/molehr/gaz049
The effect of maternal high-fat/high-sugar diet on offspring oocytes and early embryo development
Abstract
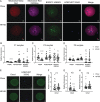
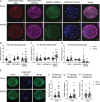
Observational human data and several lines of animal experimental data indicate that maternal obesity impairs offspring health. Here, we comprehensively tested the model that maternal obesity causes defects in the next three generations of oocytes and embryos. We exposed female F0 mice to a high-fat/high-sugar (HF/HS) diet for 6 weeks before conception until weaning. Sires, F1 offspring and all subsequent generations were fed control chow diet. Oocytes from F1, F2 and F3 offspring of obese mothers had lower mitochondrial mass and less ATP and citrate than oocytes from offspring of control mothers. F0 blastocysts from HF/HS-exposed mice, but not F1 and F2 blastocysts, had lower mitochondrial mass and membrane potential, less citrate and ATP and smaller total cell number than F0 blastocysts from control mothers. Finally, supplementation of IVF media with the anti-oxidant mito-esculetin partially prevented the oocyte mitochondrial effects caused by maternal HF/HS diet. Our results support the idea that maternal obesity impairs offspring oocyte quality and suggest that antioxidant supplementation should be tested as a means to improve IVF outcomes for obese women.
Keywords: HF/HS diet; blastocyst; mito-esculetin; mitochondria; oocytes.
© The Author(s) 2019. Published by Oxford University Press on behalf of the European Society of Human Reproduction and Embryology. All rights reserved. For permissions, please e-mail: journals.permissions@oup.com.
Figures


Similar articles
-
Preconception Diet Interventions in Obese Outbred Mice and the Impact on Female Offspring Metabolic Health and Oocyte Quality.Int J Mol Sci. 2024 Feb 13;25(4):2236. doi: 10.3390/ijms25042236. Int J Mol Sci. 2024. PMID: 38396912 Free PMC article.
-
A maternal high-fat, high-sucrose diet induces transgenerational cardiac mitochondrial dysfunction independently of maternal mitochondrial inheritance.Am J Physiol Heart Circ Physiol. 2019 May 1;316(5):H1202-H1210. doi: 10.1152/ajpheart.00013.2019. Epub 2019 Mar 22. Am J Physiol Heart Circ Physiol. 2019. PMID: 30901280 Free PMC article.
-
Obesity-induced oocyte mitochondrial defects are partially prevented and rescued by supplementation with co-enzyme Q10 in a mouse model.Hum Reprod. 2016 Sep;31(9):2090-7. doi: 10.1093/humrep/dew181. Epub 2016 Jul 17. Hum Reprod. 2016. PMID: 27432748 Free PMC article.
-
Multigenerational effects of chronic maternal exposure to a high sugar/fat diet and physical training.J Dev Orig Health Dis. 2020 Apr;11(2):159-167. doi: 10.1017/S2040174419000503. Epub 2019 Sep 10. J Dev Orig Health Dis. 2020. PMID: 31502530
-
Pregestational maternal obesity impairs endocrine pancreas in male F1 and F2 progeny.Nutrition. 2015 Feb;31(2):380-7. doi: 10.1016/j.nut.2014.08.002. Epub 2014 Aug 30. Nutrition. 2015. PMID: 25441581
Cited by
-
High-Fat Diet and Female Fertility across Lifespan: A Comparative Lesson from Mammal Models.Nutrients. 2022 Oct 17;14(20):4341. doi: 10.3390/nu14204341. Nutrients. 2022. PMID: 36297035 Free PMC article. Review.
-
Epigenetics in the Uterine Environment: How Maternal Diet and ART May Influence the Epigenome in the Offspring with Long-Term Health Consequences.Genes (Basel). 2021 Dec 23;13(1):31. doi: 10.3390/genes13010031. Genes (Basel). 2021. PMID: 35052371 Free PMC article. Review.
-
The effect of maternal body mass index on embryo division timings in women undergoing in vitro fertilization.F S Rep. 2022 Oct 20;3(4):324-331. doi: 10.1016/j.xfre.2022.10.004. eCollection 2022 Dec. F S Rep. 2022. PMID: 36568924 Free PMC article.
-
Elevated RIF1 participates in the epigenetic abnormalities of zygotes by regulating histone modifications on MuERV-L in obese mice.Mol Med. 2022 Feb 5;28(1):17. doi: 10.1186/s10020-022-00446-z. Mol Med. 2022. PMID: 35123389 Free PMC article.
-
Chronic developmental hypoxia alters mitochondrial oxidative capacity and reactive oxygen species production in the fetal rat heart in a sex-dependent manner.J Pineal Res. 2022 Oct;73(3):e12821. doi: 10.1111/jpi.12821. Epub 2022 Aug 17. J Pineal Res. 2022. PMID: 35941749 Free PMC article.
References
-
- Aparicio-Ruiz B, Romany L, Meseguer M. Selection of preimplantation embryos using time-lapse microscopy in in vitro fertilization: state of the technology and future directions. Birth Defects Res 2018;110:648–653. - PubMed
-
- Bellver J, De los Santos MJ, Alamá P, Castelló D, Privitera L, Galliano D, Labarta E, Vidal C, Pellicer A, Domínguez F. Day-3 embryo metabolomics in the spent culture media is altered in obese women undergoing in vitro fertilization. Fertil Steril 2015;103:1407, e1401–1415. - PubMed
-
- Boudoures AL, Saben J, Drury A, Scheaffer S, Modi Z, Zhang W, Moley KH. Obesity-exposed oocytes accumulate and transmit damaged mitochondria due to an inability to activate mitophagy. Dev Biol 2017;426:126–138. - PubMed
-
- Burggren WW. Dynamics of epigenetic phenomena: intergenerational and intragenerational phenotype ‘washout’. J Exp Biol 2015;218:80–87. - PubMed
Publication types
MeSH terms
Substances
Grants and funding
LinkOut - more resources
Full Text Sources
Medical
Research Materials
Miscellaneous

