MatrisomeDB: the ECM-protein knowledge database
- PMID: 31586405
- PMCID: PMC6943062
- DOI: 10.1093/nar/gkz849
MatrisomeDB: the ECM-protein knowledge database
Abstract
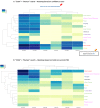
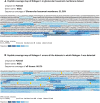
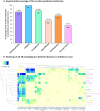
The extracellular matrix (ECM) is a complex and dynamic meshwork of cross-linked proteins that supports cell polarization and functions and tissue organization and homeostasis. Over the past few decades, mass-spectrometry-based proteomics has emerged as the method of choice to characterize the composition of the ECM of normal and diseased tissues. Here, we present a new release of MatrisomeDB, a searchable collection of curated proteomic data from 17 studies on the ECM of 15 different normal tissue types, six cancer types (different grades of breast cancers, colorectal cancer, melanoma, and insulinoma) and other diseases including vascular defects and lung and liver fibroses. MatrisomeDB (http://www.pepchem.org/matrisomedb) was built by retrieving raw mass spectrometry data files and reprocessing them using the same search parameters and criteria to allow for a more direct comparison between the different studies. The present release of MatrisomeDB includes 847 human and 791 mouse ECM proteoforms and over 350 000 human and 600 000 mouse ECM-derived peptide-to-spectrum matches. For each query, a hierarchically-clustered tissue distribution map, a peptide coverage map, and a list of post-translational modifications identified, are generated. MatrisomeDB is the most complete collection of ECM proteomic data to date and allows the building of a comprehensive ECM atlas.
© The Author(s) 2019. Published by Oxford University Press on behalf of Nucleic Acids Research.
Figures


Similar articles
-
MatrisomeDB 2.0: 2023 updates to the ECM-protein knowledge database.Nucleic Acids Res. 2023 Jan 6;51(D1):D1519-D1530. doi: 10.1093/nar/gkac1009. Nucleic Acids Res. 2023. PMID: 36399478 Free PMC article.
-
The extracellular matrix: Tools and insights for the "omics" era.Matrix Biol. 2016 Jan;49:10-24. doi: 10.1016/j.matbio.2015.06.003. Epub 2015 Jul 8. Matrix Biol. 2016. PMID: 26163349 Free PMC article. Review.
-
Characterization of the Extracellular Matrix of Normal and Diseased Tissues Using Proteomics.J Proteome Res. 2017 Aug 4;16(8):3083-3091. doi: 10.1021/acs.jproteome.7b00191. Epub 2017 Jul 19. J Proteome Res. 2017. PMID: 28675934 Free PMC article.
-
Protein Identification from Tandem Mass Spectra by Database Searching.Methods Mol Biol. 2017;1558:357-380. doi: 10.1007/978-1-4939-6783-4_17. Methods Mol Biol. 2017. PMID: 28150247
-
Informatics for protein identification by mass spectrometry.Methods. 2005 Mar;35(3):223-36. doi: 10.1016/j.ymeth.2004.08.014. Epub 2005 Jan 13. Methods. 2005. PMID: 15722219 Review.
Cited by
-
A pan-cancer analysis of matrisome proteins reveals CTHRC1 and a related network as major ECM regulators across cancers.PLoS One. 2022 Oct 3;17(10):e0270063. doi: 10.1371/journal.pone.0270063. eCollection 2022. PLoS One. 2022. PMID: 36190948 Free PMC article.
-
Passing the post: roles of posttranslational modifications in the form and function of extracellular matrix.Am J Physiol Cell Physiol. 2023 May 1;324(5):C1179-C1197. doi: 10.1152/ajpcell.00054.2023. Epub 2023 Mar 13. Am J Physiol Cell Physiol. 2023. PMID: 36912485 Free PMC article. Review.
-
Integrative evaluation and experimental validation of the immune-modulating potential of dysregulated extracellular matrix genes in high-grade serous ovarian cancer prognosis.Cancer Cell Int. 2023 Sep 30;23(1):223. doi: 10.1186/s12935-023-03061-y. Cancer Cell Int. 2023. PMID: 37777759 Free PMC article.
-
A ligand-receptor interactome atlas of the zebrafish.iScience. 2023 Jul 12;26(8):107309. doi: 10.1016/j.isci.2023.107309. eCollection 2023 Aug 18. iScience. 2023. PMID: 37539027 Free PMC article.
-
Clinical Implications and Molecular Features of Extracellular Matrix Networks in Soft Tissue Sarcomas.Clin Cancer Res. 2024 Aug 1;30(15):3229-3242. doi: 10.1158/1078-0432.CCR-23-3960. Clin Cancer Res. 2024. PMID: 38810090 Free PMC article.
References
-
- Hynes R.O., Yamada K.M.. Extracellular matrix biology. Cold Spring Harbor Perspectives in Biology. 2012; NY: Cold Spring Harbor Laboratory Press.
-
- Dzamba B.J., DeSimone D.W.. Extracellular matrix (ECM) and the sculpting of embryonic tissues. Curr. Top. Dev. Biol. 2018; 130:245–274. - PubMed
Publication types
MeSH terms
Substances
LinkOut - more resources
Full Text Sources
Miscellaneous

