Review
. 2019:1175:273-324.
doi: 10.1007/978-981-13-9913-8_11.

Astroglia in Alzheimer's Disease

Affiliations
Review

Astroglia in Alzheimer's Disease

Alexei Verkhratsky et al. Adv Exp Med Biol. 2019.

Abstract

Alzheimer's disease is the most common cause of dementia. Cellular changes in the brains of the patients suffering from Alzheimer's disease occur well in advance of the clinical symptoms. At the cellular level, the most dramatic is a demise of neurones. As astroglial cells carry out homeostatic functions of the brain, it is certain that these cells are at least in part a cause of Alzheimer's disease. Historically, Alois Alzheimer himself has recognised this at the dawn of the disease description. However, the role of astroglia in this disease has been understudied. In this chapter, we summarise the various aspects of glial contribution to this disease and outline the potential of using these cells in prevention (exercise and environmental enrichment) and intervention of this devastating disease.

Keywords: Alzheimer’s disease; Astrocytes; Astroglial atrophy; Calcium signalling; Neurodegeneration; Pathological ageing; Stem cells.


Figures

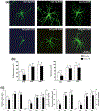
Fig. 11.1
Fig. 11.1
Glial cells in AD a Alois Alzheimeŕs drawing illustrating the glial reaction (astro- and/or micro-gliosis and hypertrophy) in a pathological brain containing senile plaques. Abbreviations: gaz, ganglionic cell—i.e. neurone; glz, glial cell, P, central part of the plaque; P2, peripheral part of the plaque. From [8]. b Photomicrograph showing the presence of β-amyloid within the pyramidal neurones of the hippocampal CA1 area as well as the presence of a plaque in 12 months 3xTg-AD mice. c, d Confocal images showing GFAP-positive (green) reactive astrocytes surrounding β-amyloid plaques (β-A red; c). d Reactive astrocytes (green) and an astrocyte showing cytoplasmic β-amyloid accumulation (indicated by arrows; co-localisation is in yellow) near a neuritic plaque (red). Modified and adapted with permission from [235]
Fig. 11.2
Fig. 11.2
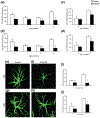
Astroglial atrophy in the entorhinal cortex (EC) of 3xTg-AD mice. Comparison of astrocytic GFAP surface area and volume in the EC of non-Tg and 3xTg-AD animals of different ages. The histograms show a comparison of a surface area, b total cell volume and c somata volume in the EC at the ages of 1, 3, 6, 9 and 12 months between 3xTg-AD and non-Tg animals. Results are means ± S.E.M. (*p < 0.05 compared with the age-matched non-Tg control). Confocal micrographs show astrocytic atrophy in 3xTg-AD at 1 month (e) and 12 months (g) compared with the control animals (d, f). Reproduced with permission from [338]
Fig. 11.3
Fig. 11.3
Astroglial atrophy in the prefrontal cortex of 3xTg-AD mice. Confocal images showing morphology of GFAP-positive astrocytes in control non-Tg animals and astrocytic atrophy in the 3xTg-AD animals at 3 months (a and b, respectively) and 18 months (c and d, respectively) in the prefrontal cortex. Bar graphs showing the decreases in the surface area and volume (e, f) in 3xTg-AD mice when compared with control animals. Bars represent mean ±SEM. Reproduced with permission from [139]
Fig. 11.4
Fig. 11.4
Astroglial atrophy in the hippocampal areas of 3xTg-AD mice. Bar graphs showing the significant decrease in surface area, volume, and soma volume of GFAP-positive astrocytes in the dentate gyrus (DG) (a, b, i) and the CA1 region (c, d, j) of the hippocampus of the 3xTg-AD mice when compared with control animals. Bars represent mean ± SEM (p < 0.05). (gj). Confocal micrographs illustrating the astrocytic atrophy in 3xTg-AD mice in the DG (f) and CA1 (h) compared to control animals (e and g). Reproduced with permission from [203]
Fig. 11.5
Fig. 11.5
Astrocytes derived from PSEN1 M146L FAD and ApoE4+/+ SAD patients exhibit significant atrophy when compared to those from healthy patients. a Exemplar 3D isosurface renders constructed from serial confocal z-stacks display clear differences in cell size and overall morphology (b). Scale bar = 10 μm. Quantification of cells using these renders by way of surface area (c), cell volume (d) and SA:Vol ratio (e) reveal significant differences in all aspects of cellular morphology between healthy and diseased astrocytes. Quantification of mean fluorescence intensity per immunoreactive cell reveals no significant difference in GFAP staining intensities between AD and control astrocytes (f) but S100B, EAAT1 and GS intensities are reduced in both FAD and SAD cells (g, h and i, respectively). Asterisks on graph; ***p < 0.001, **p < 0.005, *p < 0.05. Reproduced from [119]
Fig. 11.6
Fig. 11.6
Concomitant astroglial atrophy and astrogliosis at the advanced stages of AD-like pathology in 3xTg-Ad mice. a, b Confocal images of hippocampal preparations dually labelled by GFAP and by anti-β amyloid monoclonal antibody illustrating differential changes in GFAP profiles in astrocytes distant to the plaques (a) and associated with the β-amyloid plaques (b). ce Confocal dual labelling images (GFAP in green and β-amyloid in red) in 3xTg-AD mice showing the accumulation of astrocytes around the β-amyloid plaques and vascular β-amyloid deposits. Astrocytes surrounding β-amyloid plaques (d, e) and β-amyloid deposits around a blood vessel (c), undergo astrogliosis. fk Bar graphs showing GFAP-positive astrocytic surface area (f), volume (g) and somata volume (h) differences between astrocytes located around the β-amyloid plaques (Aβ) and those distant to the plaques in the CA1 of 3xTg-AD animals. ik Similar astrocytic surface area (i), volume (j) and somata volume (k) differences are observed in the DG at 18 months of age. Bars represent mean 6 SEM (p < 0.05). Reproduced with permission from [203]
Fig. 11.7
Fig. 11.7
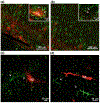
β-Amyloid depositions trigger gliotic response in associated astrocytes in the hippocampus but not in the entorhinal cortex. a, b Confocal images of hippocampal preparations labelled by GFAP (green) and β-amyloid (red) illustrating differential changes in GFAP profiles in astrocytes in close association with Aβ plaques (a) and atrophic profiles of astrocytes (arrows) distant from β-amyloid deposits (b) in 3xTg-AD mice. c, d Confocal dual labelling images (GFAP in green and β-amyloid in red) showing the absence of reactive response of astrocytes in the entorhinal cortex of 3xTg-AD mice around perivascular vascular β-amyloid deposits (c) and β-amyloid plaques (d). Modified and reproduced with permission from [300, 338]
Fig. 11.8
Fig. 11.8
Failure in astroglial reactivity defines the switch between mild cognitive impairment and senility in AD. Prominent astrogliosis in the brain of patient with mild cognitive impairment associated with high β-amyloid load (Left panel) in comparison with patient with Alzheimer’s disease (Right panel). Representative images of 11C-d-deprenyl binding (that reflects MAO-B expression in astrocytes) were obtained by position emission tomography. The MCI patient also showed high presence of fibrillar amyloid plaque as measured with 11C-PIB (the status that could be identified as a prodromal AD). The PET scans show sagittal sections of the brain at the level of basal ganglia. Colour scale indicates red = very high, yellow = moderately high, green = high, blue = low 11C-d-deprenyl binding. Photo courtesy of A. Nordberg, Karolinska institutet. Reproduced with permission from [300]
Fig. 11.9
Fig. 11.9
Decreased spontaneous mobility of peptidergic vesicles in 3xTg-AD astrocytes. a Live cultured wild-type (wt) astrocyte under DIC optics and b the confocal image of the same cell expressing fluorescent peptide atrial natriuretic peptide-emerald green (ANP.emd), stored in individual vesicles, observed as bright fluorescent puncta; scale bars, 10 μm. c Vesicle tracks (N = 50) obtained in a 15-s epoch of imaging representative control (wt) and d 3xTg-AD astrocytes expressing ANP.emd, respectively. Note less elongated vesicle tracks in the 3xTg-AD astrocyte. e, f Frequency histogram of the step length in spontaneously moving vesicles in wt (N = 5025, e) and 3xTg-AD (N = 5072, f) astrocytes. The data were fitted with the function f = a × exp(− 0.5 × (x/x0)/b)2/x, where a = 17.88±0.00 μm−0.5, x0 = 0.07±0.00 μm(black curve) and a=6.53±0.13, b=0.19±0.01 μm−0.5, x0 = 0.31±0.01 μm (grey curve) in wt astrocyte, and with the function f = a × exp(−0.5 × (lnx/x0)/b)2/x, where a = 1.96 ± 0.04, b=0.92 ± 0.02 μm−0.5, x0 = 0.10± 0.00 μm (black curve) in 3xTg-AD astrocyte. The indicates the step length of 0.2 μm obtained close to the intersection of distributions (black and grey curve) in wt astrocytes to discriminate small (<0.2 μm) from large (≥ 0.2 μm) steps. Note the higher proportion (%) of smaller steps lengths in the 3xTg-AD astrocyte indicated by the absence of the second mode distribution seen in wt astrocytes. g Track length (TL), h maximal displacement (MD),note substantially diminished TL, MD in 3xTg-AD astrocytes. The numbers above the top of the bars (mean ± SEM) indicate the number of vesicles analysed; the numbers at the bottom of the bars indicate the number of cells analysed; “***”—indicates p values < 0.001. Modified with permission from [269]
Fig. 11.10
Fig. 11.10
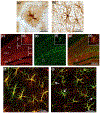
Down-regulation of glutamine synthetase (GS) expression in hippocampal astrocytes in 3xTg-AD mice. a, b Light microscopy images of GS—(a) and GFAP—(b) positive astrocytes. c, e, g Confocal images of hippocampal preparation labelled for GS (c, red), GFAP (e, green) and their co-localisation (g, yellow). d, f, h High magnification confocal images illustrating the co-expression of GS and GFAP. i, j Ubiquitous co-expression of GS and GFAP in wild-type control mice (i) and down-regulation of GS expression (astrocytes lacking GS are indicated by arrows) in 3xTg-AD mice (j). DG, dentate gyrus; GcL, granule cell layer; MoL, molecular layer; Lac, stratum lacunosum moleculare; Or, stratum oriens; PcL, pyramidal layer; Rad, stratum radiatum. Modified and reproduced with permission from [204]
Fig. 11.11
Fig. 11.11
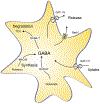
GABAergic reactive astrocytes in AD. See text for explanation. Abbreviations: GAT1/3 GABA transporters 1 (SLC6A1) and 3 (SLC6A11); Best1—bestrophin 1 anion channel 1; GABAT—GABA transaminase; TCA—tricarboxylic acid (Krebs) cycle; MAO-B—Monoamine oxidase B; GAD67—glutamate decarboxylase. Modified from [84]
Fig. 11.12
Fig. 11.12
Environmental stimulation (enriched environment, ENR and physical activity, RUN) reverse morphological atrophy of astrocytes seen in the dentate gyrus isolates from 3xTg-AD mice. GFAP-immunoreactivity of astrocytes in the DG of non-Tg and 3xTg-AD animals housed in different conditions. a High magnification of representative confocal micrographs showing the astrocytic morphology in mice housed in standard conditions (STD), RUN and ENR. Scale bars, 10 μm. Note the morphological changes of the astrocytes from both genotypes induced by the different living conditions. b Histograms showing difference of surface area and volume of GFAP-positive astrocytes in the DG of non-Tg and 3xTg-AD mice housed under different housing conditions. c Histograms showing differences in surface area and volume of GFAP-immunoreactivity of astrocytic cell bodies and processes detected between non-Tg and 3xTg-AD mice housed under different housing conditions. Bars represent means ± S.E.M., #p < 0.05, ##p < 0.01 compared with non-Tg animals in same housing environment; *p < 0.05, **p < 0.01 compared with non-Tg mice housed under STD; ◆◆p < 0.01 and ◆◆◆p < 0.001 compared with 3xTg-AD mice housed under STD. Reproduced with permission from [236]

Similar articles

Cited by

References

    1. Abdul HM, Sama MA, Furman JL, Mathis DM, Beckett TL, Weidner AM, Patel ES, Baig I, Murphy MP, LeVine H 3rd, Kraner SD, Norris CM (2009) Cognitive decline in Alzheimer’s disease is associated with selective changes in calcineurin/NFAT signaling. J Neurosci 29:12957–12969 - PMC - PubMed
    1. Abramov AY, Canevari L, Duchen MR (2003) Changes in intracellular calcium and glutathione in astrocytes as the primary mechanism of amyloid neurotoxicity. J Neurosci 23:5088–5095 - PMC - PubMed
    1. Abramov AY, Canevari L, Duchen MR (2004) β-Amyloid peptides induce mitochondrial dysfunction and oxidative stress in astrocytes and death of neurons through activation of NADPH oxidase. J Neurosci 24:565–575 - PMC - PubMed
    1. Alberdi E, Wyssenbach A, Alberdi M, Sanchez-Gomez MV, Cavaliere F, Rodriguez JJ, Verkhratsky A, Matute C (2013) Ca2+-dependent endoplasmic reticulum stress correlates with astrogliosis in oligomeric amyloid β-treated astrocytes and in a model of Alzheimer’s disease. Aging Cell 12:292–302 - PubMed
    1. Allaman I, Gavillet M, Belanger M, Laroche T, Viertl D, Lashuel HA, Magistretti PJ (2010) Amyloid-β aggregates cause alterations of astrocytic metabolic phenotype: impact on neuronal viability. J Neurosci 30:3326–3338 - PMC - PubMed