. 2019 Oct 1;11(10):911.
doi: 10.3390/v11100911.

Differential Pathogenicity of SHIV KB9 and 89.6 Env Correlates with Bystander Apoptosis Induction in CD4+ T cells

Affiliations

Differential Pathogenicity of SHIV KB9 and 89.6 Env Correlates with Bystander Apoptosis Induction in CD4+ T cells

Tugba Mehmetoglu-Gurbuz et al. Viruses. .

Abstract

SHIV variants KB9 and 89.6 show differential pathogenesis in primate models with KB9 causing rapid CD4 decline while 89.6 failing to induce disease. We attempted to determine whether the differential pathogenicity of KB9 versus 89.6 was a result of differential bystander apoptosis inducing potential (AIP) of the Env glycoproteins from these viruses. We find that the KB9 Env was highly potent at inducing bystander apoptosis in CD4+ target cells compared to 89.6 Env. Cell death induction by KB9 showed classical signs of apoptosis including mitochondrial depolarization, caspase activation and PARP cleavage. Inhibiting Env mediated fusion by T20 peptide inhibited KB9 mediated bystander apoptosis. KB9 and 89.6 differed in terms of co-receptor usage with 89.6 preferring CXCR4 while KB9 using both CXCR4 and CCR5 with equal efficiency. Our study suggests that higher bystander AIP of KB9 Env compared to 89.6 may be the basis for the differential pathogenesis of these viruses.

Keywords: 89.6; CCR5; CXCR4; Caspase; Envelope; HIV; KB9; SHIV; apoptosis inducing potential; bystander apoptosis; pathogenesis.


Conflict of interest statement

The authors declare no conflicts of interest.

Figures

Figure 1
Figure 1
SHIV KB9 Env mediates higher apoptosis in bystander CD4+ T cells. HeLa cells were transfected with pSHIV-Env (KB-9 or 89.6), pHIV-1-Env (89.6 or Lai) or control vector pcDNA3.1 and co-cultured with the SupT1 cell line. Apoptosis was detected either via annexin V staining or DiOC6 staining 24 hours post co-culture. Representative dot plots for annexin V (A) and DiOC6 staining (B) are shown. Apoptosis induction by different Envs as determined by Annexin V (C) or DiOC6 staining (D) is shown. Data are mean ± SD of triplicate observations. p ≤ 0.0001 as determined by one-way ANOVA followed by Dunnett’s multiple comparison test. All experiments were repeated with similar results.
Figure 2
Figure 2
HIV gp41 inhibitor T20 inhibits SHIV KB9 mediated bystander apoptosis. HeLa cells transfected with different Env constructs or control vector were cocultured with SupT cells in the presence or absence of T20 (2 μM). Apoptosis was detected 24 h post co-culture using Annexin-V staining (A). Mitochondrial depolarization was detected via DiOC6 staining followed by flow cytometry analysis (B). Data are mean ± SD of triplicate observations. **** = p ≤ 0.0001; *** = p ≤ 0.001; ** = p ≤ 0.01 as determined by two tailed unpaired t-test. All experiments were repeated with similar results.
Figure 3
Figure 3
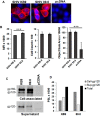
Env expression and Env shedding for KB9 and 89.6 Envs. HeLa cells were transfected with Env expression constructs for KB9, 89.6 or control pcDNA3.1 vector. Surface Env expression was determined 48 hrs post transfection after staining with the b12 antibody flowed by fluorescence microscopy (A). Whole wells of 96-well plate were scanned to determine MFI, positive cell counts and object sum area. p ≤ 0.0001 as determined by one-way ANOVA (B). HeLa cells were transfected as above and Env shedding was determined after radiolabeling of cells with [35S] Met/Cys followed by immunoprecipitation of cell lysates and supernatants using HIV Ig (C). Quantitation of cell associated and shed gp120 (D). One representative of two independent experiments is shown.
Figure 4
Figure 4
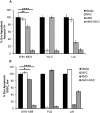
Variable coreceptor usage by SHIV Envs. HIV-1 virions pseudotyped with indicated Envs were used to infect TZM-bl indicator cell line. Pseudotyped virus infections were conducted in the presence of inhibitors Maraviroc (MVC), AMD 3100 (AMD), a combination of both AMD and MVC (AMD + MVC) or no inhibitor (media). Virus infectivity was determined 72 h later by measuring luciferase activity. **** = p ≤ 0.0001; *** = p ≤ 0.001; ** = p ≤ 0.01 as determined by one-way ANOVA followed by Dunnett’s multiple comparison test.
Figure 5
Figure 5
SHIV KB9 uses both CXCR4 and CCR5 equally for induction of bystander apoptosis. HeLa cells transfected with various Envs were cocultured with SupT-R5-H6 cells. Coreceptor inhibitors AMD3100 (CXCR4) and MVC (CCR5) were used to inhibit apoptosis either alone or in combination (AMD + MVC). Apoptosis was determined 24 h later via annexin V staining (A) or detecting mitochondrial depolarization via DiOC6 staining (B). Data was normalized for each Env and percent Env specific apoptosis was calculated. Data are mean ± SD of triplicate observations. **** = p ≤ 0.0001; ** = p ≤ 0.01 and * = p ≤ 0.05 as determined by one-way ANOVA followed by Dunnett’s multiple comparison test. All experiments were repeated with similar results.
Figure 6
Figure 6
Bystander apoptosis mediated by SHIV KB9 is caspase dependent. HeLa cells expressing SHIV Env were cocultured with SupT cell in the presence or absence of pan caspase inhibitor ZVAD-fmk. Apoptosis was detected 24 h later using Annexin V (A) or DiOC6 staining (B). **** = p ≤ 0.0001; *** = p ≤ 0.001; ** = p ≤ 0.01 as determined by two tailed unpaired t-test. Activation of caspases in HeLa Env-SupT cocultures was detected by staining with ZVAD-FITC. Representative dot plots are shown (C) and data from triplicate observations is shown in (D). **** = p ≤ 0.0001; ** = p ≤ 0.01 as determined by one-way ANOVA followed by Dunnett’s multiple comparison test. PARP cleavage was detected in SupT cells cocultured with HeLa cells transfected with different SHIV Envs or control vector. Western blot of PARP protein levels and tublin control is shown in (E). Quantitation of PARP cleavage as ratio of cleaved PARP/total PARP is shown in (F).
Figure 7
Figure 7
SHIV KB9 Env caused specific loss of CD4 cells via apoptosis in PBMC from healthy donors. HeLa cells were transfected with SHIV Envs (KB-9 and 89.6), or control vectors (pcDNA3.1) and co-cultured with PBMCs from healthy donors. At 48-hours post co-culture, PBMCs were collected and stained for CD3, CD4, CD8 and ZVAD-FITC and analyzed by flow cytometry. Cells gated on CD3+ population were analyzed for the CD4:CD8 ratio. Representative dot plots of the CD4:CD8 ratio are shown in (A) and results from eight different donors are shown in (B). Apoptosis was detected as ZVAD-FITC+ cells in CD3 + CD4 + population. Representative dot plots of CD4 apoptosis are shown in (C) and results from 8 different donors are shown in (D). Apoptosis was detected as ZVAD – FITC + cells in CD3 + CD8 + population. Representative dot plots of CD8 apoptosis are shown in (E) and results from eight different donors are shown in (F). Wilcoxon matched-pairs signed rank test was used for statistical analysis (** = p ≤ 0.01).
Figure 8
Figure 8
SHIV KB9 Env causes specific loss of CD4 cells via apoptosis in PBMC from Rhesus Macaques. HeLa cells were transfected with SHIV Envs (KB-9 and 89.6), or control vector (pcDNA3.1) and co-cultured with PBMCs from Indian Rhesus Macaques. At 48-hours post co-culture, PBMCs were collected and stained for CD3, CD4, CD8 and ZVAD-FITC and analyzed by flow cytometry. Cells gated on CD3+ population were analyzed for the CD4:CD8 ratio. Representative dot plots of the CD4:CD8 ratio are shown in (A) and average ± SD of triplicate observations are shown in (B). Apoptosis was detected as ZVAD-FITC+ cells in CD3 + CD4 + population. Representative dot plots of CD4 apoptosis are shown in (C) and average ± SD of triplicate observations are shown in (D). Apoptosis was detected as ZVAD-FITC+ cells in CD3 + CD8 + population. Representative dot plots of CD8 apoptosis are shown in (E) and average ± SD of triplicate observations are shown (F). Data are expressed as mean ± SD and were compared using one-way ANOVA followed by Dunnett’s multiple comparison test. **** = p ≤ 0.0001.

Similar articles

References

    1. Silvestri G. AIDS pathogenesis: A tale of two monkeys. J. Med. Primatol. 2008;37:6–12. doi: 10.1111/j.1600-0684.2008.00328.x. - DOI - PubMed
    1. Silvestri G., Sodora D.L., Koup R.A., Paiardini M., O’Neil S.P., McClure H.M., Staprans S.I., Feinberg M.B. Nonpathogenic SIV infection of sooty mangabeys is characterized by limited bystander immunopathology despite chronic high-level viremia. Immunity. 2003;18:441–452. doi: 10.1016/S1074-7613(03)00060-8. - DOI - PubMed
    1. Monceaux V., Estaquier J., Fevrier M., Cumont M.C., Riviere Y., Aubertin A.M., Ameisen J.C., Hurtrel B. Extensive apoptosis in lymphoid organs during primary SIV infection predicts rapid progression towards AIDS. AIDS. 2003;17:1585–1596. doi: 10.1097/00002030-200307250-00002. - DOI - PubMed
    1. Viollet L., Monceaux V., Petit F., Ho Tsong Fang R., Cumont M.C., Hurtrel B., Estaquier J. Death of CD4+ T cells from lymph nodes during primary SIVmac251 infection predicts the rate of AIDS progression. J. Immunol. 2006;177:6685–6694. doi: 10.4049/jimmunol.177.10.6685. - DOI - PubMed
    1. Crawford J.M., Earl P.L., Moss B., Reimann K.A., Wyand M.S., Manson K.H., Bilska M., Zhou J.T., Pauza C.D., Parren P.W., et al. Characterization of primary isolate-like variants of simian-human immunodeficiency virus. J. Virol. 1999;73:10199–10207. - PMC - PubMed

Publication types