. 2019 Nov 26;93(24):e00969-19.
doi: 10.1128/JVI.00969-19. Print 2019 Dec 15.

Differentiation into an Effector Memory Phenotype Potentiates HIV-1 Latency Reversal in CD4+ T Cells

Affiliations

Differentiation into an Effector Memory Phenotype Potentiates HIV-1 Latency Reversal in CD4+ T Cells

Deanna A Kulpa et al. J Virol. .

Abstract

During antiretroviral therapy (ART), human immunodeficiency virus type 1 (HIV-1) persists as a latent reservoir in CD4+ T cell subsets in central memory (TCM), transitional memory (TTM), and effector memory (TEM) CD4+ T cells. We have identified differences in mechanisms underlying latency and responses to latency-reversing agents (LRAs) in ex vivo CD4+ memory T cells from virally suppressed HIV-infected individuals and in an in vitro primary cell model of HIV-1 latency. Our ex vivo and in vitro results demonstrate the association of transcriptional pathways of T cell differentiation, acquisition of effector function, and cell cycle entry in response to LRAs. Analyses of memory cell subsets showed that effector memory pathways and cell surface markers of activation and proliferation in the TEM subset are predictive of higher frequencies of cells carrying an inducible reservoir. Transcriptional profiling also demonstrated that the epigenetic machinery (known to control latency and reactivation) in the TEM subset is associated with frequencies of cells with HIV-integrated DNA and inducible HIV multispliced RNA. TCM cells were triggered to differentiate into TEM cells when they were exposed to LRAs, and this increase of TEM subset frequencies upon LRA stimulation was positively associated with higher numbers of p24+ cells. Together, these data highlight differences in underlying biological latency control in different memory CD4+ T cell subsets which harbor latent HIV in vivo and support a role for differentiation into a TEM phenotype in facilitating latency reversal.IMPORTANCE By performing phenotypic analysis of latency reversal in CD4+ T cells from virally suppressed individuals, we identify the TEM subset as the largest contributor to the inducible HIV reservoir. Differential responses of memory CD4+ T cell subsets to latency-reversing agents (LRAs) demonstrate that HIV gene expression is associated with heightened expression of transcriptional pathways associated with differentiation, acquisition of effector function, and cell cycle entry. In vitro modeling of the latent HIV reservoir in memory CD4+ T cell subsets identify LRAs that reverse latency with ranges of efficiency and specificity. We found that therapeutic induction of latency reversal is associated with upregulation of identical sets of TEM-associated genes and cell surface markers shown to be associated with latency reversal in our ex vivo and in vitro models. Together, these data support the idea that the effector memory phenotype supports HIV latency reversal in CD4+ T cells.

Keywords: CD4 T cells; HIV latency; HIV persistence.


Figures

FIG 1
FIG 1
The inducible HIV reservoir resides in the TEM subset. (a) The distribution of the TCM, TTM, and TEM subsets in ex vivo memory CD4+ T cells is shown, and P values are indicated. Each circle represents individual participants from Table S1 in the supplemental material (bars indicate means with standard deviations [SD], Wilcoxon matched-pair signed-rank test, n = 69). (b) CD4+ T cells from virally suppressed individuals were sorted into TCM, TTM, and TEM subsets using the gating strategy in Fig. S1 in the supplemental material, and integrated HIV DNA in each subset was quantified. Bars indicate means with SD from a Wilcoxon matched-pair signed-rank test; P values are indicated (n = 18). (c) The frequency of transcription of HIV msRNA induced by PMA plus ionomycin (iono), normalized by the amount of integrated HIV DNA in each subset, is shown. Unstimulated sorted subsets were included as a control. There was no statistical difference between levels of HIV msRNA in cells from the CD4+ memory subsets before activation. After exposure to PMA and ionomycin, the frequency of HIV msRNA was quantified and calculated. P values are indicated. (Wilcoxon matched-pair signed-rank test; n = 11). (d) Contribution of HIV msRNA from each CD4+ memory subset from panel c. All undetectable values were input as zero. The contributions of the TCM, TTM, and TEM subsets to the overall HIV msRNA signal are shown. Each pie slice was calculated using the frequency of HIV msRNA in each memory subset as a percentage of the total signal. Frequency is indicated within each pie slice (n = 11).
FIG 2
FIG 2
Latency reversal is associated with the upregulation of T cell effector pathways. (a) Heatmap of the gene sets expressed in sorted ex vivo TEM and TCM cells from the FL cohort correlated with the frequency of cells expressing HIV msRNA measured by TILDA (n = 9). GSEA was first performed to identify pathways/gene sets correlated with TILDA across the cell subsets, and then the SLEA z-score of the pathway was calculated per sample, represented by the color gradient. Rows represent the pathway, and columns represent samples. Samples were ordered by increasing expression of the pathway associated with TILDA (mean rank ordering). The association between the mean rank and TILDA is then tested with a Spearman correlation, and its P value and rho are indicated next to the TILDA annotation bar. The increasing pathway expression is associated with increasing TILDA values (P value < 0.0001, rho = 0.8). A Wilcox test is then performed to assess the difference in mean ranks between TEM and TCM cells. The Wilcox test P value is then indicated next to the cell subset annotation bar. These gene sets also show higher expression in TEM cells than in TCM cells (P value = 0.003). (b) We examined the inducible reservoir in sorted memory CD4+ T cell subsets from virally suppressed HIV-infected individuals (FL cohort; n = 5). Sorted memory CD4+ TCM, TTM, and TEM subsets were exposed to 100 ng/ml PMA plus 1 μg/ml ionomycin, 10 ng/ml IL-15, or 10 nM bryostatin, and the induction of HIV msRNA was measured using TILDA (stimulated [stim]). Untreated cells were used as a control (unstim). The TEM and TTM subsets showed significant induction of HIV msRNA upon stimulation compared to that of the unstimulated controls (Wilcoxon rank sum test; P values are indicated). The line in each box plot denotes a median value with SD. (c) Heatmap of the pathways differentially expressed between unstimulated (baseline) CD4+ memory subsets (P value < 0.05) from three out of the five individuals shown in panel b. Rows represent the pathway, and columns represent samples. The color gradient represents the z-score of the pathway per sample calculated by SLEA. Effector function and cell cycling pathways show significant upregulation in the TEM subset compared to in the TCM and TTM subsets, while the senescent TGF-β signaling pathway is significantly upregulated in the TCM subset. (d) Heatmap of the genes upregulated in the unstimulated TEM subset compared to those of the unstimulated TCM subset. The average gene expression across the three participants (shown in panel b) per memory subset is shown here. The expression of these genes was also assessed in the bryostatin-stimulated TCM cells, showing that the stimulated TCM cells have a gene expression profile similar to that of the unstimulated TEM cells. The color gradient represents the rank of the gene expression across subsets (n = 3). (e) Hierarchical clustering on the pathways in the TCM subset upon exposure to bryostatin that was differentially expressed from that of the unstimulated controls (P value < 0.05). The pathway expression was assessed in the TCM subset and in the unstimulated TEM subset. Similarities in gene expression were determined using the complete linkage clustering method, with the distance between gene expression profiles measured using Euclidean distance. The height of a dendrogram represents the Euclidean distance. The bryostatin-stimulated TCM subset is in close proximity to the unstimulated TEM subset. (f and g) Heatmap of the pathways in the TCM subset upon exposure to LRAs (bryostatin [e] or PMA plus ionomycin [f]) that were differentially expressed from those of their unstimulated controls (P value < 0.05). Rows represent the pathway, and columns represent samples. The color gradient represents the z-scores of the pathway per sample calculated by SLEA. Pathways are grouped by biological function. (h) Heatmap of the pathways differentially expressed in the TEM subset upon exposure to IL-15 (P value < 0.05).
FIG 3
FIG 3
The TEM subset is characterized by expression of markers of cell cycle entry and of T cell activation. (a to c) Percentages of CD4+ T cells in the TCM/TTM subsets (blue circles) and TEM subsets (red circles) in resting phase (G0) (a), growth phase (G1) (b), and DNA synthesis phase (S) and mitosis phase (M) (c) of the cell cycle from virally suppressed HIV-infected individuals (bars indicate means with SD from a Wilcoxon matched-pair signed-rank test [n = 17]). (d) Percentages of cells in the cycle are represented with the equation [(G1 + G2 + M + S)/(G0 + G1 + G2 + M + S)] × 100, which shows significantly more cycling cells in the TEM subset than in other subsets (bars indicate means with SD from a Wilcoxon matched-pair signed-rank test [n = 17]). (e to i) Percentages of cells in the TCM (blue circles), TTM (orange circles), and TEM (red circles) subsets positive for HLA-DR (n = 45) (e) or coexpressing CD38/HLA-DR (n = 45) (f), PD-1 (n = 45) (g), Ki67 (n = 57) (h), or CD127 (n = 40) (i). P values are indicated from a Mann-Whitney test. Measurements were based upon the availability of cells from each cohort.
FIG 4
FIG 4
The HDAC pathway expressed in the TEM subset is correlated with the induction of HIV msRNA. Heatmaps of the leading-edge genes, enriched among the genes correlated with the induction of HIV msRNA measured by TILDA (left) and with the levels of integrated HIV DNA on sorted CD4+ TCM and TEM subsets from the Florida cohort (right), by running GSEA using the HDAC pathway gene set from the Pathway Interaction Database (PID; http://pid.nci.nih.gov/) and custom gene sets of chromatin remodeling (PubMed identifier, 29236683) as the database (P value < 0.05). Samples were ordered by increasing the expression of the genes associated with log10(TILDA) or log10(integrated HIV DNA) (mean rank ordering). The association between the mean rank and TILDA result is then tested with a Spearman correlation, and its P value and rho are indicated next to the TILDA result and integrated HIV DNA annotation bar. The increasing gene expression is associated with increasing TILDA values (P value = 0.007, rho = 0.6) and with integrated HIV (P value = 0.03, rho = 0.4). A Wilcox test is then performed to assess the difference in mean ranks between TEM and TCM cells. The Wilcox test P value is then indicated next to the cell subset annotation bar, and these genes show higher expression in TEM than in TCM cells (P value = 0.036).
FIG 5
FIG 5
In vitro model of HIV latency LARA recapitulates the dynamics of HIV infection in memory CD4+ T cell subsets. (a) Schematic of the LARA model. On day 0, resting memory CD4+ T cells are enriched and allowed to rest before infection on day 3 with the full-length replication-competent HIV clone 89.6. Immediately after spinoculation, cells are resuspended in IL-2 and saquinavir. Infected cells are incubated for an additional 3 days before being introduced into latency culture conditions on day 6. Latency culture medium contains TGF-β, IL-7, conditioned medium from the H-80 cell line, and an antiretroviral cocktail of saquinavir, efavirenz, and raltegravir. After 7 days, the latently infected cells are exposed to LRAs in the presence of the triple-antiretroviral cocktail. Latency reversal is quantified by assessing percentages of CD4 Gag+ cells by flow cytometry. (b) The memory cell subset distribution was monitored on days 0, 6, and 13 in LARA culture. The proportions of the population in the TCM, TTM, and TEM subsets at each time point are indicated in the pie slices (n = 23). (c) The contribution of each subset to the pool of HIV-infected cells was determined. On day 13, latently infected cells generated in the LARA were sorted into TCM, TTM, and TEM populations and were assessed for the presence of integrated HIV DNA by quantitative PCR. The contribution of each subset is expressed as the frequency of integrated HIV DNA by the proportion of cells present in each subset in the total population. Paired t test P values are indicated (error bars indicate SD; n = 3).
FIG 6
FIG 6
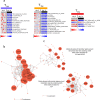
Transcriptional profiling of memory subsets from LARA cultures. (a) Pathways significantly (P value < 5%) enriched among the genes differentially expressed in a comparison of day 14 to day 0 results for TCM, TTM, and TEM cells, respectively, by GSEA. The expression of pathways in each sample is represented by their z-scores, calculated using SLEA. The rows represent pathways, and columns represent samples. (b) GSEA of the genes differentially expressed between the TEM and TCM subsets in the LARA in vitro (day 14) culture using the Hallmark gene sets of MSigDB. Represented are the network of genes of the Hallmark allograft rejection pathway and the IL-2 STAT5 signaling pathway upregulated in effector memory cells (TEM) (P values < 5%), with edges inferred by GeneMANIA showing coexpression between genes, with certain genes of the pathways highlighted in larger nodes. (c) GSEA of the genes differentially expressed between TEM and TCM subsets in LARA in vitro culture, using the gene sets that share transcription factor binding sites defined in the C3 gene sets (TRANSFAC version 7.4) of MSigDB. The gene sets upregulated in TEM cells at a P value of <0.05 were grouped into related modules by the enrichment map strategy. Modules were defined if gene sets had an overlap of at least 25% genes between them. The genes represented in at least 50% of gene sets of a module and the edges inferred by GeneMANIA as being coexpression between genes are represented.
FIG 7
FIG 7
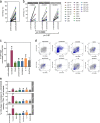
LRAs induce differential responses in different memory CD4+ T cell subsets. (a) Anti-CD3 (αCD3) CD28-activated cells generated in the LARA show a significant increase in the CD4 Gag+ population over the background level (each circle represents a unique donor in individual assays; paired Wilcoxon rank sum test; n = 23, P < 0.0001). The mean of unstimulated cells is 3%, and the mean of anti-CD3- and CD28-activated cells is 28%. The median fold change in CD4 Gag+ expression induced by anti-CD3 and CD28 antibodies is 12-fold. (b) Latency reversal was assessed in the CD4+ TCM, TTM, and TEM subsets after TCR stimulation with anti-CD3 and CD28 antibodies (paired Wilcoxon rank sum test, P < 0.001 for each memory subset). The mean of the CD4 Gag+ cell population in the TCM subset negative control was 2%, the mean of the TCR-activated cell population was 33%, and the median was a 14-fold change. The mean of the CD4 Gag+ cell population in the TTM subset negative control was 6%, the mean of the TCR-activated cell population was 28%, and the median was a 4-fold change. The mean of the CD4 Gag+ cell population in the TEM negative control was 6%, the mean of the TCR-activated cell population was 37%, and the median was a 9-fold change (n = 12). We examined different classes of LRAs for efficiency of latency reversal in the LARA. (c) Percentages of CD4 Gag+ cells within total memory CD4+ T cells after exposure to each compound were normalized to the percentage of the positive control with 1 μg/ml anti-CD3 and CD28 antibodies. LRA concentrations shown are 5 nM bryostatin (maroon bar), 1 μM SAHA (olive bar), 20 nM panobinostat (green bar), 5 nM romidepsin (blue bar), 500 ng/ml IL-15 (orange bar), and 1 μM disulfiram (dark-gray bar). n = 10. (Error bars indicate standard errors of the means [SEM]; asterisks indicate a P value of <0.05 in a comparison of the drug with the unstimulated controls, tested by a paired Wilcoxon rank sum test.) LRAs trigger different quantitative responses in memory CD4+ T cell subsets. (d) Representative flow plots show responses from one LARA donor. The x and y axes represent CD27 and CCR7 expression in the CD45RA memory compartment, respectively. Gray dots represent the entire memory population present in the sample overlaid with CD4 Gag+-expressing cells (purple) to show localization within the memory subsets. Each subset is identified within the flow cytometry plot. (e) Latency reversal efficiency from LARA donors in panel c was assessed in the TCM (top), TTM (middle), and TEM (bottom) subsets. The percentage of CD4 Gag+ cells expressed in each subset was normalized to the signal from the positive control with anti-CD3 and CD28 antibodies (n = 10; error bars indicate SEM; asterisks indicate a P value of <0.05 for a comparison of the drug with unstimulated controls, tested by a paired Wilcoxon rank sum test).
FIG 8
FIG 8
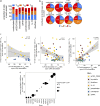
The TEM subset shows the greatest contribution to latency reversal from different classes of LRAs. (a) The effect of LRAs on the distribution of the memory CD4+ T cell subsets was assessed and is represented by the percentage of cells in each subset in the CD45RA population (bars indicate SEM; asterisks indicate a P value of <0.05 in a comparison of the drug with unstimulated controls in each memory subset, tested by a paired Wilcoxon rank sum test). (b) The contribution of the TCM, TTM, and TEM subsets to the overall CD4 Gag+ signal for each LRA was determined. Each pie slice was calculated using the frequency of cells in each memory subset from the CD4 Gag+ population. Frequency is indicated within each pie slice. n = 10. (c) Correlation between the percent change in CD4 Gag+ cells after LRA stimulation and the percent change in cells in the TEM, TTM, and TCM subsets after exposure to LRAs. Each circle represents an independent donor after administration of anti-CD3 CD28 (yellow), bryostatin (brown), disulfiram (gray), IL-15 (orange), panobinostat (green), romidepsin (blue), or SAHA (olive). P values of Spearman’s correlation test are indicated. (d) Genes of the HDAC gene sets expressed at day 14 in LARA in vitro culture in TCM and TEM cells correlated with the percentage of CD4 Gag+ cells measured postreactivation in TCM and TEM cells by anti-CD3 and CD28 antibody stimulation. The enrichment of gene sets was tested by GSEA using the PID HDAC pathway gene sets and custom gene sets as the database (enrichment P value < 0.05). The genes are represented on the x axis, and the Pearson correlation coefficient of each gene to the HIV msRNA is represented on the y axis. The size of the dots represents the log2 fold change of the gene in TEM cells compared to that in TCM cells.

Similar articles

Cited by

References

    1. Chomont N, El-Far M, Ancuta P, Trautmann L, Procopio FA, Yassine-Diab B, Boucher G, Boulassel MR, Ghattas G, Brenchley JM, Schacker TW, Hill BJ, Douek DC, Routy JP, Haddad EK, Sékaly RP. 2009. HIV reservoir size and persistence are driven by T cell survival and homeostatic proliferation. Nat Med 15:893–900. doi:10.1038/nm.1972. - DOI - PMC - PubMed
    1. Bacchus C, Cheret A, Avettand-Fenoel V, Nembot G, Melard A, Blanc C, Lascoux-Combe C, Slama L, Allegre T, Allavena C, Yazdanpanah Y, Duvivier C, Katlama C, Goujard C, Seksik BC, Leplatois A, Molina JM, Meyer L, Autran B, Rouzioux C, OPTIPRIM ANRS 147 Study Group . 2013. A single HIV-1 cluster and a skewed immune homeostasis drive the early spread of HIV among resting CD4+ cell subsets within one month post-infection. PLoS One 8:e64219. doi:10.1371/journal.pone.0064219. - DOI - PMC - PubMed
    1. Chomont N, DaFonseca S, Vandergeeten C, Ancuta P, Sekaly RP. 2011. Maintenance of CD4+ T-cell memory and HIV persistence: keeping memory, keeping HIV. Curr Opin HIV AIDS 6:30–36. doi:10.1097/COH.0b013e3283413775. - DOI - PubMed
    1. Yukl SA, Shergill AK, Ho T, Killian M, Girling V, Epling L, Li P, Wong LK, Crouch P, Deeks SG, Havlir DV, McQuaid K, Sinclair E, Wong JK. 2013. The distribution of HIV DNA and RNA in cell subsets differs in gut and blood of HIV-positive patients on ART: implications for viral persistence. J Infect Dis 208:1212–1220. doi:10.1093/infdis/jit308. - DOI - PMC - PubMed
    1. Buzon MJ, Sun H, Li C, Shaw A, Seiss K, Ouyang Z, Martin-Gayo E, Leng J, Henrich TJ, Li JZ, Pereyra F, Zurakowski R, Walker BD, Rosenberg ES, Yu XG, Lichterfeld M. 2014. HIV-1 persistence in CD4+ T cells with stem cell-like properties. Nat Med 20:139–142. doi:10.1038/nm.3445. - DOI - PMC - PubMed

Publication types