. 2019 Nov 15;294(46):17421-17436.
doi: 10.1074/jbc.RA119.009211. Epub 2019 Oct 2.

Comparative analysis of the catalytic regulation of NEDD4-1 and WWP2 ubiquitin ligases

Affiliations

Comparative analysis of the catalytic regulation of NEDD4-1 and WWP2 ubiquitin ligases

Hanjie Jiang et al. J Biol Chem. .

Abstract

NEDD4-1 E3 ubiquitin protein ligase (NEDD4-1) and WW domain-containing E3 ubiquitin ligase (WWP2) are HECT family ubiquitin E3 ligases. They catalyze Lys ubiquitination of themselves and other proteins and are important in cell growth and differentiation. Regulation of NEDD4-1 and WWP2 catalytic activities is important for controlling cellular protein homeostasis, and their dysregulation may lead to cancer and other diseases. Previous work has implicated noncatalytic regions, including the C2 domain and/or WW domain linkers in NEDD4-1 and WWP2, in contributing to autoinhibition of the catalytic HECT domains by intramolecular interactions. Here, we explored the molecular mechanisms of these NEDD4-1 and WWP2 regulatory regions and their interplay with allosteric binding proteins such as Nedd4 family-interacting protein (NDFIP1), engineered ubiquitin variants, and linker phosphomimics. We found that in addition to influencing catalytic activities, the WW domain linker regions in NEDD4-1 and WWP2 can impact product distribution, including the degree of polyubiquitination and Lys-48 versus Lys-63 linkages. We show that allosteric activation by NDFIP1 or engineered ubiquitin variants is largely mediated by relief of WW domain linker autoinhibition. WWP2-mediated ubiquitination of WW domain-binding protein 2 (WBP2), phosphatase and tensin homolog (PTEN), and p62 proteins by WWP2 suggests that substrate ubiquitination can also be influenced by WW linker autoinhibition, although to differing extents. Overall, our results provide a deeper understanding of the intricate and multifaceted set of regulatory mechanisms in the control of NEDD4-1-related ubiquitin ligases.

Keywords: E3 ubiquitin ligase; NEDD4 E3 ubiquitin protein ligase (NEDD4); Nedd4 family interaction protein (Ndfip1); WW domain-binding protein 2 (WBP2); WW domain-containing E3 ubiquitin protein ligase 2 (WWP2); allosteric regulation; enzyme; enzyme homeostasis; post-translational modification (PTM); ubiquitin.


Conflict of interest statement

The authors declare that they have no conflicts of interest with the contents of this article

Figures
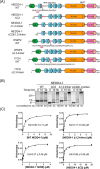
Figure 1.
Figure 1.
C2 and 1,2-linker autoinhibits NEDD4-1 through distinct molecular mechanisms. A, NEDD4-1, WWP2, and ITCH protein constructs used in this study. The red helix corresponds to the regulatory linker regions. B, ubiquitination assay of WT, ΔC2, Δ1,2-linker, and ΔC2&Δ1,2-linker NEDD4-1. The reaction was conducted at 30 °C with 5 mm MgCl2, 5 mm ATP, 100 μm WT ubiquitin, 50 nm E1, 1 μm E2 (UbcH5c), and 1 μm E3. The reactions were quenched at 0, 10, and 30 min, and samples were analyzed by SDS-PAGE followed by colloidal Coomassie Blue staining. The activity of NEDD4-1 was determined based on the time-dependent depletion of the unmodified E3 ligase (average percentage is shown below the figure, and the averages ± S.D. are as follows (in %): 100, 66 ± 3, 49 ± 2; 100, 43 ± 9, 16 ± 4; 100, 36 ± 6, 10 ± 1; and 100, 26 ± 4, 4 ± 1) and the appearance of high-molecular-weight bands presumed to represent the ubiquitination product. All of the assays were repeated at least twice (n ≥ 2) and showed good reproducibility. C, affinity of fluorescein-labeled F-Ubv1 (Ubv NL.1) for NEDD4-1 forms of WT, Δ1,2-linker, T229E, and ΔC2, respectively, was measured by fluorescence anisotropy. Kd values were obtained using quadratic fits and are shown ±S.E. (n = 2). Two replicates for this assay were conducted with similar Kd values.
Figure 2.
Figure 2.
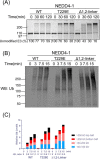
NEDD4-1 autoubiquitination product patterns are regulated by the 1,2-linker. A, ubiquitination assays of WT, T229E, and Δ1,2-linker NEDD4-1. The reactions were conducted as in Fig. 1B with quenching times at 0, 30, 60, and 120 min. The activity of NEDD4-1 was determined based on the time-dependent depletion of the unmodified E3 ligase (average percentages are shown below the figure, and the averages ± S.D. are as follows (in %): 100, 77 ± 1, 70 ± 1, 59 ± 1; 100, 76 ± 1, 60 ± 3, 38 ± 3; and 100, 43 ± 3, 30 ± 4, 16 ± 4). The appearance of high-molecular-weight bands presumably represents the ubiquitination product. B, immunoblot analysis of the ubiquitination assay of WT, T229E, and Δ1,2-linker NEDD4-1 using antiubiquitin (P4D1) antibody. The reactions were quenched at 0, 3, 7.5, and 15 min. WB, Western blot; Ub, ubiquitin. C, densitometry analysis of NEDD4-1 ubiquitination. The ubiquitination density was quantified based on four different regions. The H/L ratio represents the large molecular weight ubiquitination product versus the smaller molecular weight ubiquitination product. The H/L is calculated as the ratio of (>250 kDa top half)/(100–150 kDa). All of the assays were repeated at least twice (n ≥ 2) and showed good reproducibility.
Figure 3.
Figure 3.
1,2-Linker regulations of NEDD4-1 autoubiquitination product patterns are modulated by the E3 ubiquitin exosite and Lys-63 linkage. A, ubiquitination assay of WT, Δ1,2-linker, and WT NEDD4-1 plus Ubv NL.1 (Ubv1, 5 μm) carried out as in Fig. 1B with quenching at 0, 30, 60, and 120 min. The activity of NEDD4-1 was determined based on the time-dependent depletion of the unmodified E3 ligase (average percentages are shown below the figure, and the averages ± S.D. are as follows (in %): 100, 72 ± 1, 68 ± 4, 61 ± 5; 100, 22 ± 7, 13 ± 4, 10 ± 2; and 100, 30 ± 7, 23 ± 4, 16 ± 4). The appearance of high-molecular-weight bands presumably represents the ubiquitination product. B, immunoblot analysis of ubiquitination assay of WT, Δ1,2-linker, and WT NEDD4-1 plus Ubv1 (5 μm) using antiubiquitin antibody. The reactions for WT NEDD4-1 were quenched at 0, 15, 30, and 60 min. The reactions for Δ1,2-linker and WT NEDD4-1 plus Ubv1 were quenched at 0, 3, 7.5, and 15 min. C, densitometry analysis of NEDD4-1 ubiquitination. The ubiquitination density was quantified, and the H/L ratio was calculated as in Fig. 2C. D, ubiquitination assays of WT and Δ1,2-linker NEDD4-1 in the absence or presence of Ubv NL.1 (Ubv1, 5 μm) were conducted as in Fig. 1B. The reactions were quenched at 0, 10, and 30 min. The activity of NEDD4-1 was determined based on the time-dependent depletion of the unmodified E3 ligase (average percentages are shown below the figure, and the averages ± S.D. are as follows (in %): 100, 60 ± 5, 47 ± 6; 100, 50 ± 1, 32 ± 3; 100, 35 ± 1, 13 ± 7; and 100, 32 ± 3, 10 ± 1). The appearance of high-molecular-weight bands presumably represents the ubiquitination product. E, ubiquitination assays of WT, Δ1,2-linker, and T229E NEDD4-1 were conducted as in Fig. 1B, except K48R or K63R ubiquitin was used instead of WT ubiquitin. The reactions were quenched at 0, 30, and 120 min. The activity of NEDD4-1 was determined based on the time-dependent depletion of the unmodified E3 ligase (average percentages are shown below the figure, and the averages ± S.D. are as follows (in %): 100, 55 ± 1, 39 ± 5; 100, 5 ± 1, 4 ± 1; 100, 49 ± 1, 31 ± 2; 100, 73 ± 2, 53 ± 2; 100, 37 ± 5, 9 ± 4; and 100, 72 ± 3, 45 ± 6). The appearance of high-molecular-weight bands presumably represents the ubiquitination product. F, immunoblot analysis of the ubiquitination assay of WT, Δ1,2-linker, and T229E NEDD4-1 in Fig. 3E using antiubiquitin (P4D1) antibody. All of the assays were repeated at least twice (n ≥ 2) and showed good reproducibility. WB, Western blot; Ub, ubiquitin.
Figure 4.
Figure 4.
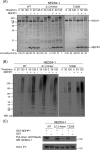
NEDD4-1 autoubiquitination product patterns are regulated by NDFIP1. A, ubiquitination assays of WT, Δ1,2-linker, and T229E NEDD4-1 were conducted as in Fig. 1B, in the absence or presence of NDFIP1 (2.5 μm). The reactions were quenched at 0, 30, and 120 min. The activity of NEDD4-1 was determined based on the time-dependent depletion of the unmodified E3 ligase (average percentages are shown below the figure, and the averages ± S.D. are as follows (in %): 100, 76 ± 3, 60 ± 4; 100, 72 ± 3, 46 ± 4; 100, 24 ± 5, 4 ± 2; 100, 37 ± 1, 7 ± 1; 100, 64 ± 3, 35 ± 1; and 100, 63 ± 5, 30 ± 1). The appearance of high-molecular-weight bands presumably represents the ubiquitination product. B, immunoblot analysis of ubiquitination assays in A using antiubiquitin antibody. C, affinity pulldown assays were conducted using GST–NDFIP1 (2 μm) with WT, Δ1,2-linker, and T229E NEDD4-1 (1.5 μm). GST (2 μm) was used as a negative control in the pulldown assay. All of the assays were repeated at least twice (n ≥ 2) and showed good reproducibility. WB, Western blot; Ub, ubiquitin.
Figure 5.
Figure 5.
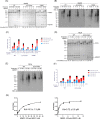
WWP2 and ITCH autoubiquitination product patterns are regulated by the 1,2-linker and NDFIP1. A, ubiquitination assays of WT, Δ2,3-linker, and Y369E WWP2 in the absence or presence of NDFIP1 (2.5 μm). The reactions were conducted as in Fig. 1B with quenching times indicated. The activity of WWP2 was determined based on the time-dependent depletion of the unmodified E3 ligase (average percentages are shown below the figure, and the averages ± S.D. are as follows (in %): 100, 66 ± 1, 47 ± 1; 100, 26 ± 7, 7 ± 5; 100, 49 ± 11, 10 ± 1; 100, 67 ± 7, 34 ± 1; 100, 46 ± 6, 15 ± 5; and 100, 20 ± 1, 2 ± 1). The appearance of high-molecular-weight bands presumably represents the ubiquitination product. B, immunoblot analysis of ubiquitination assays of WT, Δ2,3-linker, and Y369E WWP2 in the absence or presence of NDFIP1 (2.5 μm) using antiubiquitin antibody. C, densitometry analysis of WWP2 ubiquitination assays in B. The ubiquitination density was quantified, and the H/L ratio was calculated as in Fig. 2C. D, ubiquitination assays of WT and Δ2,3-linker ITCH in the absence or presence of NDFIP1 (2.5 μm) as in Fig. 1B with quenching times at 0, 10, and 30 min. The activity of ITCH was determined based on the time-dependent depletion of the unmodified E3 ligase (average percentages are shown below the figure, and the averages ± S.D. are as follows (in %): 100, 73 ± 5, 50 ± 6; 100, 52 ± 6, 24 ± 2; 100, 41 ± 3, 10 ± 1; and 100, 40 ± 6, 11 ± 1). The appearance of high-molecular-weight bands presumably represents the ubiquitination product. E, immunoblot analysis of ubiquitination assays of WT and Δ2,3-linker ITCH using antiubiquitin antibody. F, densitometry analysis of ITCH ubiquitination assay in E. The ubiquitination density was quantified, and the H/L ratio was calculated as in Fig. 2C. All of the assays were repeated at least twice (n ≥ 2) and showed good reproducibility. G, affinity of fluorescein-labeled F-Ubv2 (Ubv P2.3) for ΔC2 WWP2 was measured by fluorescence anisotropy, in the absence or presence of NDFIP1 (5 μm), respectively. Kd values were obtained using quadratic fits and are represented as ±S.E. (n = 2). WB, Western blot; Ub, ubiquitin.
Figure 6.
Figure 6.
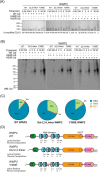
WWP2 autoubiquitination Lys site-selectivity. A, ubiquitination assays of WT, Δ2,3-linker, and Y369E WWP2. The reaction was conducted as in Fig. 1B with WT ubiquitin, K48R ubiquitin, or K63R ubiquitin used in the assay, respectively. The reactions were quenched at the indicated times. The activity of WWP2 was determined based on the time-dependent depletion of the unmodified E3 ligase (average percentages are shown below the figure, and the averages ± S.D. are as follows (in %): 100, 78 ± 1, 55 ± 5; 100, 65 ± 2, 39 ± 3; 100, 53 ± 5, 11 ± 2; 100, 78 ± 9, 44 ± 9; 100, 44 ± 2, 14 ± 1; 100, 25 ± 1, 3 ± 1; 100, 72 ± 2, 28 ± 1; 100, 55 ± 4, 23 ± 2; 100, 31 ± 8, 2 ± 1). The appearance of high-molecular-weight bands presumably represent ubiquitination product. B, immunoblot analysis of the ubiquitination assays of WT, Δ2,3-linker, Y369E WWP2 with WT, K48R or K63R ubiquitination using antiubiquitin antibody. All of the assays were repeated at least twice (n ≥ 2) and showed good reproducibility. C, ubiquitin chain linkage of WWP2 autoubiquitination was analyzed by LC-MS/MS. The ubiquitination assays of WT, Δ2,3-linker, and Y369E WWP2 were conducted as in Fig. 1B. D, Lys ubiquitination sites of WT, Δ2,3-linker, and Y369E WWP2 autoubiquitination were analyzed by LC-MS/MS. The representative Lys sites were mapped on the constructs, and the relative percentages were calculated based on MS peptide-spectrum match counts. WB, Western blot; Ub, ubiquitin.
Figure 7.
Figure 7.
WWP2 ubiquitination of p62, PTEN, and WBP2. A, substrate p62 (5 μm) ubiquitination assays with WT, WT with NDFIP1 (2.5 μm), WT with Ubv (5 μm), and Y369E WWP2 were conducted as indicated in Fig. 1B. The unmodified E3 ligase or substrate is shown in average percentage below the figure. The averages ± S.D. for WWP2 are as follows (in %): 100, 81 ± 6, 59 ± 2; 100, 56 ± 8, 40 ± 6; 100, 16 ± 7, 3 ± 1; and 100, 50 ± 1, 21 ± 1. The averages ± S.D. for p62 are as follows (in %): 100, 44 ± 7, 16 ± 5; 100, 43 ± 6, 18 ± 6; 100, 37 ± 13, 11 ± 4; and 100, 33 ± 12, 8 ± 3. The immunoblot analysis of the p62 ubiquitination was performed using anti-GST tag antibody. B, substrate PTEN (5 μm) ubiquitination assays with WT, WT with NDFIP1 (1 μm), and WT with Ubv (5 μm) and Y369E WWP2 were conducted as indicated in Fig. 1B. The immunoblot analysis of the PTEN ubiquitination was performed using anti-PTEN antibody. The average percentages of the unmodified E3 ligase or substrate are shown below the figure. The averages ± S.D. for WWP2 are as follows (in %): 100, 67 ± 3, 45 ± 1; 100, 8 ± 2, 2 ± 1; 100, 2 ± 1, 0 ± 1; and 100, 7 ± 2, 2 ± 1. The averages ± S.D. for PTEN are as follows (in %): 100, 80 ± 2, 73 ± 1; 100, 72 ± 6, 63 ± 8; 100, 69 ± 4, 61 ± 2; and 100, 73 ± 3, 66 ± 1. C, substrate WBP2 ubiquitination assays with WT, Δ1,2-linker, and Y369E WWP2 were performed. The immunoblot analysis of the ubiquitination assay was performed using anti-His tag antibody. D, quantification of the immunoblot results is as shown in C. Bands representing different ubiquitinated species band were quantified using ImageJ. Data points represent the percentage of each WBP2 species in the reaction at the indicated time points. All of the assays were repeated at least twice (n ≥ 2) and showed good reproducibility. WB, Western blot.
Figure 8.
Figure 8.
WBP2 ubiquitination using K63R Ub and WBP2/NDFIP1 Binding to WWP2. A, WBP2 (5 μm) ubiquitination assay with WT and Δ1,2-linker WWP2 using K63R Ub mutant. The immunoblot analysis of the ubiquitination assay was performed using anti-His tag antibody. B, F-WBP2 protein ran on an SDS-polyacrylamide gel that was imaged by Typhoon fluorescence imager or colloidal Coomassie Blue showing the fluorescent signal after the N-terminal labeling. All of the assays were repeated at least twice (n ≥ 2) and showed good reproducibility. C, affinity of fluorescein-labeled F-WBP2 for ΔC2 WWP2 was measured by fluorescence anisotropy. Kd value was obtained using quadratic fits and is represented as ±S.E. (n = 2). D, NDFIP1 competition binding was measured by fluorescent anisotropy. Unlabeled NDFIP1 was titrated and incubated with F-WBP2 (100 nm) and ΔC2 WWP2 (5.7 μm) before measuring fluorescent anisotropy changes. IC50 value is represented as ±S.E. (n = 2). IC50 (∼2.3 μm) and Ki (∼2.0 μm) were calculated as described under “Experimental procedures.” There were two replicates for this assay that were conducted with similar IC50 values.
Figure 9.
Figure 9.
Proposed linker regulation mechanism of NEDD4-1. NEDD4-1 is maintained in an autoinhibitory state by the linker between the WW1 and WW2 domains. The mechanism of autoinhibition appears to involve HECT domain exosite occupancy. Upon linker phosphorylation or binding with the HECT enzyme regulatory protein NDFIP1 protein, NEDD4-1 linker autoinhibition is relieved.

Similar articles

Cited by

References

    1. Rotin D., and Kumar S. (2009) Physiological functions of the HECT family of ubiquitin ligases. Nat. Rev. Mol. Cell Biol. 10, 398–409 10.1038/nrm2690 - DOI - PubMed
    1. Berndsen C. E., and Wolberger C. (2014) New insights into ubiquitin E3 ligase mechanism. Nat. Struct. Mol. Biol. 21, 301–307 10.1038/nsmb.2780 - DOI - PubMed
    1. Ingham R. J., Gish G., and Pawson T. (2004) The Nedd4 family of E3 ubiquitin ligases: functional diversity within a common modular architecture. Oncogene 23, 1972–1984 10.1038/sj.onc.1207436 - DOI - PubMed
    1. Bernassola F., Karin M., Ciechanover A., and Melino G. (2008) The HECT family of E3 ubiquitin ligases: multiple players in cancer development. Cancer Cell 14, 10–21 10.1016/j.ccr.2008.06.001 - DOI - PubMed
    1. Buetow L., and Huang D. T. (2016) Structural insights into the catalysis and regulation of E3 ubiquitin ligases. Nat. Rev. Mol. Cell Biol. 17, 626–642 10.1038/nrm.2016.91 - DOI - PMC - PubMed

Publication types

MeSH terms