. 2019 Oct 25:20:119-136.
doi: 10.1016/j.isci.2019.09.018. Epub 2019 Sep 14.

Deep Learning Implicitly Handles Tissue Specific Phenomena to Predict Tumor DNA Accessibility and Immune Activity

Affiliations

Deep Learning Implicitly Handles Tissue Specific Phenomena to Predict Tumor DNA Accessibility and Immune Activity

Kamil Wnuk et al. iScience. .

Abstract

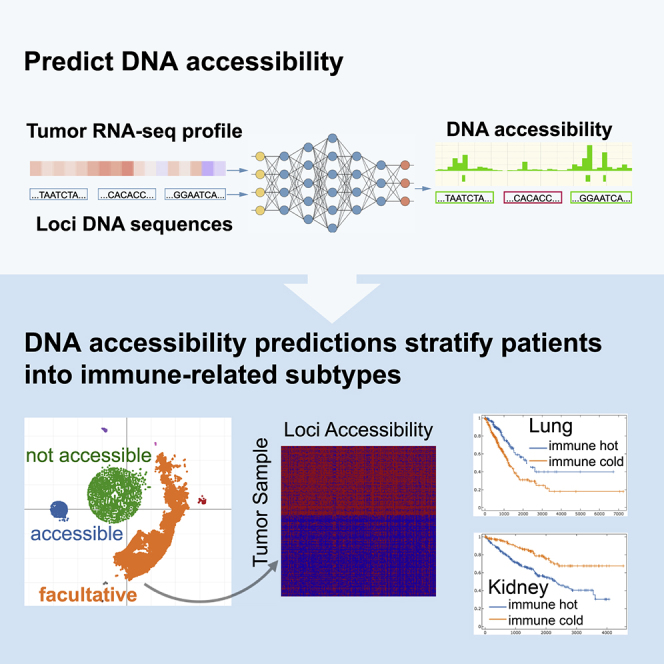
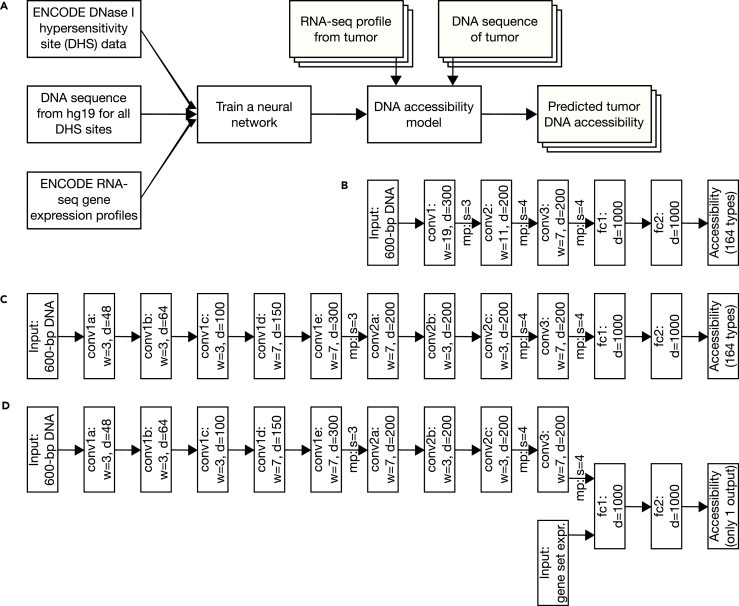
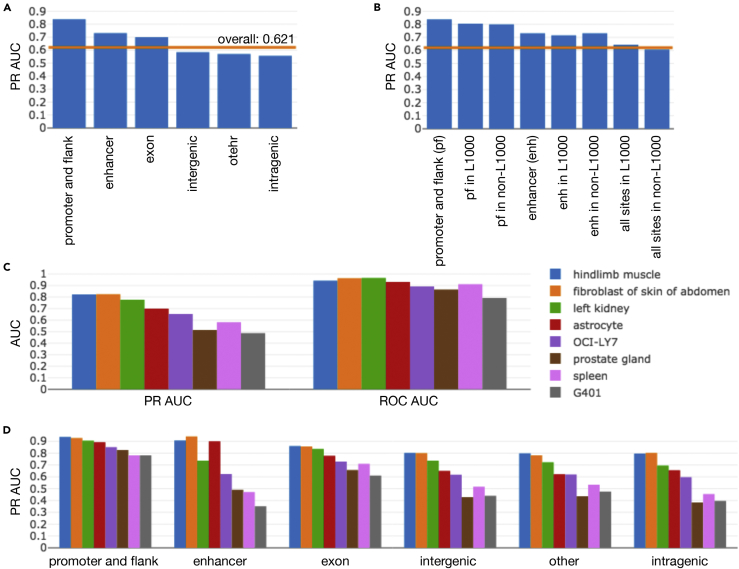
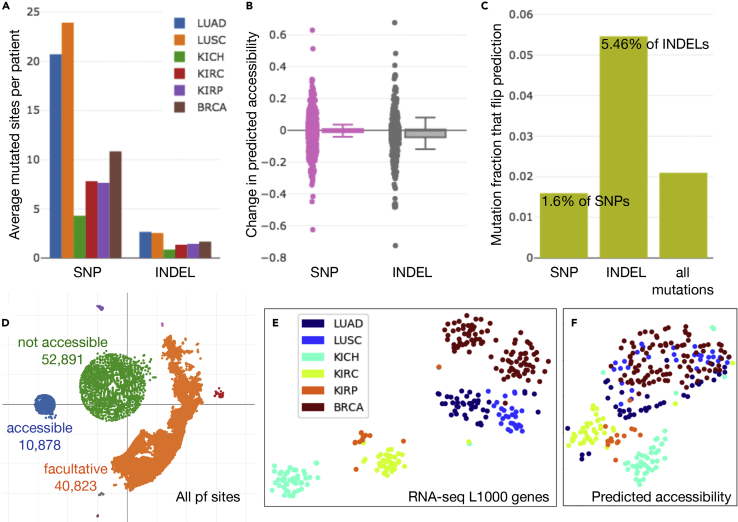
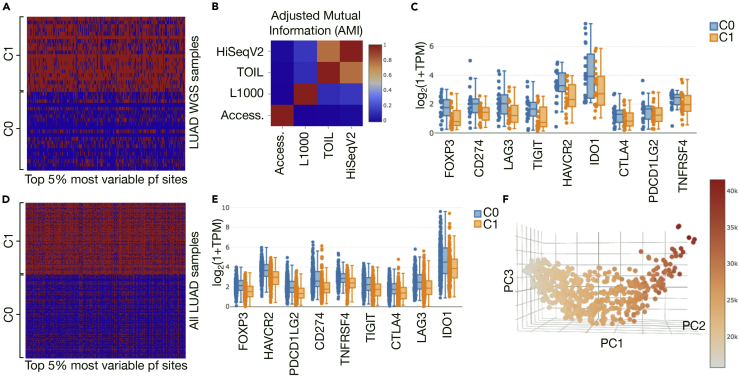
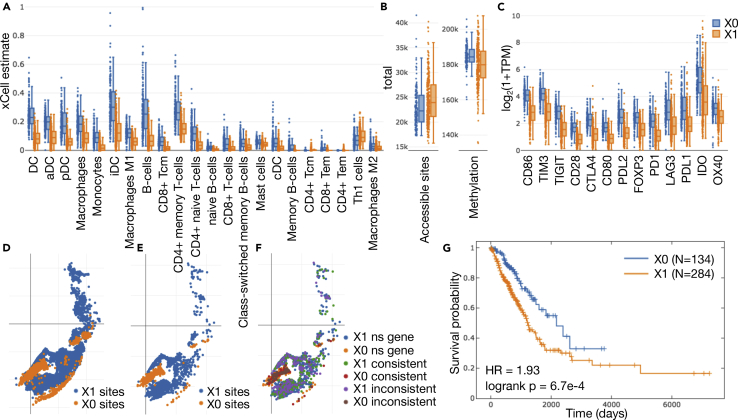
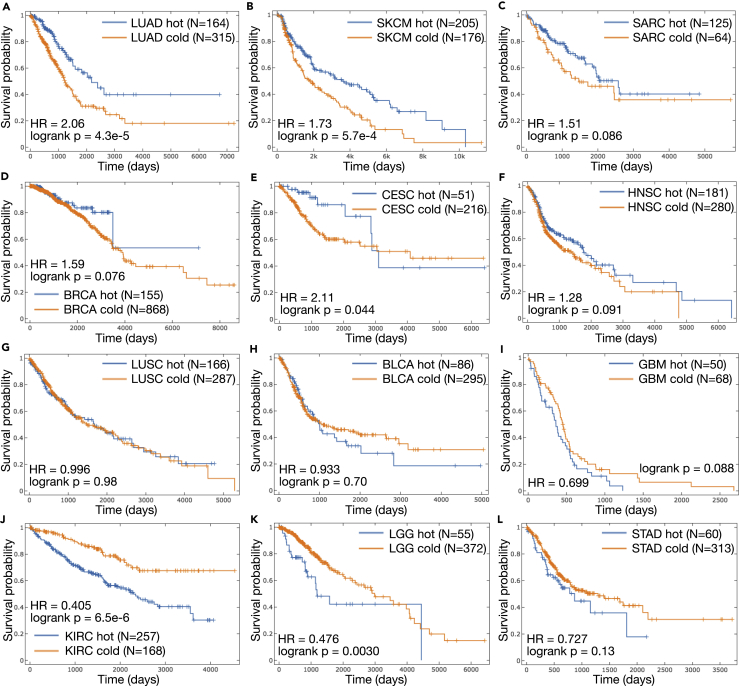
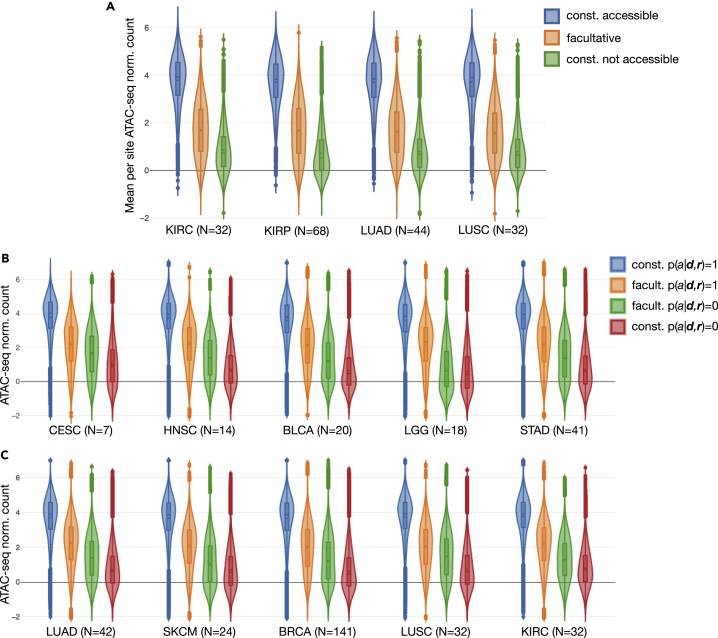
DNA accessibility is a key dynamic feature of chromatin regulation that can potentiate transcriptional events and tumor progression. To gain insight into chromatin state across existing tumor data, we improved neural network models for predicting accessibility from DNA sequence and extended them to incorporate a global set of RNA sequencing gene expression inputs. Our expression-informed model expanded the application domain beyond specific tissue types to tissues not present in training and achieved consistently high accuracy in predicting DNA accessibility at promoter and promoter flank regions. We then leveraged our new tool by analyzing the DNA accessibility landscape of promoters across The Cancer Genome Atlas. We show that in lung adenocarcinoma the accessibility perspective uniquely highlights immune pathways inversely correlated with a more open chromatin state and that accessibility patterns learned from even a single tumor type can discriminate immune inflammation across many cancers, often with direct relation to patient prognosis.

Keywords: Bioinformatics; Cancer; Neural Networks.


Conflict of interest statement

This work was funded by NantWorks affiliates (ImmunityBio, NantOmics, NantHealth) and performed by its employees; there are no other conflicts of interest.

Figures

None
Graphical abstract
Figure 1
Figure 1
Overview of Our Pipeline from Training to Application (A) DHS, hg19 DNA, and RNA-seq information are all used to train the neural network. With tumor RNA-seq and DNA-seq data input the DNA accessibility model can then be used to predict chromatin state in tumors. (B–D) (B) The neural network architectures for the tissue-specific baseline model, (C) the tissue-specific factorized convolutions model, and (D) the expression-informed model are shown. Depth (d) is provided for all fully connected (fc) layers. Convolution (conv) layers also list their width (w). Max pooling (mp) is indicated where present between layers and is always applied with equal size and stride (s). See also Figures S1, S3, and S4.
Figure 2
Figure 2
Promoter and Promoter Flank Accessibility Is Highly Predictable, but Enhancers Show Variability (A) Promoter flank (pf) accessibility is highly predictable (PR AUC = 0.839), as shown by the genomic site performance breakdown over all samples in the held-out tissues test set. The orange line indicates overall PR AUC computed across all test samples and all sites. (B) No clear performance difference was observed when genomic sites across the held-out tissue test set were split into those that did (in L1000) and did not (non-L1000) overlap the L1000 RNA-seq input gene set. Note that not all sites overlapped with known gene regions, so the union of the L1000 and non-L1000 subsets did not always make up the complete set of sites of a certain type. (C) Overall metrics separated by tissue type show that some held-out tissues in the test set were more challenging as reflected by lower AUCs. (D) Predictions at enhancers were highly variable between samples, even with good PR AUC, and performance on pf regions remained consistently high, even for tissues where overall results were lowest.
Figure 3
Figure 3
SNP and INDEL Mutations and Predicted Accessibility Landscape in Tumors (A) The average number of SNP and insertion or deletion (INDEL) mutations that overlap prediction sites per patient across six TCGA cohorts is shown. (B) When predictions at sites with mutations were compared with and without applying mutations to the input DNA sequence, the change in predicted accessibility exhibited a higher variance for INDELs than SNPs. (C) In addition, a larger fraction of sites with INDELs were responsible for a change in the classification decision (flipped prediction) than the fraction of sites with SNPs. (D) Using t-SNE (perplexity = 50) to visualize the predicted accessibility of individual promoter flank (pf) sites across our selected TCGA samples, we identified which sites were facultative (orange), constitutively accessible (blue), and constitutively not accessible (green). (E and F) (E) Finally, t-SNE applied to patient samples exhibited different relationships (such as a clear split in BRCA samples) when based on RNA-seq gene expression of the L1000 gene set, than (F) when based on predicted accessibility at all pf sites within each sample (in which case lung and breast cancers appeared to share some common characteristics).
Figure 4
Figure 4
Promoter and Promoter Flank Accessibility and Checkpoint Gene Expression in LUAD WGS Samples Only and Augmented with Non-WGS Samples (A) The heatmap and patient sample cluster assignment based on the top 5% most variable promoter and promoter flank (pf) accessibility sites across LUAD samples with WGS available are shown. Cluster 0 (C0) has lower overall accessibility (blue = not accessible), and cluster 1 (C1) exhibits generally higher accessibility (red = accessible). (B) Adjusted mutual information (AMI) (1) between label assignments based on different data shows higher values (red) between different RNA-seq cluster assignments and low values (blue) between accessibility (Access.) and clusters based on any other data type. (C) Distribution of key checkpoint gene expression levels (with x axis sorted by significance of two-sided t test between C0 and C1) shows that the low-accessibility group tends to have higher checkpoint levels. (D) Applying the same procedure to the full LUAD cohort, which also includes predictions for all non-WGS samples, we see a similar split into low- (C0) and high (C1)-accessibility groups. (E) The same trend in checkpoint expression is observed, with FOXP3 again appearing as the most significant difference (two-sided t test with Benjamini-Hochberg adjusted p = 4.53 × 10−19). (F) Plotting promoter and flank accessibility with respect to its first three principal components (PC1–3) and coloring points by total number of accessible sites in a sample reveals a smoothly varying relationship, motivating a correlation-based approach to exploring the relationship between overall accessibility and gene expression levels.
Figure 5
Figure 5
Enrichment in LUAD xCell-Derived Clusters (after Adding a Small Margin) by Cell Type, Checkpoint Expression, Methylation, Accessibility, and Survival (A) Cell type enrichment distributions sorted by significance of two-sided t test for the two clusters (X0, X1), based on xCell lymphoid and myeloid cells, with Benjamini-Hochberg adjusted p value < 1.0 × 10−5 are shown. (B) Total number of accessible promoter and promoter flank sites in each sample by cluster (two-sided t test p = 1.07 × 10−3) along with total methylation (two-sided t test p = 1.29 × 10−7). (C) Checkpoint expression distributions, likewise sorted by significance, also point to a general difference in immune landscape between the two groups. (D and E) (D) All sites with differences in accessibility based on a two-sided t test with Benjamini-Hochberg adjusted p values < 0.01 and (E) < 1.0 × 10−5 are illustrated on the t-SNE plot of promoter and promoter flank facultative sites. Sites with a difference satisfying the thresholds were assigned to the cluster in which they were more accessible. (F) Accessibility differences are further broken down by how they align with direction of upregulation of corresponding nearby genes (ns gene, no significant difference in matching gene; consistent, direction of significant accessibility and gene expression differences are consistent; inconsistent, direction of significant accessibility and gene expression are inconsistent). (G) Kaplan-Meier plots demonstrate better survival among X0 (immune hot) patients, shown with log rank test p value and hazard ratio (HR) based on a Cox proportional hazards (CoxPH) model regression using class assignment as the only explanatory variable. See also Figures S6 and S7, and Tables S4–S7.
Figure 6
Figure 6
Application of the Three SVM Ensembles for Classification of Immune-Hot Tumors (Trained on Subsets of LUAD) with the Only Input Being a Vector of 484 Promoter and Flank Predicted Accessibility Decisions All Kaplan-Meier plots show group size (N) for patients of both predicted immune activity classes (hot/cold) that satisfy a confidence threshold (see Transparent Methods). Also provided are log rank test p values and hazard ratio (HR) based on a Cox proportional hazards (CoxPH) model regression using class assignment as the only explanatory variable. Note that the time axis range on subplots varies by cohort and that the immune-hot state learned based on LUAD is not always beneficial for patient survival in other tumor types. Tumor types included (A) LUAD, lung adenocarcinoma; (B) SKCM, skin cutaneous melanoma; (C) SARC, sarcoma; (D) BRCA, breast invasive carcinoma; (E) CESC, cervical squamous cell carcinoma and endocervical adenocarcinoma; (F) HNSC, head and neck squamous cell carcinoma; (G) LUSC, lung squamous cell carcinoma; (H) BLCA, bladder urothelial carcinoma; (I) GBM, glioblastoma multiforme; (J) KIRC, kidney renal clear cell carcinoma; (K) LGG, brain lower grade glioma; and (L) STAD, stomach adenocarcinoma. See also Figure S8.
Figure 7
Figure 7
Validation of Our Promoter and Promoter Flank DNA Accessibility Predictions in TCGA with Empirical ATAC-Seq Measurements (A) The top violin plots show the distributions of per ATAC-seq peak means of normalized counts in lung and kidney cohorts, for sites we labeled as constitutively (const.) accessible, facultative, or const. not accessible (based on our analysis shown in Figure 3D). Peak count values along all y axes were log transformed and quantile normalized as provided by the authors of the empirical study. (B and C) Distributions of ATAC-seq peak normalized counts for all prediction sites across all available samples were further broken down per cohort by classification decision (accessible, p(a|d,r)=1, and not accessible, p(a|d,r)=0) in addition to site category. Site categories were either facultative (facult.) or constitutive (const.), the latter including both const. accessible as well as const. not accessible. The number of TCGA samples that contributed to each plot is shown (N = ). (B and C) Only TCGA samples for which we had made predictions and were also empirically measured were used, but (A) utilized all available measured samples. The distribution plots were informed by N * 61,342 data points in (B and C), whereas for (A), where we considered the mean value for each site, there were only 61,342 data points total within each cohort.

Similar articles

Cited by

References

    1. Alipanahi B., Delong A., Weirauch M.T., Frey B.J. Predicting the sequence specificities of DNA- and RNA-binding proteins by deep learning. Nat. Biotechnol. 2015;33:831–838. - PubMed
    1. Angermueller C., Lee H.J., Reik W., Stegle O. DeepCpG: accurate prediction of single-cell DNA methylation states using deep learning. Genome Biol. 2017;18:67. - PMC - PubMed
    1. Aran D., Hu Z., Butte A.J. xCell: digitally portraying the tissue cellular heterogeneity landscape. Genome Biol. 2017;18:220. - PMC - PubMed
    1. Bahdanau D., Cho K., Bengio Y. Neural machine translation by jointly learning to align and translate. arxiv.org. 2014 arXiv:1409.0473.
    1. Berson A., Nativio R., Berger S.L., Bonini N.M. Epigenetic regulation in neurodegenerative diseases. Trends Neurosci. 2018;41:587–598. - PMC - PubMed

LinkOut - more resources