. 2019 Sep 27;10(1):4400.
doi: 10.1038/s41467-019-12398-w.

Connective tissue fibroblasts from highly regenerative mammals are refractory to ROS-induced cellular senescence

Affiliations

Connective tissue fibroblasts from highly regenerative mammals are refractory to ROS-induced cellular senescence

Sandeep Saxena et al. Nat Commun. .

Abstract

A surveillance system in mammals constantly monitors cell activity to protect against aberrant proliferation in response to damage, injury and oncogenic stress. Here we isolate and culture connective tissue fibroblasts from highly regenerative mammals (Acomys and Oryctolagus) to determine how these cells interpret signals that normally induce cellular senescence in non-regenerating mammals (Mus and Rattus). While H2O2 exposure substantially decreases cell proliferation and increases p53, p21, p16, and p19 in cells from mice and rats, cells from spiny mice and rabbits are highly resistant to H2O2. Quantifying oxygen consumption and mitochondrial stability, we demonstrate that increased intracellular H2O2 is rapidly detoxified in regenerating species, but overwhelms antioxidant scavenging in cells from non-regenerative mammals. However, pretreatment with N-acetylcysteine (NAC) protects mouse and rat cells from ROS-induced cellular senescence. Collectively, our results show that intrinsic cellular differences in stress-sensing mechanisms partially explain interspecific variation in regenerative ability.


Conflict of interest statement

The authors declare no competing interests.

Figures
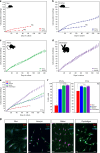
Fig. 1
Fig. 1
Fibroblasts from Acomys, Rattus, and Oryctolagus exhibit enhanced proliferative ability. ad PDs for Mus, Acomys, Rattus,and Oryctolagus fibroblasts cultured under ambient (20%) and physiological (3%) O2. a, b 3% O2 enhances proliferative capacity of Mus and Acomys fibroblasts: Mus (n = 5) cell lines at 3% O2: PDs = 20.8 ± 0.93, vs. 20% O2: PDs = 4.4 ± 0.97 and Acomys (n = 5) cell lines at 3% O2: PDs = 60 ± 3.4 vs. 20% O2: PDs = 20.1 ± 0.34. cd O2 concentration did not affect mean proliferative ability of Rattus (n = 4) or Oryctolagus (n = 4) fibroblasts. e Cross-species comparison of proliferative ability at 3% O2 shows that Mus cells still senesce while fibroblasts from Acomys, Rattus, and Oryctolagus proliferate for at least 140 days. f At 20% O2, the proliferative population (EdU+) of P2 Mus cells (~25%) was significantly lower compared to Acomys (82%), Rattus (95%) and Oryctolagus (95%) (ANOVA, F = 143.3982, P < 0.0001) (n = 4/species). Percent EdU + cells in Acomys were slightly lower compared to Rattus (Tukey-HSD, t = −4.38, P = 0.0043) and Oryctolagus (Tukey-HSD, t = −4.87, P = 0.0019) (n = 4/species). At 3% O2, mean percent EdU + cells in P2 cultures are significantly lower in Mus (75%) compared to Acomys (88%), Rattus (91%) and Oryctolagus (91%) (ANOVA, F = 17.3085, Mus vs. Acomys, P = 0.0003, Mus vs. Rattus, P = 0.0023 and Mus vs. Oryctolagus, P = 0.0002) (n = 4/species). g P2 cells co-labeled with EdU and the general fibroblast marker Vimentin demonstrate that > 95% of cell cultures from all four species are fibroblasts (n = 4/species). Scale bars = 50 µm. Graphics for Acomys, Mus, and Rattus were made by corresponding author and the Oryctolagus image is available free for comercial use. ***P < 0.0001, **P < 0.001 and *P < 0.05. Error bars = S.E.M. Source data are provided as a Source Data file
Fig. 2
Fig. 2
In vitro resistance to senescence is not restricted to regenerating mammals. a, b In line with proliferative ability, cells cultured at 3% O2 were more resistant to cellular senescence. Percent SA-βgal + cells were measured in Mus, Acomys, Rattus, and Oryctolagus (n = 4–5 species) at progressive passages. Mus cells senesced at P13 and > 90% of cultures were SA-βgal+. There were significantly more SA-βgal + cells compared to Acomys (~37%), Rattus (~22%) and Oryctolagus (~4%) (P13 Tukey-HSD, Mus vs. Acomys, t = −23.81, P < 0.0001; Mus vs. Rattus, t = 29.29, P < 0.0001 Mus vs. Oryctolagus, t = 39.98, P < 0.0001). Red arrows indicate SA-βgal + cells (a). c Acomys and Mus fibroblasts (n = 3/species) from P2 co-labeled with γ-H2AX and EdU to differentiate senescent cells. Yellow arrows indicate nuclei positive for γ-H2AX and EdU and white arrows represent nuclei positive for EdU only. df P2 Acomys and Mus fibroblasts (n = 3) labeled with p16 (d), p53 (e), and p21 (f), and DAPI. Yellow arrows show marker positive cells while white arrows show negative cells. g Quantified cell counts for panels cf. There were significantly more senescent cells in Mus cultures positive for: γ-H2AX+, p21+, p53+, and p16+ (Supplementary Table 4). Representative scale bars in panels a and cf = 50 µm and 20 µm, respectively. ***P < 0.0001, **P < 0.001, *P < 0.05. Error bars = S.E.M. Source data are provided as a Source Data file
Fig. 3
Fig. 3
H2O2 exposure does not induce senescence in Acomys fibroblasts. ae P2 Acomys and Mus (n = 4/species) fibroblasts treated with sub-lethal doses of H2O2 (0 μM-control, 75 μM, 150 μM, and 300 μM) for 2 h and then cultured for 24 and 48 h. The horizontal line within the box represents the median sample value of the box plot. The ends of the boxes represent the 25th and 75th quantiles and the lines extending from each end of the boxes are whiskers representing the highest and lowest observations. a Mus fibroblasts showed no significant change in the percent EdU + cells compared to control after 24 h, but at 48 h experienced a significant decrease in response to 150 μM (Tukey-HSD, t = 4.71, P = 0.0019) and 300 μM H2O2 (Tukey-HSD, t = 7.94, P < 0.0001). No significant changes in Acomys EdU + cells at 24 h. A small, but significant decrease in percent EdU + cells after 48 h was detected in response to 300 μM H2O2 compared to control (Tukey-HSD, t = 3.32, P = 0.0493). b H2O2 exposure had no effect on cellular senescence in Mus and Acomys fibroblasts after 24 h in culture. After 48 h in culture, Mus fibroblasts exhibited significant increases in SA-βgal + cells at all H2O2 concentrations, while Acomys fibroblasts registered a small, but significant increase at 300 μM only (Tukey-HSD, t = −3.75, P = 0.0189). c Acomys fibroblasts followed a similar trend for γ-H2AX + cells after H2O2 treatment while Mus fibroblasts significantly increased γ-H2AX + cells at 24 h in response to 300 μM H2O2 in addition to significant increases at 48 h in response to all concentrations. d Representative cultures for results in panels ac stained with EdU and γ-H2AX. Scale bars = 20 µm. White arrows show double-positive cells and yellow arrows show γ-H2AX + senescent cells. e Acomys fibroblasts do not upregulate the senescence markers p16, p19, p53, and p21 in response to any concentration of H2O2. Mus fibroblasts show significant increases in these markers compared to Acomys in response to all H2O2 treatments after 48 h (Two-way ANOVA, p16, F = 783.3681, P < 0.0001; p19, F = 1094.501, P < 0.0001; p53, F = 399.1625, P < 0.0001; p21, F = 526.55, P < 0.0001) (Supplementary Tables 11-14). ***P < 0.0001, **P < 0.001, *P < 0.05. Error bars = S.E.M. Source data are provided as a Source Data file
Fig. 4
Fig. 4
Fibroblasts from regenerating mammals are refractory to ROS-induced cellular senescence. a, b Fibroblasts from regenerating (Acomys and Oryctolagus) and non-regenerating mammals (Mus and Rattus) treated with increasing concentrations of H2O2 (0 μM-control, 75 μM, 150 μM and 300 μM) for 2 h and then cultured for 48 h in complete media (n = 4/species). a H2O2 induced a significant decrease in the percentage of proliferating cells (EdU+) in Mus at 150 μM (Tukey-HSD, t = 5.95, P < 0.0001) and 300 μM H2O2 (Tukey-HSD, t = 10.04, P < 0.0001), as well as in Rattus at 150 μM (Tukey-HSD, t = 8.25, P < 0.0001) and 300 μM H2O2 (Tukey-HSD, t = 12.88, P < 0.0001), a small but significant decrease in Acomys at 300 μM H2O2 (Tukey-HSD, t = 4.19, P = 0.0099) and no significant change at any H2O2 concentrations in Oryctolagus (Supplementary Table 15). The percentage of senescent cells (γ-H2AX+, SA-βgal+, p21+, and p53+) significantly increased in non-regenerating species and were unchanged in regenerating Acomys and Oryctolagus (Supplementary Tables 16–19). b Representative fibroblast cultures in panel a double-stained with p21 and p53 showing nuclear localization of these tumor suppressors in response to H2O2. Scale bars = 20 µm. ***P < 0.0001, **P < 0.001, *P < 0.05. Error bars = S.E.M. Source data are provided as a Source Data file
Fig. 5
Fig. 5
Gamma irradiation induces DDR and cellular senescence in all species. ad Cells from all four species were exposed to gamma radiation at 0 (control), 5, 15, and 30 Gy and fixed 6 h later (n = 4/species). The representative images show p21, p53, p16, and p19 positive cells in control (0 Gy) and after 30 Gy in Mus (a), Rattus (b), Acomys (c), and Oryctolagus (d). e Fibroblasts from regenerating species showed no significant increase in γ-H2AX + cells at 5 Gy, whereas all species demonstrated a significant increase in DNA damage at 15 and 30 Gy (Supplementary Table 22). Fibroblasts from all four species demonstrated a significant increase in p21+ and p53+ cells at all three radiation doses (Supplementary Tables 23–24). In contrast, fibroblasts from regenerating species showed minimal activation of p16 and p19 in response to gamma radiation, where fibroblasts from Mus and Rattus strongly activated p16 and p19 (Supplementary Tables 25–26). Scale bars in panels ad = 20 µm. ***P < 0.0001, **P < 0.001, *P < 0.05. Error bars = S.E.M. Source data are provided as a Source Data file
Fig. 6
Fig. 6
Mitochondria from regenerating species are resilient to H2O2. a Mitochondria stress testing measured as OCR (pmol/min/μg protein) for fibroblasts from all species after control (PBS) and 300 μM H2O2 treatment. Mitochondrial complex inhibitors were used to generate measures for basal respiration, maximal respiration, ATP production, and spare respiratory capacity. b Measured OCR was converted to percent normalized OCR and we found that all measured parameters were significantly decreased in fibroblasts from non-regenerating species: basal respiration (ANOVA, F = 15.8779, P < 0.0001), ATP production (ANOVA, F = 25.2168, P < 0.0001), maximal respiration (ANOVA, F = 20.2582, P < 0.0001), and spare respiratory capacity (ANOVA, F = 15.0920, P < 0.0001) (n = 5/species). c The mitochondria were isolated from all the species after 0 μM H2O2 (control) or 300 μM H2O2 treatment (n = 3/species). Mitochondria assays were performed on a XF96 analyzer using ADP + pyruvate/malate and mitochondrial inhibitors oligomycin, FCCP and Antimycin A. State III respiration was achieved through ADP stimulated respiration whereas State IV respiration was calculated after oligomycin inhibition. The Respiratory Control Rate (RCR) was calculated as the ratio of State III and State IV respiratory rate. The OCR for State III and RCR was significantly decreased after H2O2 treatment in purified mitochondria of non-regenerators while no significant effect was shown by regenerators: State III respiration (ANOVA, F = 19.1281, P < 0.0001) and RCR (ANOVA, F = 19.1558, P < 0.0001). Graphics for fibroblast and mitochondria were adapted from open source material. ***P < 0.0001, **P < 0.001, *P < 0.05. Error bars = S.E.M. Source data are provided as a Source Data file
Fig. 7
Fig. 7
Regenerators rapidly detoxify exogenous hydrogen peroxide via increased GPx activity. a Representative images for a single live-imaged cell transfected with HyPer which captured every 30 min over 6 h. b Fluorescence intensity ratios (F/F0) were calculated for >20 cells/cell lines for all four species (n = 3 lines/species). A linear model was used to detect H2O2 detoxification rate and ANOVA was used to detect significant differences between species. F/F0 quantified 30 min after H2O2 treatment were not significantly different between species (ANOVA, F = 1.2153, P < 0.3651 and Supplementary Table 34). H2O2 was detoxified significantly faster in Acomys and Oryctolagus (yellow box) (Linear model, F = 3.9693, P < 0.0137 and Supplementary Tables 33, 34). After 30 min, F/F0 were significantly different between species until 4 h post treatment (Supplementary Table 34). In Acomys and Oryctolagus, F/F0 returned to baseline levels after ~2.5 h (Tukey-HSD, Acomys: t = −1.42, P = 0.1592 and Oryctolagus: t = −1.70, P = 0.0929), whereas it did not return to baseline in Mus and Rattus until ~5 h post-treatment (Tukey-HSD, Mus: t = −1.74, P = 0.0853 and Rattus: t = −1.91, P = 0.0588). Asterisk refers to significant differences between species from an ANOVA. c Catalase activity was significantly decreased in all species following H2O2 exposure (Supplementary Table 35). Comparing catalase activity between regenerating and non-regenerating species revealed a significantly greater decrease in non-regenerators (Two-way ANOVA, LS Means, F = 20.5504, P = 0.0003). d GPx activity was significantly increased in response to 300 μM H2O2 in all species (Supplementary Table 36). However, GPx activity increased to a greater extent in regenerators compared to non-regenerators (Two-way ANOVA, LS Means-, F = 172.5647, P < 0.0001). e Pre-treatment with NAC protected Mus and Rattus cells from mitochondrial destabilization upon H2O2 exposure. Percent normalized OCRs were not significantly different among non-treated and NAC + H2O2 (pre-treatment with 2 mM NAC followed by 2 h of 300 μM H2O2 treatment) treated samples in Mus and Rattus for all the measured components: basal respiration, maximal respiration, ATP production and spare respiratory capacity (Supplementary Tables 37–40). fh Pre-treatment with NAC prevents ROS-induced senescence in Mus and Rattus cells as measured by percent p21 + (ANOVA, Mus, F = 1309.3470, P < 0.0071 and Rattus, F = 258.1558, P < 0.0924) and SA-βgal + cells (ANOVA, Mus, F = 669.5451, P < 0.1465 and Rattus, F = 125.3335, P < 0.0522) staining. Representative scale bars in panel a = 50 µm and in panel f = 20 µm. ***P < 0.0001, **P < 0.001, *P < 0.05. Error bars = S.E.M. Source data are provided as a Source Data file

Similar articles

Cited by

References

    1. Hay ED, Fischman DA. Origin of the blastema in regenerating limbs of the newt Triturus viridescens. An autoradiographic study using tritiated thymidine to follow cell proliferation and migration. Dev. Biol. 1961;3:26–59. doi: 10.1016/0012-1606(61)90009-4. - DOI - PubMed
    1. Tanaka EM, Reddien PW. The cellular basis for animal regeneration. Dev. Cell. 2011;21:172–185. doi: 10.1016/j.devcel.2011.06.016. - DOI - PMC - PubMed
    1. Owlarn S, et al. Generic wound signals initiate regeneration in missing-tissue contexts. Nat. Commun. 2017;8:2282. doi: 10.1038/s41467-017-02338-x. - DOI - PMC - PubMed
    1. Simkin J, Seifert AW. Concise review: translating regenerative biology into clinically relevant therapies: are we on the right path? Stem Cells Transl. Med. 2018;7:220–231. doi: 10.1002/sctm.17-0213. - DOI - PMC - PubMed
    1. Gawriluk, T. R. et al. Comparative analysis of ear-hole closure identifies epimorphic regeneration as a discrete trait in mammals. Nat. Commun.7, 11164 (2016). - PMC - PubMed

Publication types