. 2019 Oct 17;4(20):e129380.
doi: 10.1172/jci.insight.129380.

Precocious chondrocyte differentiation disrupts skeletal growth in Kabuki syndrome mice

Affiliations

Precocious chondrocyte differentiation disrupts skeletal growth in Kabuki syndrome mice

Jill A Fahrner et al. JCI Insight. .

Abstract

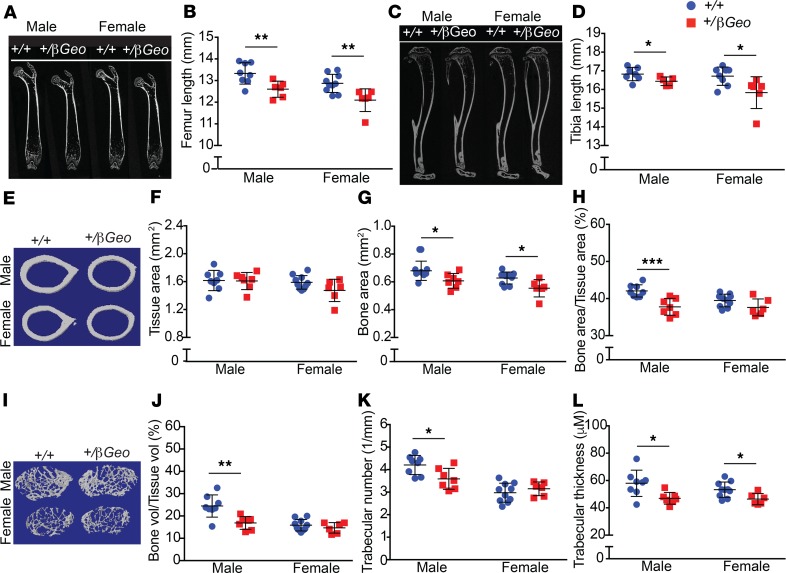
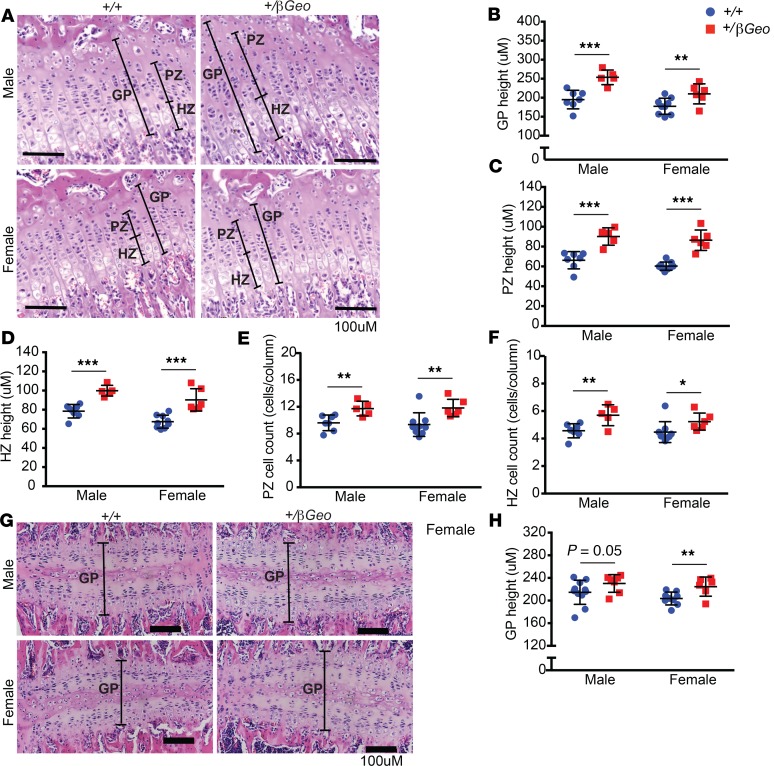
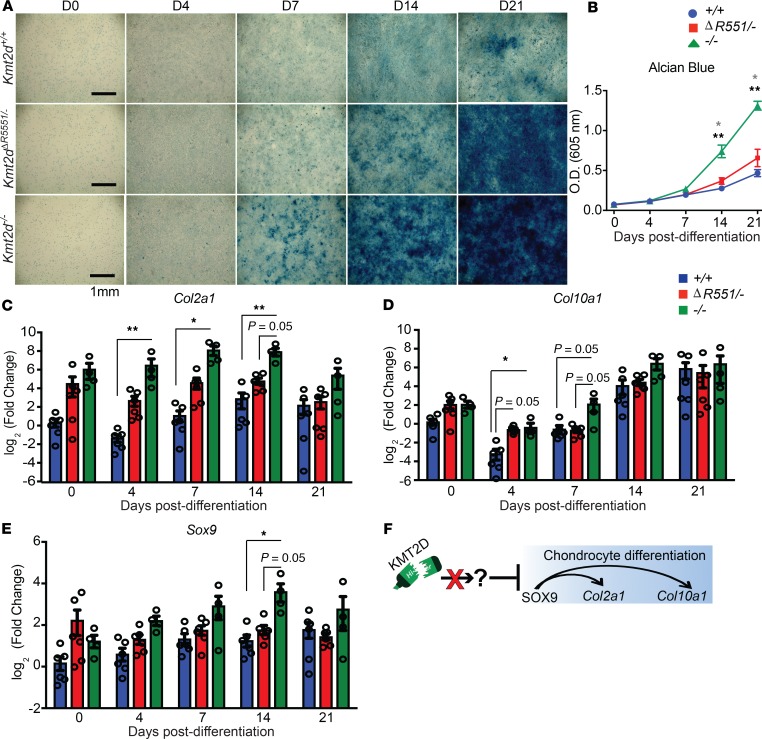
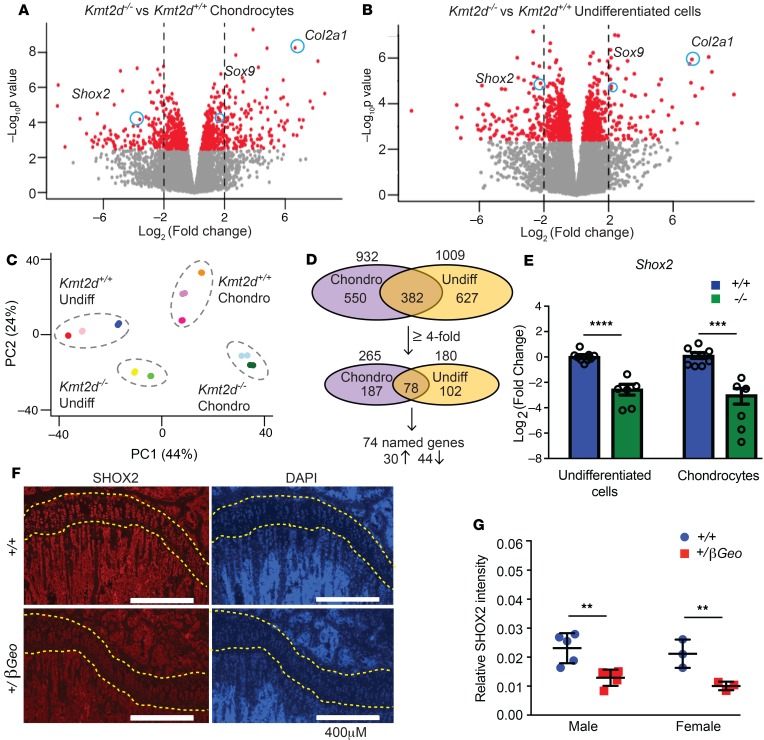
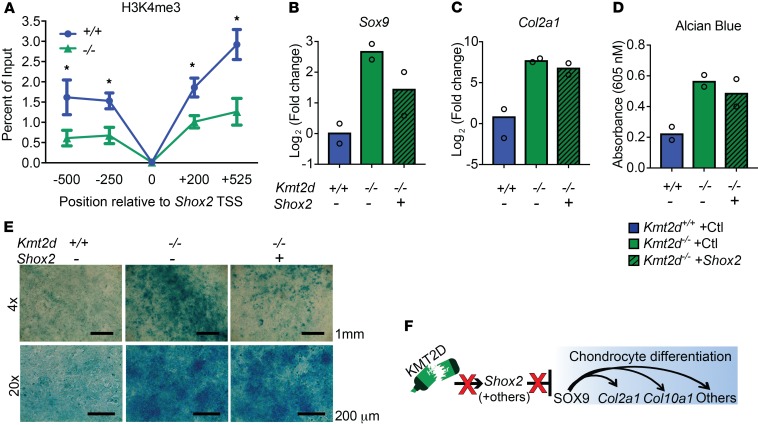
Kabuki syndrome 1 (KS1) is a Mendelian disorder of the epigenetic machinery caused by mutations in the gene encoding KMT2D, which methylates lysine 4 on histone H3 (H3K4). KS1 is characterized by intellectual disability, postnatal growth retardation, and distinct craniofacial dysmorphisms. A mouse model (Kmt2d+/βGeo) exhibits features of the human disorder and has provided insight into other phenotypes; however, the mechanistic basis of skeletal abnormalities and growth retardation remains elusive. Using high-resolution micro-CT, we show that Kmt2d+/βGeo mice have shortened long bones and ventral bowing of skulls. In vivo expansion of growth plates within skulls and long bones suggests disrupted endochondral ossification as a common disease mechanism. Stable chondrocyte cell lines harboring inactivating mutations in Kmt2d exhibit precocious differentiation, further supporting this mechanism. A known inducer of chondrogenesis, SOX9, and its targets show markedly increased expression in Kmt2d-/- chondrocytes. By transcriptome profiling, we identify Shox2 as a putative KMT2D target. We propose that decreased KMT2D-mediated H3K4me3 at Shox2 releases Sox9 inhibition and thereby leads to enhanced chondrogenesis, providing a potentially novel and plausible explanation for precocious chondrocyte differentiation. Our findings provide insight into the pathogenesis of growth retardation in KS1 and suggest therapeutic approaches for this and related disorders.

Keywords: Epigenetics; Genetic diseases; Genetics.


Conflict of interest statement

Conflict of interest: HTB is a consultant with Millennium Therapeutics.

Figures

Figure 1
Figure 1. Kmt2d+/βGeo mice exhibit generalized growth retardation and a specific craniofacial phenotype reminiscent of individuals with KS1.
(A) Representative radiographs of Kmt2d+/βGeo mice and Kmt2d+/+ littermates illustrating growth retardation and flattening of the facial profile. Quantification of (B) body weight and (C) body length in 6-week-old Kmt2d+/βGeo male (n = 6) and female (n = 3) mice and Kmt2d+/+ male (n = 3) and female (n = 7) littermates. Data represent mean ± SD, and similar results were obtained with multiple cohorts of mice. One-sided unpaired Student’s t test *P < 0.05; **P < 0.01; ***P < 0.001. (D) Representative reconstructions of high-resolution craniofacial micro-CTs in the left lateral view from Kmt2d+/βGeo mice and Kmt2d+/+ littermates illustrating craniofacial phenotype and (E) showing, in green, 4 pairs of bilateral landmarks (top) and 10 midline landmarks (bottom) used for morphometric analysis. Scale bar: 3 mm. (F) PCA of shape revealing separation of 2 distinct groups along PC1 and PC3, with Kmt2d+/+ mice (n = 21) toward the lower end and Kmt2d+/βGeo mice (n = 13) toward the upper end of PC1. Two-way Procrustes ANOVA confirmed a statistically significant effect of genotype on overall cranial shape (Pillai’s trace = 0.98; P = 0.0086). (G) Overlay of wire frames in left lateral view illustrating relative differences in shape of Kmt2d+/+ mice (blue) and Kmt2d+/βGeo mice (red). Black vectors show displacement of landmarks associated with the range of shape variation observed on PC1 and indicate ventral bowing, dorsal expansion, and brachycephaly in KS1 (thick black arrows).
Figure 2
Figure 2. High-resolution micro-CT analysis of long bones in KS1 reveals shortening, thinning, and altered trabecular bone formation in Kmt2d+/βGeo mice.
(A and B) Femurs and (C and D) tibias are shorter in Kmt2d+/βGeo mice compared with Kmt2d+/+ littermates. (E and F) Overall cross-sectional area does not differ between Kmt2d+/βGeo and Kmt2d+/+ femurs. (E and G) Cross-sectional area of mineralized bone is reduced in Kmt2d+/βGeo femurs compared with Kmt2d+/+ femurs. (E and H) The percent of cross-sectional area made up of mineralized bone is reduced in male Kmt2d+/βGeo femurs compared with Kmt2d+/+ femurs, whereas the difference is not significant in females. (I) Kmt2d+/βGeo femurs appear to have decreased trabecular bone near the growth plate compared with Kmt2d+/+ femurs. (I and J) Specifically, percent of tissue volume made up of bone is decreased in male Kmt2d+/βGeo femurs, and (I and K) trabecular number is decreased in male Kmt2d+/βGeo femurs. (I and L) Trabecular thickness is decreased in male and female Kmt2d+/βGeo femurs. For Kmt2d+/+ femurs, n = 18 (8 male and 10 female); for Kmt2d+/+ tibias n = 15 (7 male and 8 female); for Kmt2d+/βGeo femurs, n = 13 (7 male and 6 female, except for femur length, where only 6 male mutants could be measured); for Kmt2d+/βGeo tibias, n = 11 (5 male, 6 female). Data represent mean ± SD. One-tailed (B and D) or 2-tailed (F–H and J–L) unpaired Student’s t tests were used. *P < 0.05; **P < 0.01; ***P < 0.001.
Figure 3
Figure 3. Growth plates from long bones and within the cranial base are expanded in Kmt2d+/βGeo mice.
(A and B) Proximal tibia growth plates and their (A and C) proliferative and (A and D) hypertrophic zones (PZ and HZ, respectively) are expanded in Kmt2d+/βGeo mice compared with Kmt2d+/+ littermates. The mechanism involves increased cell numbers per column in both the (E) PZ and (F) HZ. (G and H) Cranial base intrasphenoidal synchondroses (ISS) from Kmt2d+/βGeo mice are expanded compared with Kmt2d+/+ littermates. GP, growth plate. For Kmt2d+/+ proximal tibia growth plates, n = 16; 7 male and 9 female. For Kmt2d+/+ ISS growth plates, n = 20; 11 male, 9 female. For Kmt2d+/βGeo proximal tibia growth plates, n = 11; 5 male and 6 female. For Kmt2d+/βGeo ISS growth plates, n = 13; 7 male and 6 female. Data represent mean ± SD. One-sided unpaired Student’s t test; *P < 0.05; **P < 0.01; ***P < 0.001. Scale bar: 100 μM.
Figure 4
Figure 4. Precocious differentiation of Kmt2d–/– and Kmt2dΔR5551/– chondrocytes.
Stable ATDC5 cell lines with Kmt2d mutations of varying severity were created using CRISPR/Cas9 genome editing technology. Chondrocyte differentiation was induced at day 0. Alcian blue staining was used to (A) visualize and (B) quantify chondrocyte differentiation over time. Scale bar: 1 mm. Black asterisks represent differences between Kmt2d+/+ cells and Kmt2d–/– or Kmt2dΔR5551/– cells; gray asterisks represent differences between Kmt2d–/– and Kmt2dΔR5551/– cells. qPCR with primers specific for (C) Col2a1, (D) Col10a1, and (E) Sox9 was performed on RNA isolated from undifferentiated (day 0) and differentiated Kmt2d+/+, Kmt2dΔR5551/–, and Kmt2d–/– stable chondrocyte cell lines at 4, 7, 14, and 21 days after induction of differentiation. Fold change was calculated relative to undifferentiated Kmt2d+/+ cells (day 0). (B–E) Data represent mean ± SEM; the experiments were performed 2 times with 3 independent stable cell lines per time point (n = 6) for Kmt2d+/+ and Kmt2dΔR5551/– and with 2 independent stable cell lines per time point (n = 4) for Kmt2d–/–. Mixed model ANOVA with Tukey’s adjustment method within each time point was used; *P < 0.05; **P < 0.01. (F) Preliminary model for precocious chondrocyte differentiation in KS1.
Figure 5
Figure 5. Genome-wide transcriptome profiling identifies Shox2 as a target of KMT2D in vitro and in vivo.
Volcano plots showing genome-wide differential gene expression in Kmt2d–/– and Kmt2d+/+ (A) chondrocytes differentiated for 7 days and (B) undifferentiated cells. (C) PCA reveals tight clustering within and distinct separation between genotypes and differentiation states, separating the cells into 4 distinct groups. Kmt2d+/+ cells cluster toward the upper end of PC2 and Kmt2d–/– cells cluster toward the lower end of PC2. Undifferentiated cells cluster toward the lower end of PC1 and chondrocytes cluster toward the upper end of PC1. Each color represents a biological replicate; each biological replicate is a distinct clonal cell line. Three (Kmt2d+/+) or 2 (Kmt2d–/–) biological replicates were used for each differentiation state (chondrocytes vs. undifferentiated cells). Each point represents a technical replicate; 2 technical replicates were performed for each cell line. Sox9 and Col2a1 are upregulated and Shox2 is downregulated in (A) Kmt2d–/– chondrocytes and (B) Kmt2d–/– undifferentiated cells. (D) Venn diagrams summarizing differential gene expression from RNA-seq analyses in Kmt2d+/+ and Kmt2d–/– chondrocytes and undifferentiated cells. (E) Validation of downregulation of Shox2 in 3 independent experiments in vitro; mean ± SEM; n = 9 (Kmt2d+/+) or n = 6 (Kmt2d–/–) per group (undifferentiated cells or chondrocytes); 1-sided unpaired Student’s t test; ***P < 0.001; ****P < 0.0001. (F) Immunofluorescence and (G) quantification of SHOX2 protein levels in vivo in Kmt2d+/βGeo and Kmt2d+/+ proximal tibia growth plates (outlined in yellow dashed lines). SHOX2 intensity was normalized to number of DAPI-stained cells within the growth plate. Data represent mean ± SD; n = 5 male Kmt2d+/+, n = 5 male Kmt2d+/βGeo, n = 3 female Kmt2d+/+, n = 3 female Kmt2d+/βGeo; 1-sided unpaired Student’s t test; **P < 0.01. Scale bar: 400 μM. Chondro, chondrocytes differentiated for 7 days; Undiff, undifferentiated cells.
Figure 6
Figure 6. Functional testing supports Shox2 as a target of KMT2D-mediated H3K4me3 and partial mediator of precocious chondrocyte differentiation in KS1.
(A) ChIP-qPCR revealed decreased H3K4me3 along the Shox2 promoter in Kmt2d–/– cells compared with Kmt2d+/+ cells (mean ± SEM; n = 3 per group per time point; 1-sided unpaired Student’s t test; *P < 0.05). Overexpression of Shox2 in Kmt2d–/– cells led to partial recovery (downregulation) of (B) Sox9 expression but did not lead to significant recovery of (C) Col2a1 expression or (D and E) Alcian blue staining. The experiment was performed in duplicate (n = 2 per group). Scale bars: 1 mm (in top panels) and 200 μM (in bottom panels). (F) Model for molecular pathogenesis of KS1 growth retardation. TSS, transcription start site; Ctl, control Lentiviral-ORF particles.

Similar articles

Cited by

References

    1. Fahrner JA, Bjornsson HT. Mendelian disorders of the epigenetic machinery: tipping the balance of chromatin states. Annu Rev Genomics Hum Genet. 2014;15:269–293. doi: 10.1146/annurev-genom-090613-094245. - DOI - PMC - PubMed
    1. Ng SB, et al. Exome sequencing identifies MLL2 mutations as a cause of Kabuki syndrome. Nat Genet. 2010;42(9):790–793. doi: 10.1038/ng.646. - DOI - PMC - PubMed
    1. Niikawa N, Matsuura N, Fukushima Y, Ohsawa T, Kajii T. Kabuki make-up syndrome: a syndrome of mental retardation, unusual facies, large and protruding ears, and postnatal growth deficiency. J Pediatr. 1981;99(4):565–569. doi: 10.1016/S0022-3476(81)80255-7. - DOI - PubMed
    1. Kuroki Y, Suzuki Y, Chyo H, Hata A, Matsui I. A new malformation syndrome of long palpebral fissures, large ears, depressed nasal tip, and skeletal anomalies associated with postnatal dwarfism and mental retardation. J Pediatr. 1981;99(4):570–573. doi: 10.1016/S0022-3476(81)80256-9. - DOI - PubMed
    1. Banka S, et al. How genetically heterogeneous is Kabuki syndrome?: MLL2 testing in 116 patients, review and analyses of mutation and phenotypic spectrum. Eur J Hum Genet. 2012;20(4):381–388. doi: 10.1038/ejhg.2011.220. - DOI - PMC - PubMed

Publication types

MeSH terms

Supplementary concepts