. 2019 Nov 26;93(24):e01499-19.
doi: 10.1128/JVI.01499-19. Print 2019 Dec 15.

Host CARD11 Inhibits Newcastle Disease Virus Replication by Suppressing Viral Polymerase Activity in Neurons

Affiliations

Host CARD11 Inhibits Newcastle Disease Virus Replication by Suppressing Viral Polymerase Activity in Neurons

Wenbin Wang et al. J Virol. .

Abstract

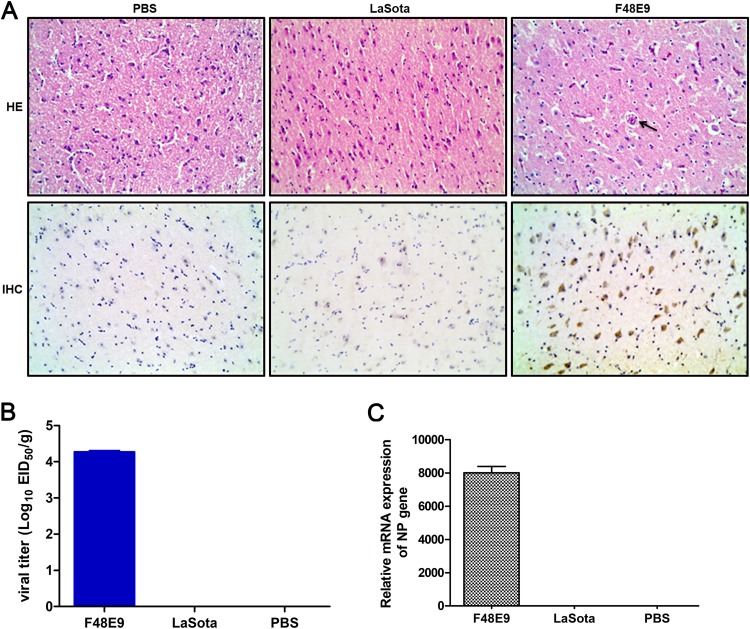
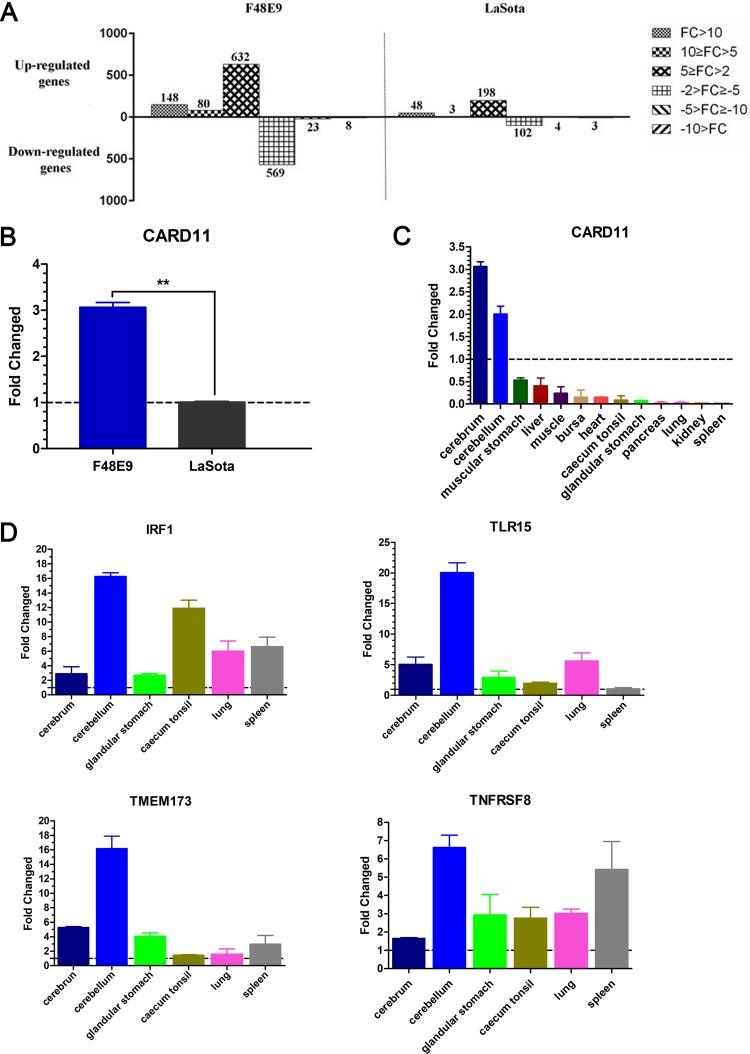
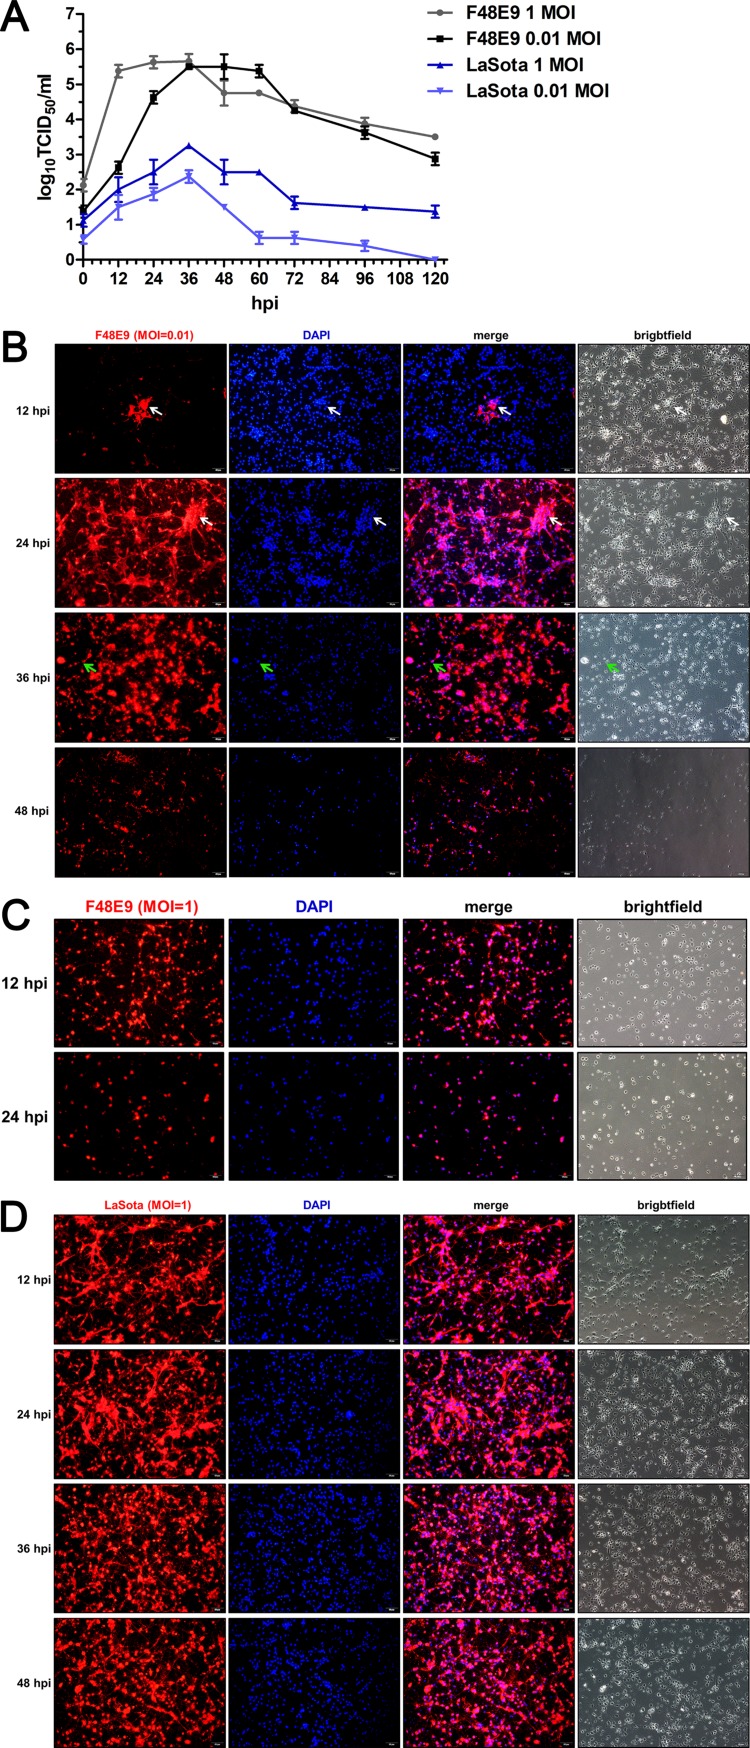
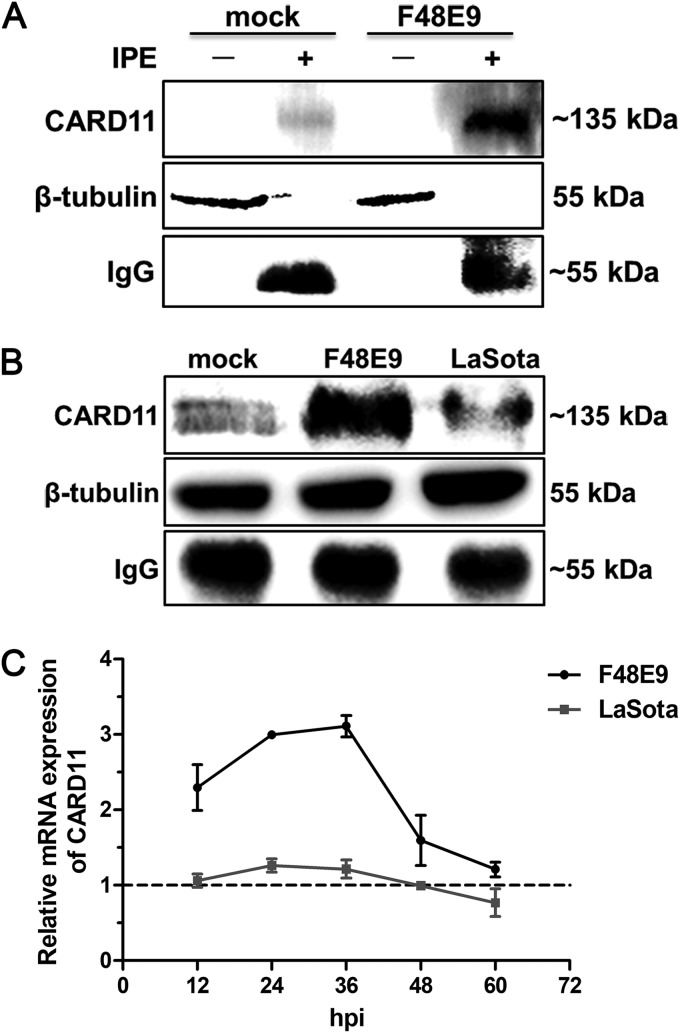
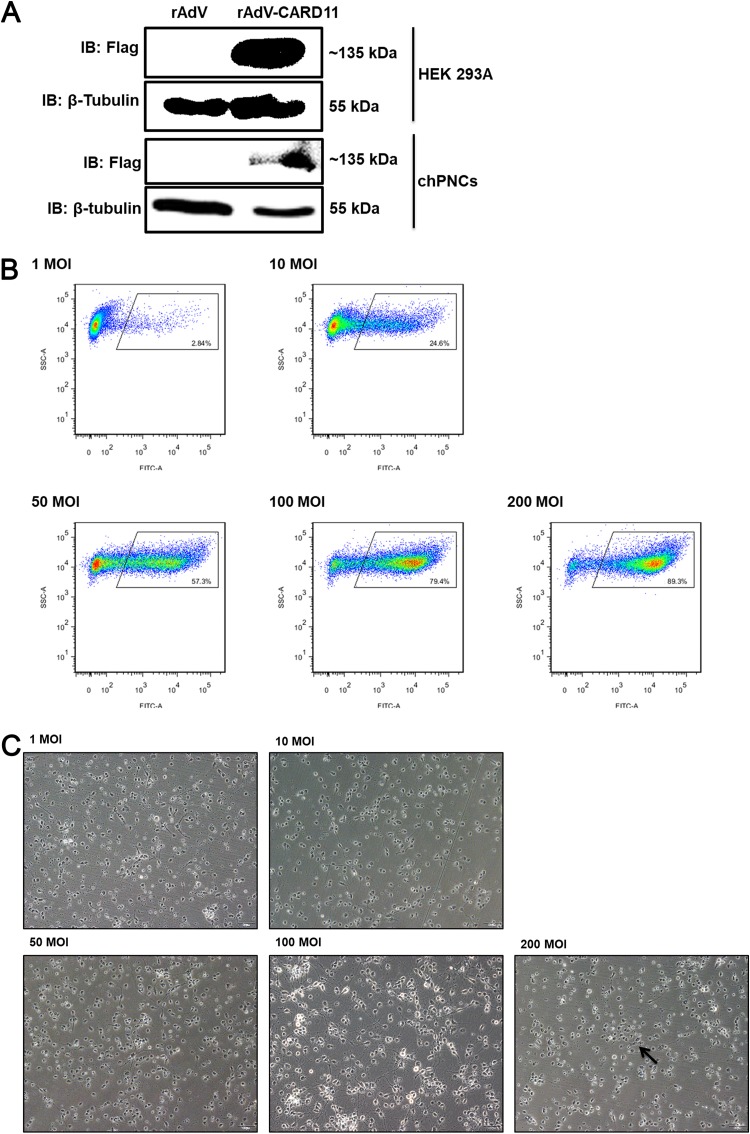
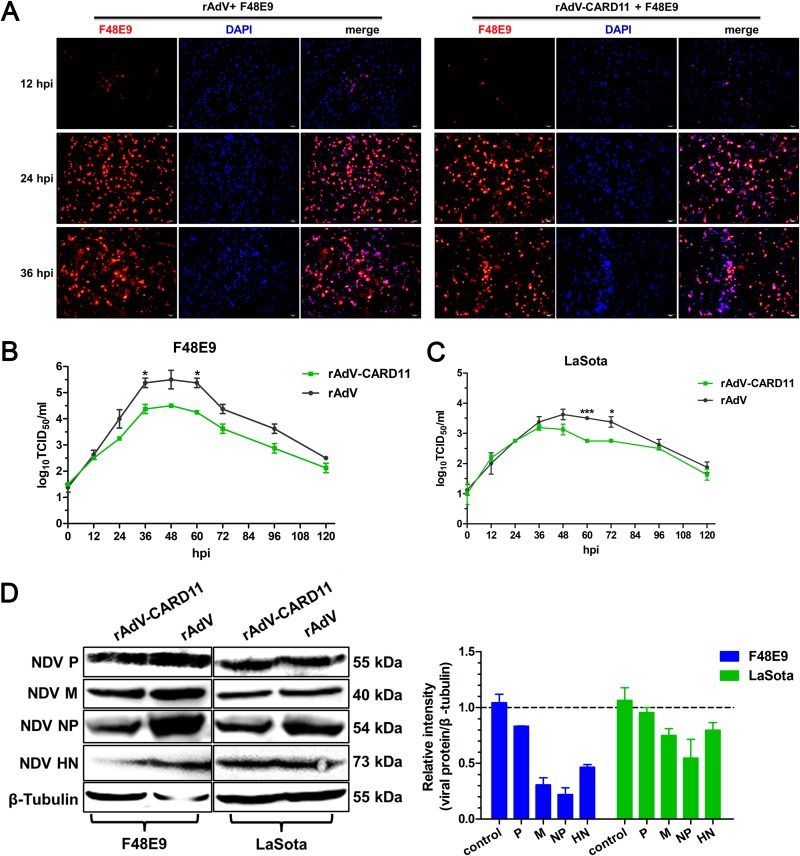
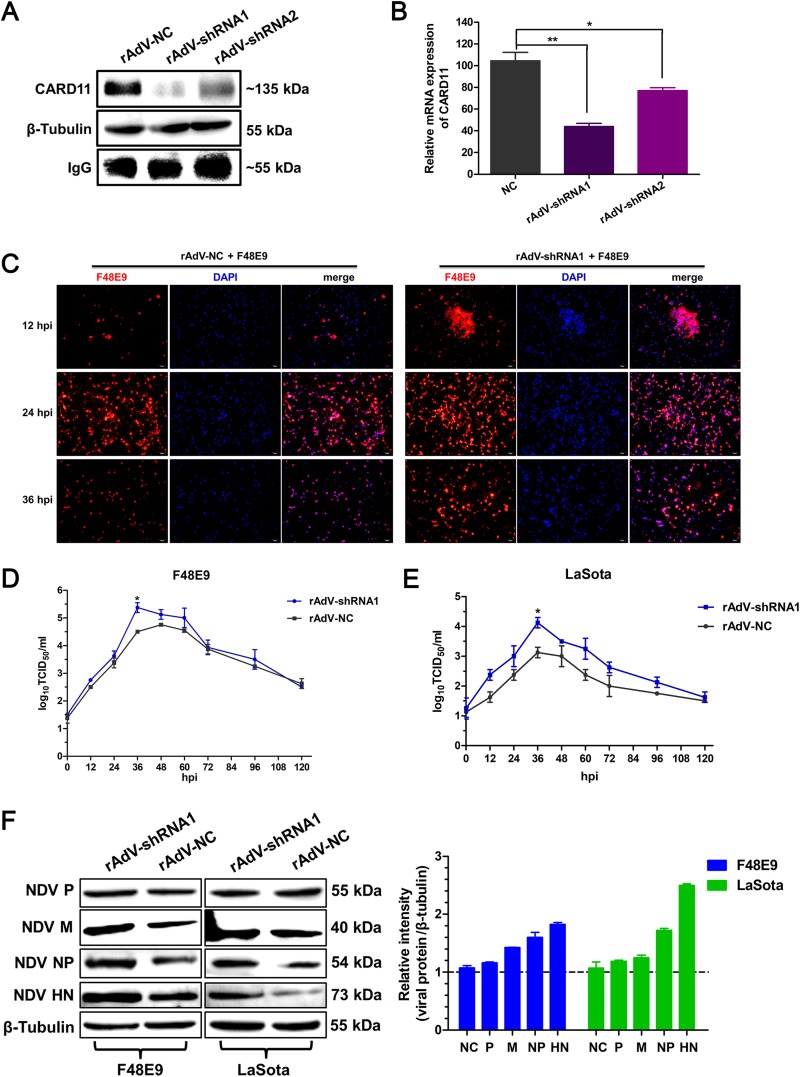
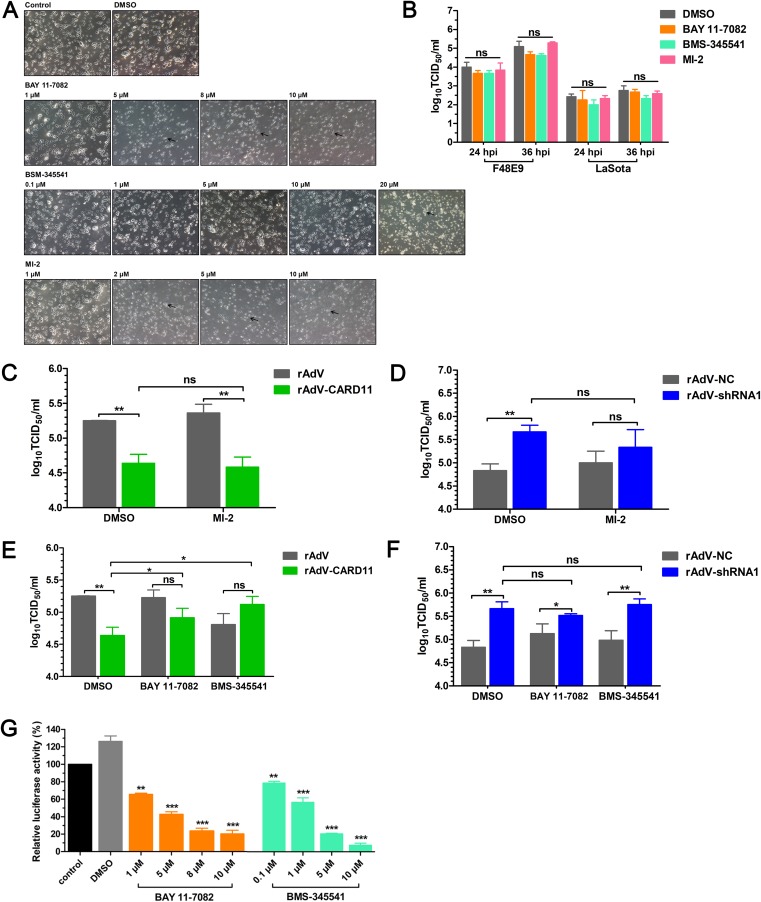
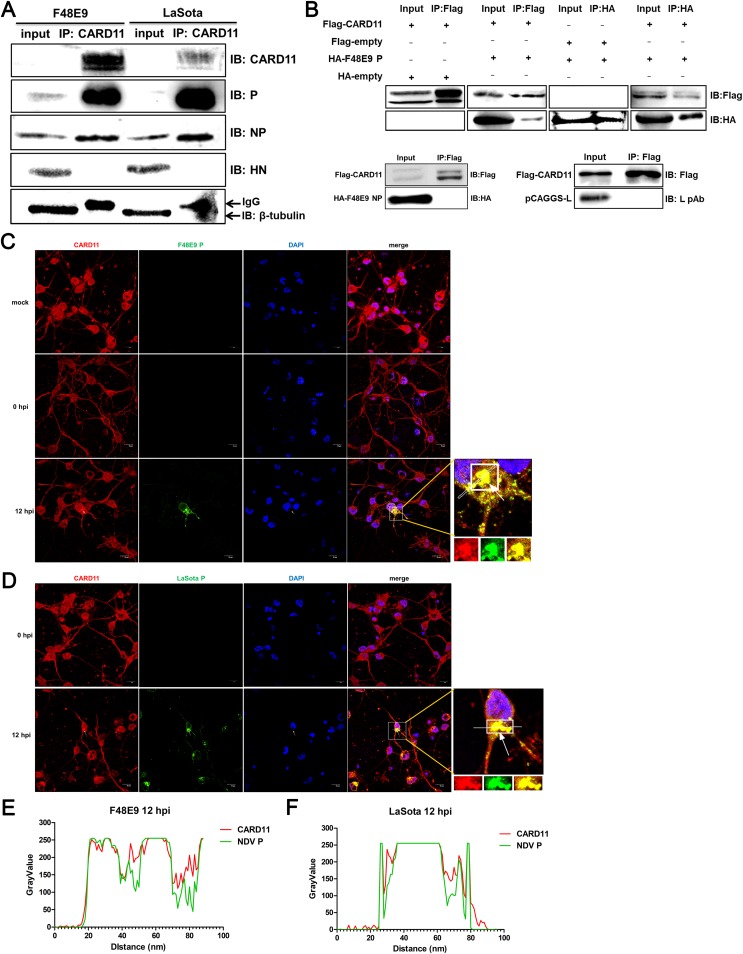
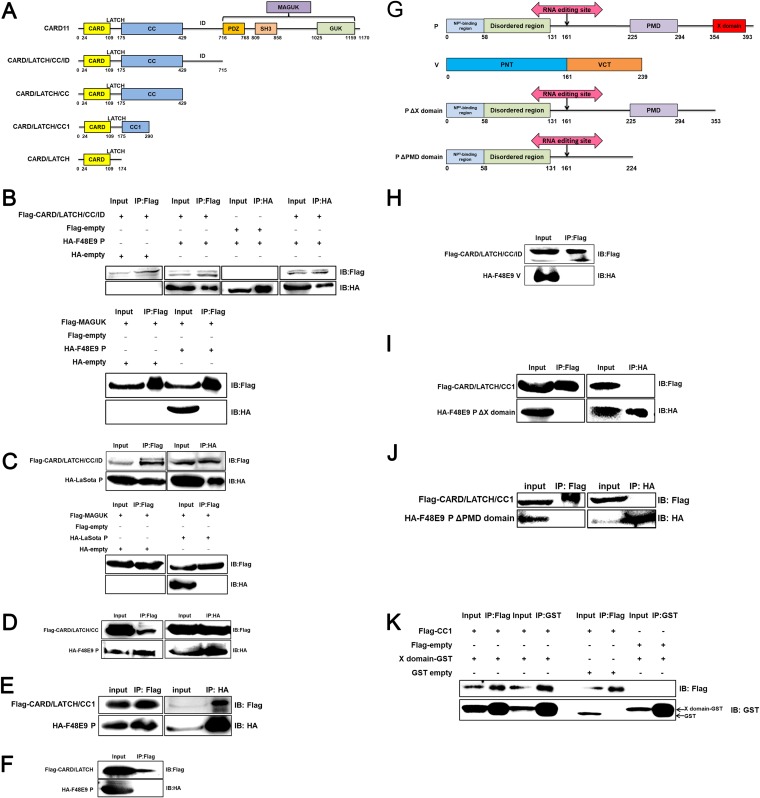
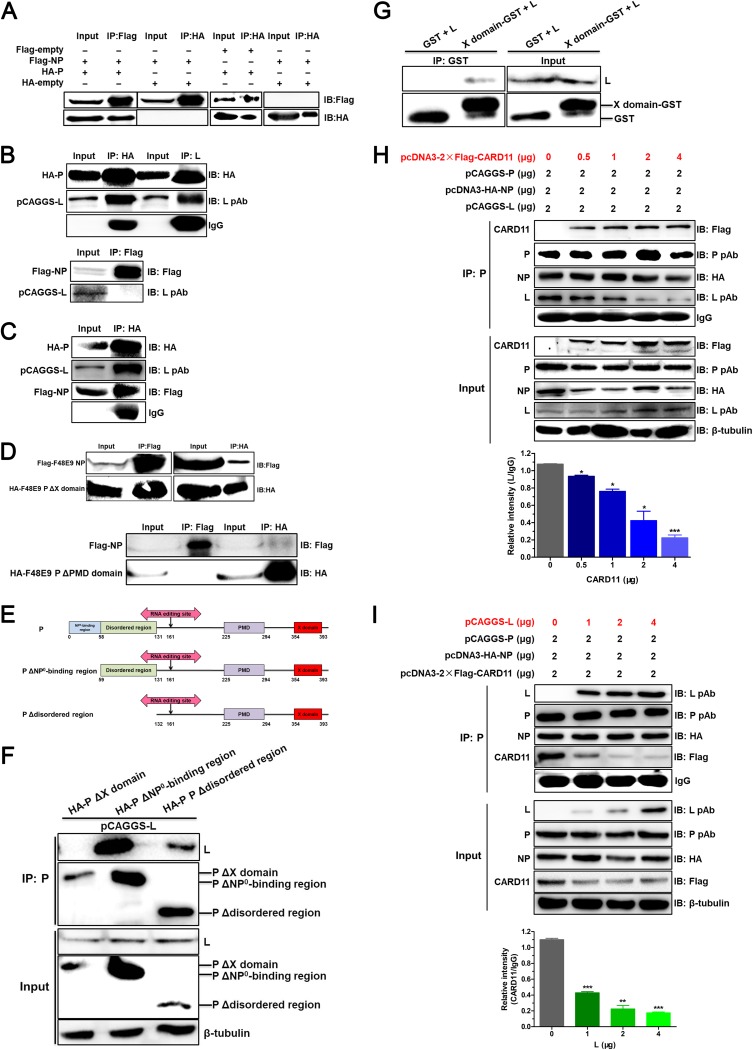
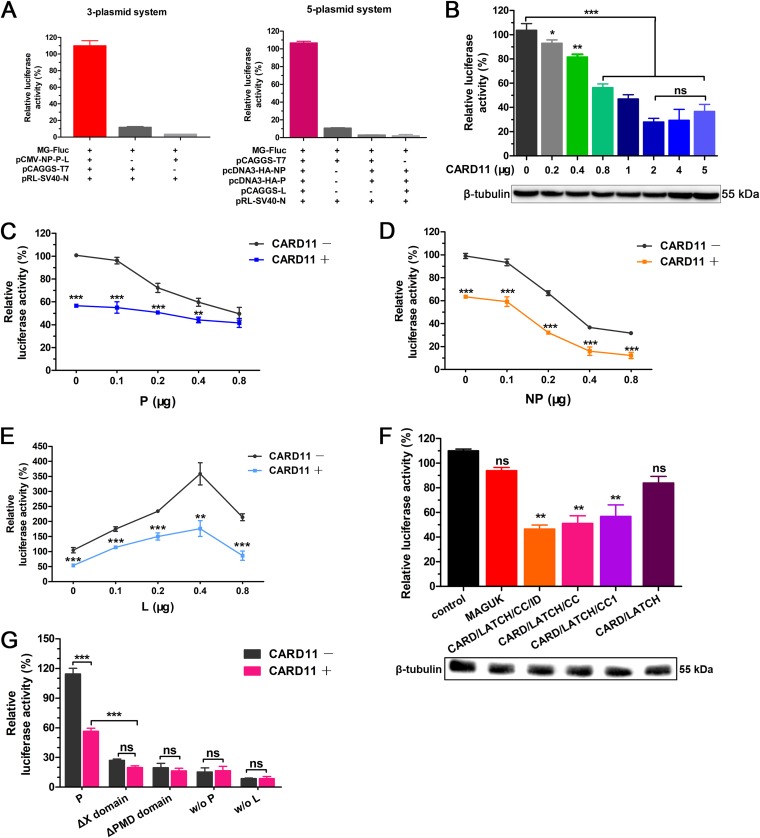
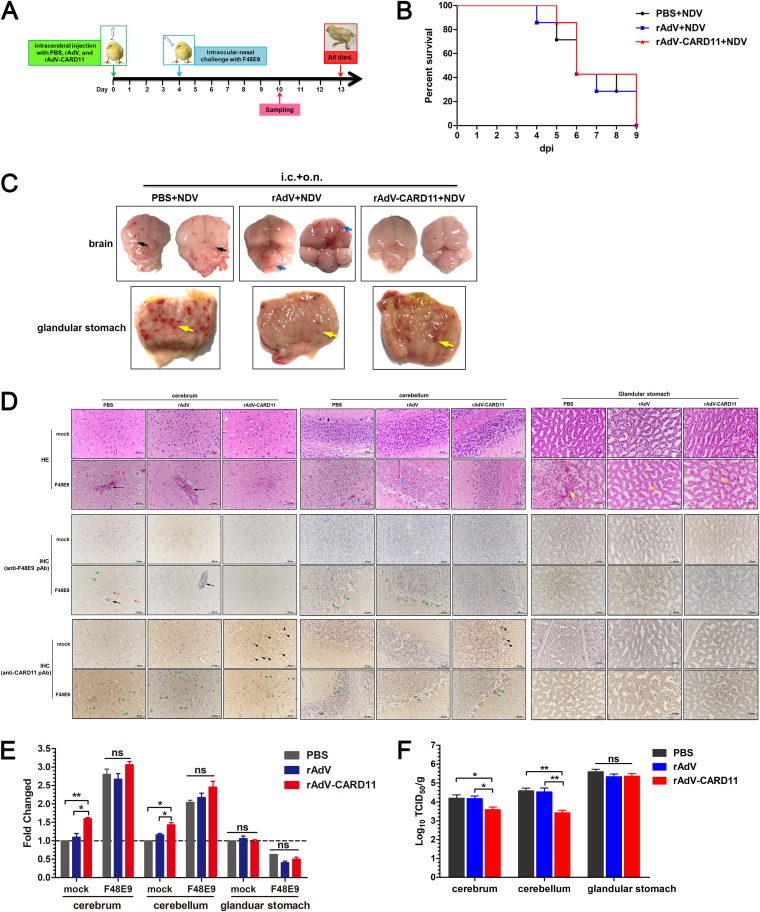
Host factors play multiple essential roles in the replication and pathogenesis of mammalian neurotropic viruses. However, the cellular proteins of the central nervous system (CNS) involved in avian neurotropic virus infection have not been completely elucidated. Here, we employed a gene microarray to identify caspase recruitment domain-containing protein 11 (CARD11), a lymphoma-associated scaffold protein presenting brain-specific upregulated expression in a virulent neurotropic Newcastle disease virus (NDV)-infected natural host. Chicken primary neuronal cells infected with NDV appeared slightly syncytial and died quickly. CARD11 overexpression inhibited viral replication and delayed cytopathic effects; conversely, depletion of CARD11 enhanced viral replication and cytopathic effects in chicken primary neuronal cells. The inhibition of viral replication by CARD11 could not be blocked with CARD11-Bcl10-MALT1 (CBM) signalosome and NF-κB signaling inhibitors. CARD11 was found to interact directly with the viral phosphoprotein (P) through its CC1 domain and the X domain of P; this X domain also mediated the interaction between P and the viral large polymerase protein (L). The CARD11 CC1 domain and L competitively bound to P via the X domain that hindered the P-L interaction of the viral ribonucleoprotein (RNP) complex, resulting in a reduction of viral polymerase activity in a minigenome assay and inhibition of viral replication. Animal experiments further revealed that CARD11 contributed to viral replication inhibition and neuropathology in infected chicken brains. Taken together, our findings identify CARD11 as a brain-specific antiviral factor of NDV infection in avian species.IMPORTANCE Newcastle disease virus (NDV) substantially impacts the poultry industry worldwide and causes viral encephalitis and neurological disorders leading to brain damage, paralysis, and death. The mechanism of interaction between this neurotropic virus and the avian central nervous system (CNS) is largely unknown. Here, we report that host protein CARD11 presented brain-specific upregulated expression that inhibited NDV replication, which was not due to CARD11-Bcl10-MALT1 (CBM) complex-triggered activation of its downstream signaling pathways. The inhibitory mechanism of viral replication is through the CARD11 CC1 domain, and the viral large polymerase protein (L) competitively interacts with the X domain of the viral phosphoprotein (P), which hampers the P-L interaction, suppressing the viral polymerase activity and viral replication. An in vivo study indicated that CARD11 alleviated neuropathological lesions and reduced viral replication in chicken brains. These results provide insight into the interaction between NDV infection and the host defense in the CNS and a potential antiviral target for viral neural diseases.

Keywords: CARD11; Newcastle disease virus; avian neurons; brain-specific upregulation; competitive binding; inhibition to viral replication; viral RNP; viral polymerase activity.


Figures

FIG 1
FIG 1
Histopathology of the brains in NDV-infected chickens. (A) Four-week-old SPF chickens were infected with virulent F48E9, avirulent LaSota (105 PFU/100 μl/chicken), and PBS control (100 μl/chicken) via the intraocular-nasal routes. The brain samples were collected for HE and IHC analyses with anti-F48E9 mouse PAb (1:500) and anti-LaSota mouse PAb (1:500) at 5 dpi. The black arrows indicate vascular cuffing lesions in the cerebrum. Bars, 50 μm. (B) The viral titers were titrated in 9- to 11-day-old SPF embryonated chicken eggs. The 50% egg infective dose (EID50) values were calculated using the Reed-Muench method. (C) The relative mRNA expression of viral NP genes in F48E9- and LaSota-infected chicken brains, normalized to that of 28S rRNA, was determined by RT-qPCR. The results are presented as the means ± SDs from three independent experiments.
FIG 2
FIG 2
Identification of CARD11, a host factor with brain-specific upregulation in NDV-infected chickens. (A) The numbers of DEGs with different FCs (P < 0.05) in virus-infected brains are shown in the columns. Four-week-old SPF chickens were infected with virulent F48E9 and avirulent LaSota (105 PFU/100 μl) via the intraocular-nasal route. Brain samples were collected at 5 dpi. Total RNA was extracted from the brains for gene microarray analysis. The relative mRNA expression of CARD11 in NDV-infected chicken brains (B) and other tissues (C) normalized to that of 28S rRNA was determined by RT-qPCR. (D) The relative mRNA expression of IRF1, TLR15, TMEM173, and TNFRSF8 in NDV-infected chicken tissues was determined by RT-qPCR and normalized to that of 28S rRNA. Representative data shown as the means ± SDs (n = 3) were analyzed by two-tailed Student's t tests. **, P < 0.01.
FIG 3
FIG 3
Virulent NDV shows better replication than lentogenic NDV in chPNCs. (A) Replication of NDV in chPNCs. The cells were infected with F48E9 (MOI = 0.01 or 1) and LaSota (MOI = 0.01 or 1) for 1 h at 37°C. The viral replicates of the culture supernatants at different times after infection were titrated in DF-1 cells. The results are presented as the means ± SDs from three independent experiments. (B to D) The infection of NDV strains in the chPNCs. chPNCs were infected with F48E9 (MOI = 0.01) (B), F48E9 (MOI = 1) (C), and LaSota (MOI = 1) (D) at 12, 24, 36, and 48 hpi. The cells were examined by immunofluorescence assay (IFA) using an anti-NDV mouse PAb (1:200). The white arrows indicate syncytia, and the green arrows indicate axon disruption. Bars, 50 μm.
FIG 4
FIG 4
CARD11 is upregulated in NDV-infected chPNCs. (A) The expression of cellular CARD11 was only detected by IPE. The chPNCs in 60-mm-diameter dishes (∼107 per dish) at day 3 infected with F48E9 (MOI = 0.01) and LaSota (MOI = 1) were collected at 24 hpi. For collection of the samples without IPE, the mock- and NDV-infected cells were scraped and centrifuged at 300 × g for 5 min at 4°C. The cells were lysed in 50 μl 1× SDS loading buffer. For the IPE assay samples, the mock- and NDV-infected cells were lysed in 500 μl of ice-cold RIPA buffer with PMSF (1:1,000) for 30 min and centrifuged at 13,000 × g for 15 min at 4°C. The supernatants were incubated with an anti-CARD11 mouse PAb (10 μl) at 4°C for 4 h and captured by the addition of 40 μl of a protein A/G-agarose (Abmart) slurry and gentle rotation overnight at 4°C. The agarose beads were further washed three times and resuspended in 50 μl of 1× SDS loading buffer and boiled for 10 min. All the nonimmunoprecipitated and immunoprecipitated CARD11 samples were analyzed by Western blotting with anti-CARD11 mouse PAb (1:1,000). The protein loading controls are listed: β-tubulin for samples without IPE and IgG for IPE proteins. (B) The upregulated expression of CARD11 protein in NDV-infected chPNCs with IPE assays. The immunoprecipitated CARD11 was analyzed by Western blotting with anti-CARD11 mouse PAb. The protein loading controls are listed: β-tubulin for input proteins, and IgG for IP proteins. (C) The upregulation of CARD11 mRNA expression in the infected chPNCs. The relative mRNA expression of CARD11 was analyzed by RT-qPCR in chPNCs infected with F48E9 (MOI = 0.01) and LaSota (MOI = 1) at 12, 24, 36, 48 and 60 hpi. The results are presented as the means ± SDs from three independent experiments.
FIG 5
FIG 5
The infection efficiency of rAdVs in chPNCs. (A) Detection of rAdV-CARD11 (MOI = 100) infected HEK293A cells and chPNCs. At 36 hpi in HEK293A cells and 48 hpi in chPNCs, the cell lysates were analyzed by Western blotting with an anti-Flag mouse MAb. β-Tubulin was used as a protein loading control. (B and C) Infection efficiency of rAdV-CARD11 in chPNCs. The chPNCs were infected with rAdV-CARD11 at different MOIs (1, 10, 50, 100, and 200) for 2 h at 37°C. The rAdV-CARD11-infected chPNCs at 48 hpi were collected by 0.25% trypsin digestion and incubated with an anti-Flag mouse MAb and goat anti-mouse IgG/FITC at 4°C with minimal exposure to light. (B) After the cells were washed, they were assessed by flow cytometry. (C) The cells were observed under a microscope. The black arrow indicates cell bodies with no axons. Bars, 50 μm.
FIG 6
FIG 6
CARD11 overexpression inhibits viral replication in chPNCs. (A) CPEs of NDV infection in the CARD11-overexpressing chPNCs. The cells were infected with rAdV and rAdV-CARD11 (MOI = 100). After 48 hpi, the cells were infected with F48E9 (MOI = 0.01) and observed at 12, 24, and 36 hpi by IFA with an anti-NDV mouse PAb. Bars, 50 μm. (B and C) NDV replication in CARD11-overexpressing chPNCs. The cells were infected with rAdV and rAdV-CARD11 (MOI = 100). At 48 hpi, the cells were infected with F48E9 (MOI = 0.01) (B) and LaSota (MOI = 1) (C). The viral titers in the supernatants of chPNCs were analyzed via the TCID50 method. Representative data, shown as the means ± SDs (n = 3), were analyzed with a two-tailed Student's t tests. *, P < 0.05; ***, P < 0.001. (D) The expression of viral proteins in CARD11-overexpressing chPNCs. The F48E9- (MOI = 0.01) and LaSota-infected (MOI = 1) CARD11-overexpressing cells at 36 hpi were analyzed by Western blot analysis with a guinea pig anti-LaSota P antibody, an anti-NP guinea pig PAb, an anti-HN guinea pig PAb, and an anti-M synthetic peptide (KLEKGHTLAKYNPFK) mouse PAb. The expression levels of viral proteins relative to that of β-tubulin were analyzed by densitometry. The results are presented as the means ± SDs from three independent experiments.
FIG 7
FIG 7
CARD11 depletion increases viral replication in chPNCs. (A and B) The downregulation of CARD11 in rAdV-shRNA-infected chPNCs. The cells were infected with rAdV-NC, rAdV-shRNA1, and rAdV-shRNA2 (MOI = 100) in 100-mm dishes. (A) At 48 hpi, CARD11 was detected using the IPE assay. (B) The relative mRNA expression of CARD11 was determined by RT-qPCR. The data were normalized to 28S rRNA. Representative data, shown as the means ± SDs (n = 3), were analyzed by two-tailed Student's t tests. *, P < 0.05; **. P < 0.01. (C) A virulent virus causes CPEs in CARD11-knockdown chPNCs. The rAdV-NC and rAdV-shRNA1 cells were infected with F48E9 (MOI = 0.01) and observed by IFA with a mouse anti-LaSota PAb. Bars, 50 μm. (D and E) Growth kinetics of NDV in CARD11-knockdown chPNCs. The cells were transfected with rAdV-shRNA1 (MOI = 100). At 48 hpi, the cells were infected with virulent F48E9 (MOI = 0.01) (D) and avirulent LaSota (MOI = 1) (E). The viral titers in the supernatants were analyzed with the TCID50 method. Representative data, shown as the means ± SDs (n = 3), were analyzed by two-tailed Student's t tests. *, P < 0.05. (F) Expression of viral proteins in the infected CARD11-knockdown cells. The F48E9- (MOI = 0.01) and LaSota-infected (MOI = 1) CARD11-shRNA1 cells at 36 hpi were analyzed by Western blot analysis as described for Fig. 6D. The expression level of viral proteins relative to that of β-tubulin was analyzed by densitometry. The results are presented as the means ± SDs from three independent experiments.
FIG 8
FIG 8
The CBM signalosome plays no role in inhibiting NDV replication in chPNCs. (A) The CPEs of inhibitors in chPNCs. The chPNCs in 12-well plates at day 3 were incubated with different concentrations of inhibitors for 24 h. The treated chPNCs were observed after 24 h. The black arrows indicate axon disappearance and cell body disruption. Bars, 50 μm. (B) NDV replication in inhibitor-treated chPNCs. The cells at day 3 were treated with BAY 11-7082 (1 μM), BMS-345541 (10 μM), MI-2 (1 μM), and DMSO for 24 h, and then the treated chPNCs were infected with the F48E9 strain (MOI = 0.01). The culture supernatants were harvested at 24 and 36 hpi. (C to F) F48E9 replication in CARD11-overexpressing or knockdown chPNCs treated with inhibitors. The cells at day 3 were infected with rAdV, rAdV-CARD11, rAdV-NC, and rAdV-shRNA1 at the same MOI (MOI = 100). At 48 hpi, the cells were treated with MI-2 (1 μM), BAY 11-7082 (1 μM), BMS-345541 (10 μM), and DMSO for 24 h. Then, the treated chPNCs were infected with the F48E9 strain (MOI = 0.01). The culture supernatants were harvested at 36 hpi for titration of F48E9. The viral titers in the supernatants of chPNCs were analyzed via the TCID50 method in DF-1 cells. (G) The inhibitory role of BAY 11-7082 and BMS-345541 in DF-1 cells. The DF-1 cells in 12-well plates were cotransfected with pchNF-κB-TA-luc and pRL-SV40-N at a ratio of 10:1. Twenty-four hours later, the cells were incubated with 1, 5, 8, or 10 μM BAY 11-7082, 0.1, 1, 5, or 10 μM BMS-345541, or DMSO for 24 h and were lysed to quantify the luciferase activity. Renilla luciferase expressed by pRL-SV40-N was used as the normalizing standard. All the representative data, shown as the means ± SDs (n = 3), were analyzed by two-tailed Student's t tests. ns, not significant; *, P < 0.05; **, P < 0.01; ***, P < 0.001.
FIG 9
FIG 9
CARD11 interacts with the viral P in chPNCs. (A) Endogenous CARD11 coimmunoprecipitates with viral P and NP. The chPNCs infected with F48E9 (MOI = 0.01) and avirulent LaSota (MOI = 1) were lysed at 48 hpi, and the proteins were immunoprecipitated using an anti-CARD11 mouse PAb. Before incubation, 40 μl of supernatants as input sample was treated with 10 μl 5× SDS loading buffer. The immunoprecipitated proteins were analyzed by Western blotting using an anti-LaSota P guinea pig PAb, an anti-LaSota NP guinea pig PAb, and an anti-LaSota HN guinea pig PAb. β-Tubulin and IgG were used as protein loading controls for the input and immunoprecipitated proteins. (B) Validation of CARD11 interaction with the viral P by co-IP assays in HEK293T cells. HEK293T cells were cotransfected with pcDNA3-2×Flag-CARD11 and pcDNA3-KHA-P, pcDNA3-KHA-NP, or pCAGGS-L. At 36 h posttransfection, the cell lysates were coimmunoprecipitated using an anti-Flag mouse MAb or an anti-HA rabbit Ab. Before incubating with antibodies, 40 μl of the supernatants as input sample was treated with 10 μl 5× SDS loading buffer. (C and D) Subcellular localization of CARD11 and the viral P in chPNCs. The cells were infected with F48E9 (MOI = 0.01) (C) and LaSota (MOI = 1) (D) and were analyzed at 0 and 12 hpi by IFA with a mouse anti-CARD11 PAb and an anti-LaSota P guinea pig PAb. CARD11 (red), P (green), and the nucleus (blue) were observed by confocal microscopy. The white arrow depicts colocalization. Bars, 10 μm. (E and F) Colocalization analysis of the CARD11 and viral P in the infected chPNCs at 12 hpi using ImageJ.
FIG 10
FIG 10
The CARD11 CC1 domain interacts with the X domain of the viral P. (A) Schematic representation of chicken CARD11. The domains are shown as different colored boxes. The amino acid size is depicted below the boxes. The abbreviation of each truncation is shown to the left of each schematic representation. (B to F) The interaction between the CARD11 CC1 domain and the P of F48E9 and the LaSota strain was validated using the co-IP assays. HEK293T cells were transfected with pcDNA3-2×Flag-CARD/LATCH/CC/ID, MAGUK, and pcDNA3-HA-P (F48E9) (B) and pcDNA3-HA-P (LaSota) (C). HEK293T cells were transfected with CARD/LATCH/CC (D), CARD/LATCH/CC1 (E), CARD/LATCH (F), and pcDNA3-HA-P (F48E9). The empty plasmids were used as negative controls. (G) Schematic representation of viral P and V. The domains are shown as different colored boxes. The amino acid size is depicted below the boxes. The abbreviation of each truncation is shown to the left of each schematic representation. PMD, a coiled-coil P-P multimerization domain; PNT, P N terminus; VCT, V protein C terminus. (H) No interaction of CARD/LATCH/CC/ID with viral V as determined by the co-IP assays. P with the deleted X domain (I) and P with the deleted PMD domain (J) did not interact with the CARD/LATCH/CC1 domain of CARD11. (K) The interaction between the CARD11 CC1 domain and the X domain of the F48E9 P. HEK293T cells were transfected with pcDNA3-2×Flag-CC1 and pCAGGS-X-GST. The empty plasmids were used as negative controls. All cell lysates were prepared at 36 h posttransfection and proteins were immunoprecipitated using an anti-Flag mouse MAb, an anti-HA rabbit MAb, or an anti-GST mouse MAb. The immunoprecipitated proteins were analyzed by Western blotting.
FIG 11
FIG 11
The viral P-L interaction is competitively hampered by CARD11. HEK293T cells were transfected with pcDNA3-2×Flag-NP (F48E9) (2 μg) and pcDNA3-HA-P (F48E9) (2 μg) (A), pcDNA3-HA-P (F48E9) (2 μg) and pCAGGS-L (2 μg), pcDNA3-2×Flag-NP (F48E9) (2 μg), and pCAGGS-L (2 μg) (B), pcDNA3-2×Flag-NP (F48E9) (2 μg), pcDNA3-HA-P (F48E9) (2 μg), and pCAGGS-L (2 μg) (C), and pcDNA3-2×Flag-NP (F48E9) (2 μg) and pcDNA3-HA-P ΔX domain (2 μg) or pcDNA3-HA-P ΔPMD domain (2 μg) (D). The cell lysates were prepared, and proteins were immunoprecipitated using DYKDDDK tag (3B9) mouse MAb or HA tag (C29F4) rabbit MAb. (E) Schematic representation of the truncations of N terminus in viral P. The domains are shown as different colored boxes. The amino acid size is depicted below the boxes. The abbreviation of each truncation is shown to the left of each schematic representation. (F) HEK293T cells were transfected with pCAGGS-L (2 μg) and pcDNA3-HA-P ΔX domain (2 μg), pcDNA3-HA-P ΔNP0-binding region (2 μg), or pcDNA3-HA-P Δdisordered region (2 μg). The cell lysates were prepared, and proteins were immunoprecipitated using a guinea pig anti-LaSota P PAb. (G) The interaction between the X domain of viral P and L. The cell lysates were prepared and immunoprecipitated using anti-GST mouse MAb. (H and I) HEK293T cells were transfected with different doses of pcDNA3-2×Flag-CARD11 or pCAGGS-L and pCAGGS-P and pcDNA3-HA-NP. The cells were lysed and immunoprecipitated using an anti-LaSota P guinea pig PAb. The protein loading controls are β-tubulin for input proteins and IgG for IP proteins. The expression levels of the L and CARD11 protein after immunoprecipitation relative to that of IgG were analyzed by densitometry. All the representative data, shown as the means ± SDs (n = 3), were analyzed by two-tailed Student's t tests. *, P < 0.05; **, P < 0.01; ***, P < 0.001.
FIG 12
FIG 12
CARD11 inhibits viral polymerase activity. (A) Establishment of NDV MG systems. The LaSota strain MG system was constructed under the T7 promoter with a firefly luciferase reporter (MG-Fluc). For the 3-plasmid system, the BHK-21 cells were cotransfected with pCAGGS-T7, pCMV-NP-P-L, and MG-Fluc at a ratio of 2:1:1. For the 5-plasmid system, the BHK-21 cells were cotransfected with pCAGGS-T7, MG-Fluc, pcDNA3-HA-NP, pcDNA3-HA-P, and pCAGGS-L at a ratio of 5:5:2:2:1 or without the three support plasmids, pCAGGS-L, and pCAGGS-T7. (B) CARD11 dose-dependently inhibits viral RNA polymerase activity using the 3-plasmid system. The BHK-21 cells were cotransfected with the 3-plasmid system and different doses of pcDNA3-2×Flag-CARD11. β-Tubulin was used as a protein loading control. (C to E) Viral RNA polymerase activity with different doses of P, NP, or L and CARD11 (1 μg) using the 3-plasmid system. The BHK-21 cells were cotransfected with the 3-plasmid system, pcDNA3-2×Flag (1 μg) or pcDNA3-2×Flag-CARD11 (1 μg), and additional P, NP, or L constructs (pcDNA3-HA-NP, pcDNA3-HA-P, or pCAGGS-L). (F) Inhibition of viral RNA polymerase activity by the CARD11 CC1 domain using a 3-plasmid system. The BHK-21 cells were cotransfected with the 3-plasmid system and truncated CARD11 constructs (1 μg) as well as with negative-control plasmids. β-Tubulin was used as a protein loading control. (G) The viral polymerase activity of P truncations and CARD11 (1 μg) using the 5-plasmid system. The BHK-21 cells were cotransfected with pCAGGS-T7, MG-Fluc, pcDNA3-HA-NP, pcDNA3-HA-P or pcDNA3-HA-P ΔX or pcDNA3-HA-P ΔPMD, and pCAGGS-L at a ratio of 5:5:2:2:1 or with pcDNA3-2×Flag-CARD11 (1 μg). In addition, the 5-plasmid system without the P was detected as previously described. All the cells above were cotransfected with pRL-SV40-N expressing Renilla luciferase as a normalizing standard and were lysed at 36 h posttransfection. All the representative data, shown as the means ± SDs (n = 3), were analyzed by two-tailed Student's t tests. ns, not significant; *, P < 0.05; **, P < 0.01; ***, P < 0.001.
FIG 13
FIG 13
Intracerebrally overexpressed CARD11 reduces neuropathology and viral replication in the brain. (A) Schematic representation of animal experiments. One-day-old chicks were intracerebrally injected with rAdV-CARD11, rAdV, and PBS. After 4 days, the birds were challenged with F48E9. Tissue samples were collected on day 10. (B) Survival rates of the F48E9-challenged chicks. (C) Lesions on the cerebrum, cerebellum, and glandular stomach at 6 dpc. The black arrows indicate the indistinct boundary between the cerebrum and cerebellum. The blue arrows indicate hyperemia in F48E9-infected brains. The yellow arrows indicate the glandular papillary hemorrhage. i.c., intracerebral injection; o.n., ocular-nasal route. (D) HE and IHC assays at 6 dpc. The black arrows indicate perivascular cuffing in the cerebrum. The red arrows indicate edema in the cerebrum. The blue arrows indicate hemorrhage in the substantia alba of the cerebellum. The yellow arrows indicate the epithelial hemorrhage, swelling, necrosis, and even exfoliation in the compound tubular glands of glandular stomach. The blue arrowhead indicates the detachment of Purkinje cells from the stratum granulosum in the cerebellum. The black arrowheads indicate the detected CARD11 in cells of mock chicks. The green arrowheads indicate the detected virus or CARD11 in the cells of F48E9-challenged chicks. (E) CARD11 expression in the cerebrum, cerebellum, and glandular stomach before and after the F48E9 challenge. (F) The viral replication of F48E9 in the cerebrum, cerebellum, and glandular stomach. The tissues were homogenized, and viral titers in the supernatants were measured in DF-1 cells using the TCID50 method. Representative data from three independent experiments, shown as the means ± SDs (n = 3), were analyzed by two-tailed Student's t tests. ns, not significant; *, P < 0.05; **, P < 0.01.

Similar articles

Cited by

References

    1. Ludlow M, Kortekaas J, Herden C, Hoffmann B, Tappe D, Trebst C, Griffin DE, Brindle HE, Solomon T, Brown AS, van Riel D, Wolthers KC, Pajkrt D, Wohlsein P, Martina BEE, Baumgartner W, Verjans GM, Osterhaus A. 2016. Neurotropic virus infections as the cause of immediate and delayed neuropathology. Acta Neuropathol 131:159–184. doi:10.1007/s00401-015-1511-3. - DOI - PMC - PubMed
    1. Dahm T, Rudolph H, Schwerk C, Schroten H, Tenenbaum T. 2016. Neuroinvasion and inflammation in viral central nervous system infections. Mediators Inflamm 2016:8562805. doi:10.1155/2016/8562805. - DOI - PMC - PubMed
    1. Soung A, Klein RS. 2018. Viral encephalitis and neurologic diseases: focus on astrocytes. Trends Mol Med 24:950–962. doi:10.1016/j.molmed.2018.09.001. - DOI - PMC - PubMed
    1. Chen Z, Wang X, Ashraf U, Zheng B, Ye J, Zhou D, Zhang H, Song Y, Chen H, Zhao S, Cao S. 2018. Activation of neuronal N-methyl-d-aspartate receptor plays a pivotal role in Japanese encephalitis virus-induced neuronal cell damage. J Neuroinflammation 15:238. doi:10.1186/s12974-018-1280-8. - DOI - PMC - PubMed
    1. Xu Q, Zhu N, Chen S, Zhao P, Ren H, Zhu S, Tang H, Zhu Y, Qi Z. 2017. E3 ubiquitin ligase Nedd4 promotes Japanese encephalitis virus replication by suppressing autophagy in human neuroblastoma cells. Sci Rep 7:45375. doi:10.1038/srep45375. - DOI - PMC - PubMed

Publication types

MeSH terms

Substances