. 2019 Sep 10:12:213.
doi: 10.3389/fnmol.2019.00213. eCollection 2019.

A Conserved Tyrosine Residue in Slitrk3 Carboxyl-Terminus Is Critical for GABAergic Synapse Development

Affiliations

A Conserved Tyrosine Residue in Slitrk3 Carboxyl-Terminus Is Critical for GABAergic Synapse Development

Jun Li et al. Front Mol Neurosci. .

Abstract

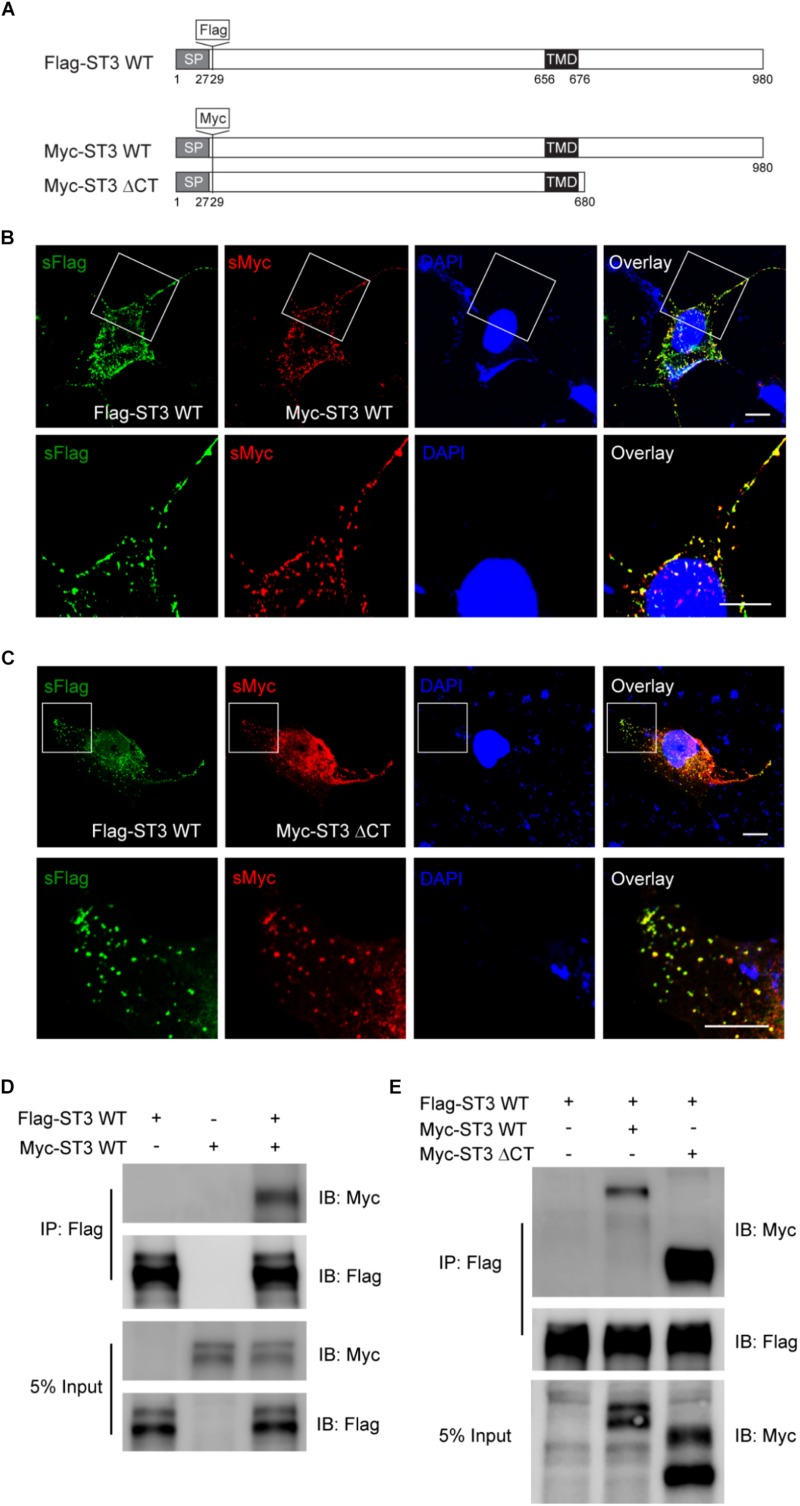
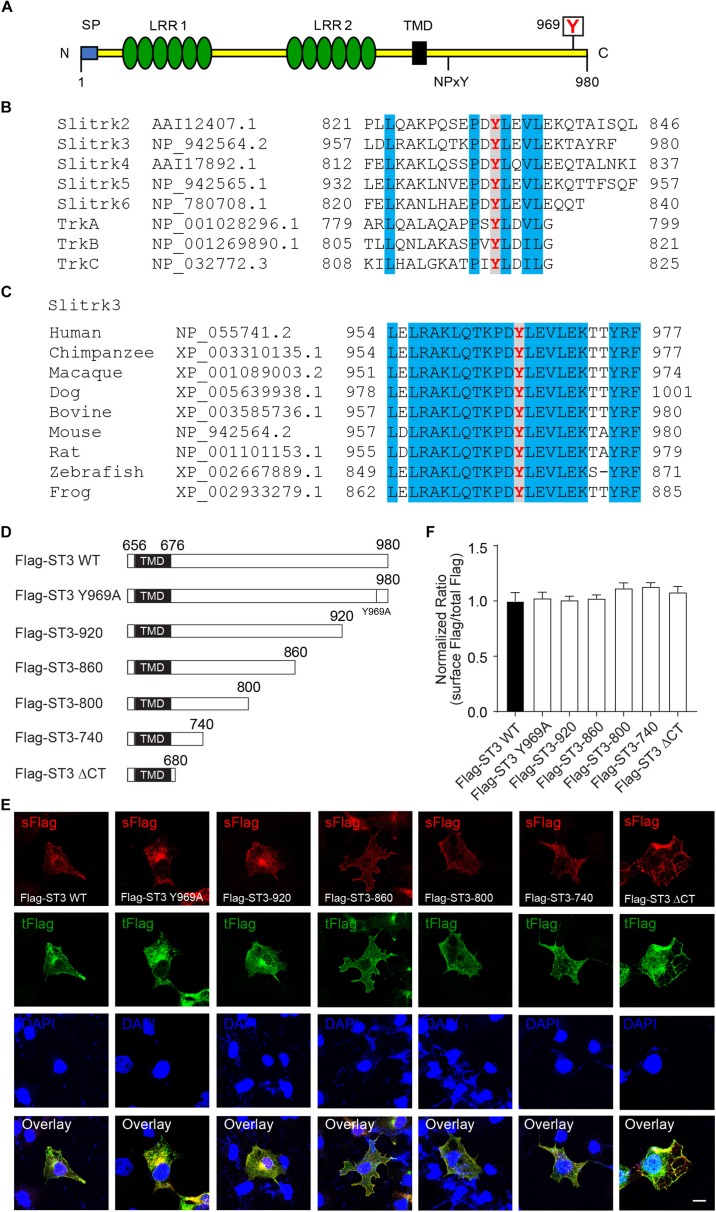
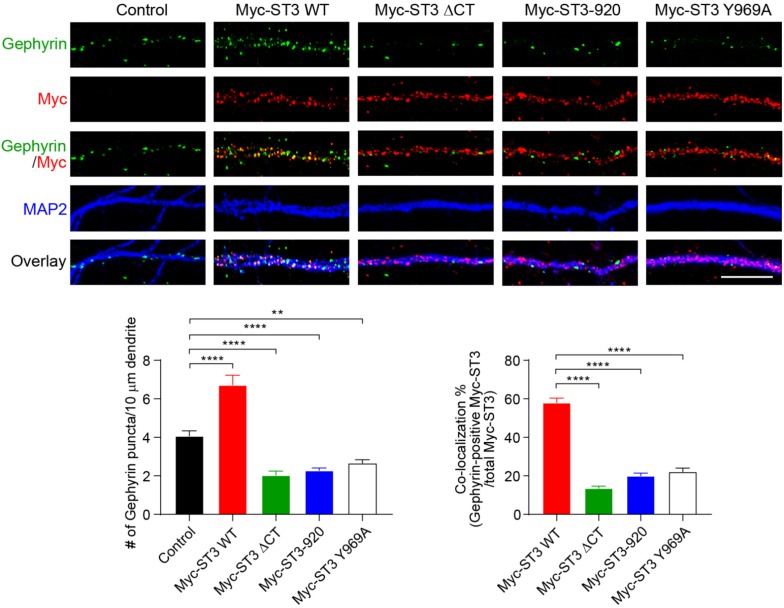
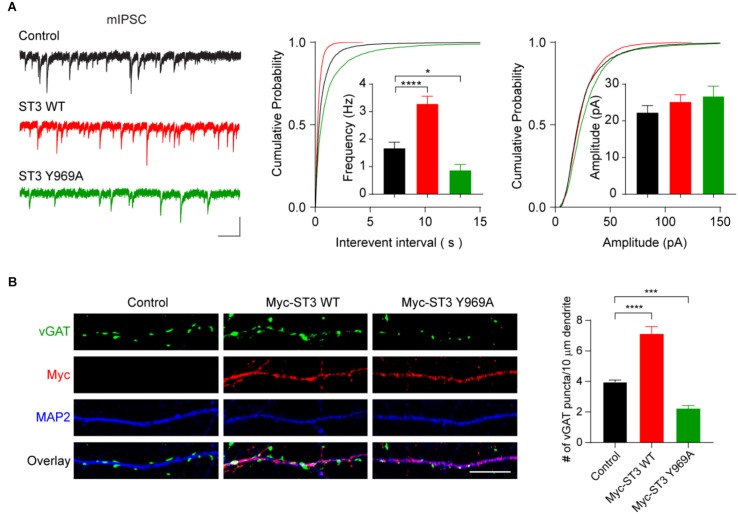
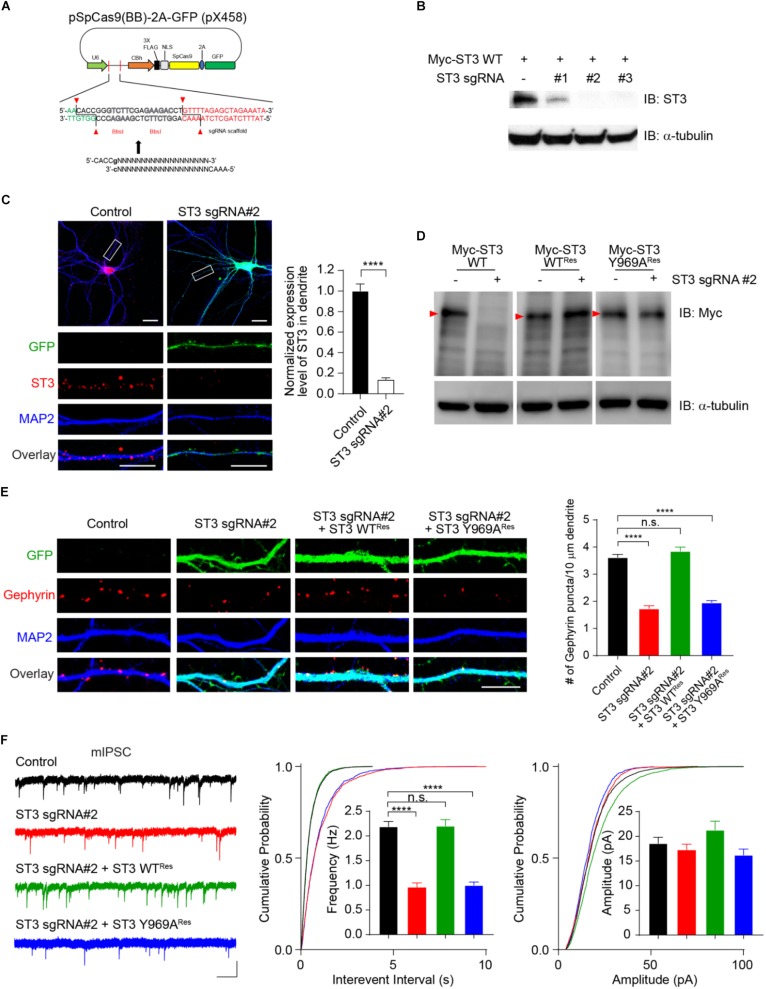
Single-passing transmembrane protein, Slitrk3 (Slit and Trk-like family member 3, ST3), is a synaptic cell adhesion molecule highly expressed at inhibitory synapses. Recent studies have shown that ST3, through its extracellular domain, selectively regulates inhibitory synapse development via the trans-synaptic interaction with presynaptic cell adhesion molecule, receptor protein tyrosine phosphatase δ (PTPδ) and the cis-interaction with postsynaptic cell adhesion molecule, Neuroligin 2 (NL2). However, little is known about the physiological function of ST3 intracellular, carboxyl (C)-terminal region. Here we report that in heterologous cells, ST3 C-terminus is not required for ST3 homo-dimerization and trafficking to the cell surface. In contrast, in hippocampal neurons, ST3 C-terminus, more specifically, the conserved tyrosine Y969 (in mice), is critical for GABAergic synapse development. Indeed, overexpression of ST3 Y969A mutant markedly reduced the gephyrin puncta density and GABAergic transmission in hippocampal neurons. In addition, single-cell genetic deletion of ST3 strongly impaired GABAergic transmission. Importantly, wild-type (WT) ST3, but not the ST3 Y969A mutant, could fully rescue GABAergic transmission deficits in neurons lacking endogenous ST3, confirming a critical role of Y969 in the regulation of inhibitory synapses. Taken together, our data identify a single critical residue in ST3 C-terminus that is important for GABAergic synapse development and function.

Keywords: GABAergic synapse; GABAergic synapse development; Slitrk3; cell adhesion molecule; gephyrin; hippocampus; inhibition; tyrosine.


Figures

FIGURE 1
FIGURE 1
ST3 C-terminus is not required for ST3 homo-dimerization in heterologous cells. (A) Schematic of Flag-ST3 WT, Myc-ST3 WT, and Myc-ST3 ΔCT. Flag or Myc tag was inserted at amino acid 29. Signal peptide (SP). (B,C) Representative images (top panel, low magnification; bottom panel, high magnification of the boxed area at the top) showing surface (s) Flag-ST3 co-localized with surface Myc-ST3 (B) or surface Myc-ST3 ΔCT (C) in COS7 cells. Scale bar, 10 μm. (D,E) Co-IP assay of Flag-ST3 with Myc-ST3 (D) or Myc-ST3 ΔCT (E) in HEK293T cells. Cell lysates from HEK293T cells transfected with Flag-ST3, Myc-ST3, or Flag-ST3 together with Myc-ST3 or Myc-ST3 ΔCT, were immunoprecipitated with agarose beads conjugated with anti-Flag antibody, and then probed with indicated antibodies. IB, immunoblotting. Both Myc-ST3 (D) or Myc-ST3 ΔCT (E) were co-IPed with Flag-ST3. N = 3 independent repeats.
FIGURE 2
FIGURE 2
ST3 C-terminus is not necessary for surface expression of ST3 in heterologous cells. (A) Schematic of ST3 showing LRR1 and LRR2 clusters in its extracellular region, and the intracellular conserved tyrosine residues. N, N-terminus; C, C-terminus; SP, signal peptide; LRR1, leucine-rich repeats cluster 1; LRR2, leucine-rich repeats cluster 2; TMD, transmembrane domain; NPxY, NPxY motif; boxed Y, a conserved tyrosine residue in Slitrks and Trk receptors. (B) Amino acid sequence alignment of the C-termini of mouse Slitrk and Trk proteins. The tyrosine in red indicates the conserved residues (Y969 in mouse ST3) in Slitrks and Trk receptors, and residues in blue indicate other conserved amino acid residues between Slitrks and Trk receptors. (C) Cross species alignment of the ST3 C-termini. The tyrosine in red indicates the conserved residues (Y969 in mouse ST3) in ST3 C-termini from nine different vertebrate species, and residues in blue indicate other conserved amino acid residues across different species in the distal Slitrk3 C-termini. (D) Schematic of WT and C-terminal mutant forms of Flag-ST3. TMD, transmembrane domain. (E,F) Representative images showing surface (s) and total (t) Flag expressions of Flag-ST3 WT or Flag-ST3 mutants in COS7 cells. The ratios of surface to total fluorescent intensity were calculated and showed that ST3 C-terminus was not required for ST3 expression at the cell surface (n ≥ 14 for each group, One-way ANOVA test, p > 0.05, N = 3 independent experiments). Scale bar, 10 μm.
FIGURE 3
FIGURE 3
Identification of a critical residue Y969 in ST3 C-terminus that is important for GABAergic synapse development in hippocampal neurons. Representative images of dendrites (top) and quantification analysis (bottom) showed that overexpression of WT Myc-ST3 significantly increased gephyrin puncta density in cultured hippocampal neurons, whereas overexpression of Myc-ST3 ΔCT, Myc-ST3-920, in which the last 60 amino acids of ST3 were deleted, or the Myc-ST3 Y969A mutant significantly decreased gephyrin puncta density (Control, 4.07 ± 0.27, n = 12; Myc-ST3 WT, 6.72 ± 0.52, n = 12; Myc-ST3 ΔCT, 2.03 ± 0.22, n = 9; Myc-ST3-920, 2.28 ± 0.13, n = 18; Myc-ST3 Y969A, 2.66 ± 0.18, n = 11. One-way ANOVA test, ∗∗∗∗p < 0.0001, ∗∗p < 0.01. N = 3 independent experiments). Overexpression of Myc-ST3 Y969A also significantly decreased co-localization between ST3 and gephyrin (percentage of co-localization: Myc-ST3 WT, 57.96 ± 2.38, n = 12; Myc-ST3 ΔCT, 13.59 ± 1.03, n = 9; Myc-ST3-920, 19.98 ± 1.45, n = 18; Myc-ST3 Y969A, 22.04 ± 1.98, n = 11. One-way ANOVA test, ∗∗∗∗p < 0.0001. N = 3 independent experiments). Scale bar, 10 μm.
FIGURE 4
FIGURE 4
Y969 in ST3 C-terminus is critical for GABAergic synaptic transmission. (A) mIPSC recording showed that overexpression of WT Myc-ST3 (co-expressed with GFP) significantly increased mIPSC frequency, whereas overexpression of the Myc-ST3 Y969A mutant significantly reduced the frequency of mIPSCs in hippocampal cultured neurons. Insets showed the mean ± SEM of mIPSC frequency and amplitude, respectively [Frequency (Hz): Control, 1.67 ± 0.22, n = 15; ST3 WT, 3.29 ± 0.28, n = 13; ST3 Y969A, 0.87 ± 0.21, n = 12. One-way ANOVA test, ∗∗∗∗p < 0.0001, p < 0.05. Kolmogorov–Smirnov (K–S) test, p < 0.0001 between Control and ST3 WT or ST3 Y969A for interevent interval. Amplitude (pA): Control, 22.29 ± 1.87, n = 15; ST3 WT, 25.18 ± 1.96, n = 13; ST3 Y969A, 26.78 ± 2.67, n = 12. One-way ANOVA test, p > 0.05. K–S test, p < 0.05 between Control and ST3 WT for amplitude, p < 0.0001 between Control and ST3 Y969A for amplitude. N = 3 independent experiments]. Scale bar, 20 pA and 1 s. (B) Representative images of dendrites (left) and quantification analysis (right) showed that overexpression of Myc-ST3 WT significantly increased vGAT puncta density in cultured hippocampal neurons, whereas overexpression of Myc-ST3 Y969A mutant significantly decreased vGAT puncta density (Control, 3.97 ± 0.13, n = 14; Myc-ST3 WT, 7.13 ± 0.46, n = 11; Myc-ST3 Y969A, 2.23 ± 0.19, n = 12. One-way ANOVA test, ∗∗∗∗p < 0.0001, ∗∗∗p < 0.001. N = 3 independent experiments), Scale bar, 10 μm.
FIGURE 5
FIGURE 5
Single-cell genetic deletion and rescue of ST3 reveal the importance of Y969 in the regulation of GABAergic transmission. (A) Schematic diagram of CRISPR/Cas9 vector (simultaneously expresses GFP) targeting ST3 gene loci in mouse genome. (B) Screening of knockout effect of candidate sgRNAs in HEK293T cells. Western blot analysis showed that sgRNA#2 and sgRNA#3, but not sgRNA#1, strongly reduced ST3 expression in HEK293T cells. α-tubulin was used as an internal control. N = 3 independent repeats. (C) Confocal images and quantification analysis showed a significant decrease of ST3 expression in the dendritic region of hippocampal neurons expressing sgRNA#2 (Control, 1.0 ± 0.07, n = 12; ST3 sgRNA#2, 0.14 ± 0.02, n = 12, unpaired t-test, ∗∗∗∗p < 0.0001. N = 3 independent repeats). Scale bar, 20 mm (top) and 10 mm (bottom). (D) Western blot analysis validated the expression of sgRNA#2 resistant WT ST3 (ST3 WTRes) and the Y969A mutant (ST3 Y969ARes) in HEK293T cells. α-tubulin was used as an internal control. Red arrow heads indicated Myc-ST3 protein bands. N = 3 independent repeats. (E) Representative images and quantification analysis showed that the decrease of gephyrin puncta density in hippocampal neurons expressing ST3 sgRNA#2 could be rescued by co-expressing ST3 WTRes, but not ST3 Y969ARes (Control, 3.62 ± 0.11, n = 15; ST3 sgRNA#2, 1.73 ± 0.10, n = 13; ST3 sgRNA#2 + ST3 WTRes, 3.85 ± 0.14, n = 13; ST3 sgRNA#2 + ST3 Y969ARes, 1.96 ± 0.07, n = 14. One-way ANOVA test, ∗∗∗∗p < 0.0001. N = 3 independent repeats). Scale bar, 10 mm. (F) mIPSC recording data showed that sgRNA#2 resistant WT ST3, but not ST3 Y969A, could fully rescue GABAergic transmission deficits in hippocampal cultured neurons expressing sgRNA#2. Insets displayed the mean ± SEM frequency and amplitude, respectively [Frequency (Hz): Control, 2.19 ± 0.11, n = 12; ST3 sgRNA#2, 0.96 ± 0.09, n = 10; ST3 sgRNA#2 + ST3 WTRes, 2.2 ± 0.13, n = 10; ST3 sgRNA#2 + ST3 Y969ARes, 1.0 ± 0.06, n = 10. One-way ANOVA test, ∗∗∗∗p < 0.0001. K–S test, p < 0.0001 between Control and ST3 sgRNA#2 or ST3 sgRNA#2 + ST3 Y969ARes for interevent interval. Amplitude (pA): Control, 18.59 ± 1.23, n = 12; ST3 sgRNA#2, 17.25 ± 1.18, n = 10; ST3 sgRNA#2 + ST3 WTRes, 21.31 ± 1.79, n = 10; ST3 sgRNA#2 + ST3 Y969ARes, 16.21 ± 1.21, n = 10. One-way ANOVA test, p > 0.05. K–S test, p < 0.0001 between Control and ST3 sgRNA#2 + ST3 WTRes for amplitude, p < 0.001 between Control and ST3 sgRNA#2 + ST3 Y969ARes for amplitude. N = 3 independent repeats]. Scale bar, 20 pA and 1 s.

Similar articles

Cited by

  • SLITRK2 variants associated with neurodevelopmental disorders impair excitatory synaptic function and cognition in mice.
    El Chehadeh S, Han KA, Kim D, Jang G, Bakhtiari S, Lim D, Kim HY, Kim J, Kim H, Wynn J, Chung WK, Vitiello G, Cutcutache I, Page M, Gecz J, Harper K, Han AR, Kim HM, Wessels M, Bayat A, Jaén AF, Selicorni A, Maitz S, de Brouwer APM, Silfhout AV, Armstrong M, Symonds J, Küry S, Isidor B, Cogné B, Nizon M, Feger C, Muller J, Torti E, Grange DK, Willems M, Kruer MC, Ko J, Piton A, Um JW. El Chehadeh S, et al. Nat Commun. 2022 Jul 15;13(1):4112. doi: 10.1038/s41467-022-31566-z. Nat Commun. 2022. PMID: 35840571 Free PMC article.
  • Human mutations in SLITRK3 implicated in GABAergic synapse development in mice.
    Efthymiou S, Han W, Ilyas M, Li J, Yu Y, Scala M, Malintan NT, Ilyas M, Vavouraki N, Mankad K, Maroofian R, Rocca C, Salpietro V, Lakhani S, Mallack EJ, Palculict TB, Li H, Zhang G, Zafar F, Rana N, Takashima N, Matsunaga H, Manzoni C, Striano P, Lythgoe MF, Aruga J, Lu W, Houlden H. Efthymiou S, et al. Front Mol Neurosci. 2024 Mar 1;17:1222935. doi: 10.3389/fnmol.2024.1222935. eCollection 2024. Front Mol Neurosci. 2024. PMID: 38495551 Free PMC article.

References

    1. Aruga J., Mikoshiba K. (2003). Identification and characterization of slitrk, a novel neuronal transmembrane protein family controlling neurite outgrowth. Mol. Cell. Neurosci. 24 117–129. 10.1016/s1044-7431(03)00129-5 - DOI - PubMed
    1. Beaubien F., Raja R., Kennedy T. E., Fournier A. E., Cloutier J. F. (2016). Slitrk1 is localized to excitatory synapses and promotes their development. Sci. Rep. 6:27343. 10.1038/srep27343 - DOI - PMC - PubMed
    1. Clarke L. E., Barres B. A. (2013). Emerging roles of astrocytes in neural circuit development. Nat. Rev. Neurosci. 14 311–321. 10.1038/nrn3484 - DOI - PMC - PubMed
    1. Dani V. S., Chang Q., Maffei A., Turrigiano G. G., Jaenisch R., Nelson S. B. (2005). Reduced cortical activity due to a shift in the balance between excitation and inhibition in a mouse model of rett syndrome. Proc. Natl. Acad. Sci. U.S.A. 102 12560–12565. 10.1073/pnas.0506071102 - DOI - PMC - PubMed
    1. Dudek F. E. (2009). Epileptogenesis: a new twist on the balance of excitation and inhibition. Epilepsy Curr. 9 174–176. 10.1111/j.1535-7511.2009.01334.x - DOI - PMC - PubMed