. 2019 Oct;15(10):1001-1008.
doi: 10.1038/s41589-019-0364-9. Epub 2019 Sep 23.

Near-equilibrium glycolysis supports metabolic homeostasis and energy yield

Affiliations

Near-equilibrium glycolysis supports metabolic homeostasis and energy yield

Junyoung O Park et al. Nat Chem Biol. 2019 Oct.

Abstract

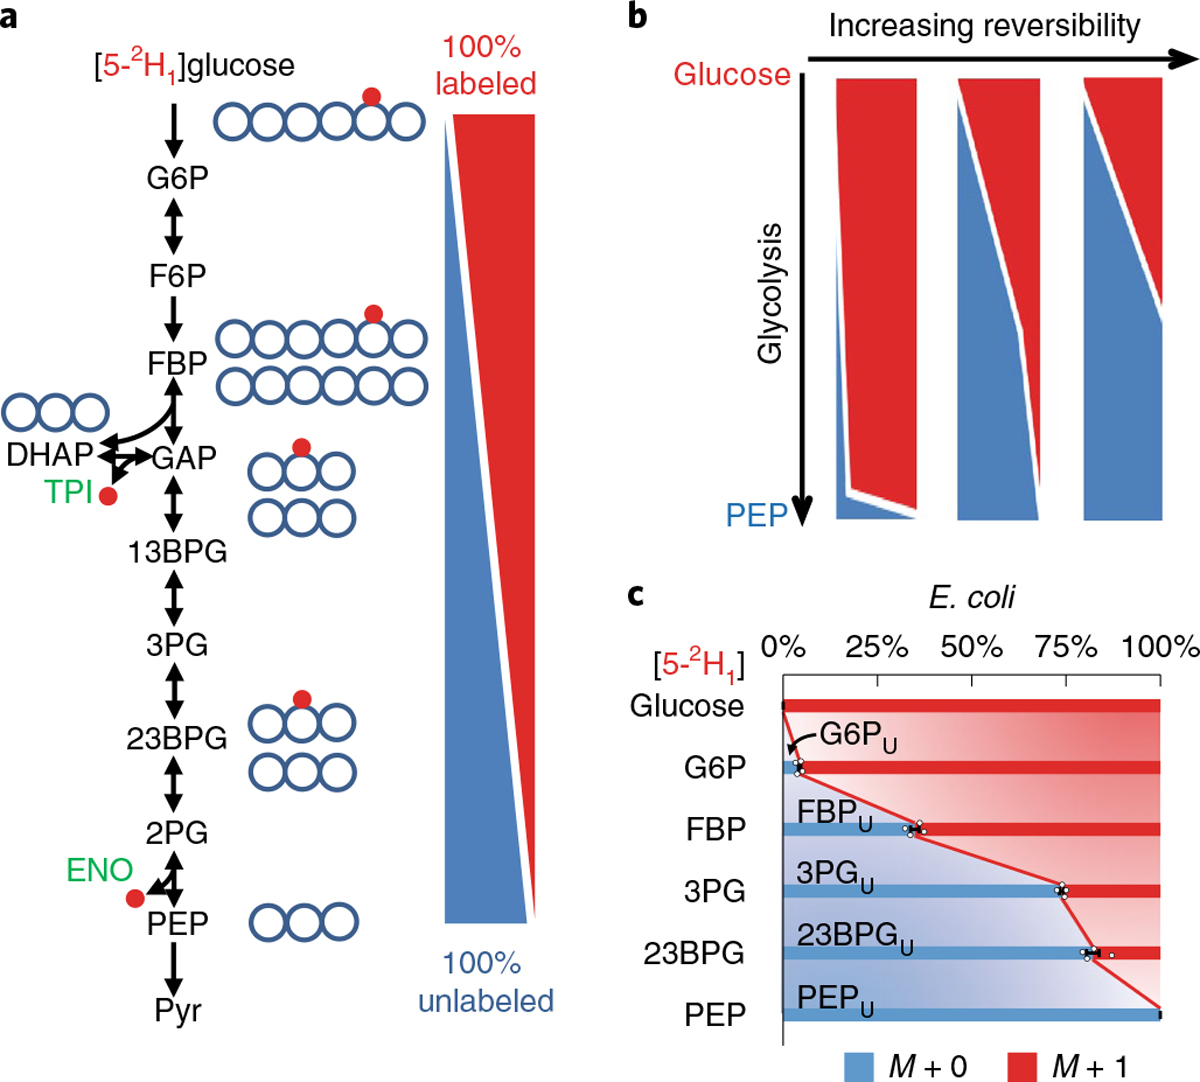
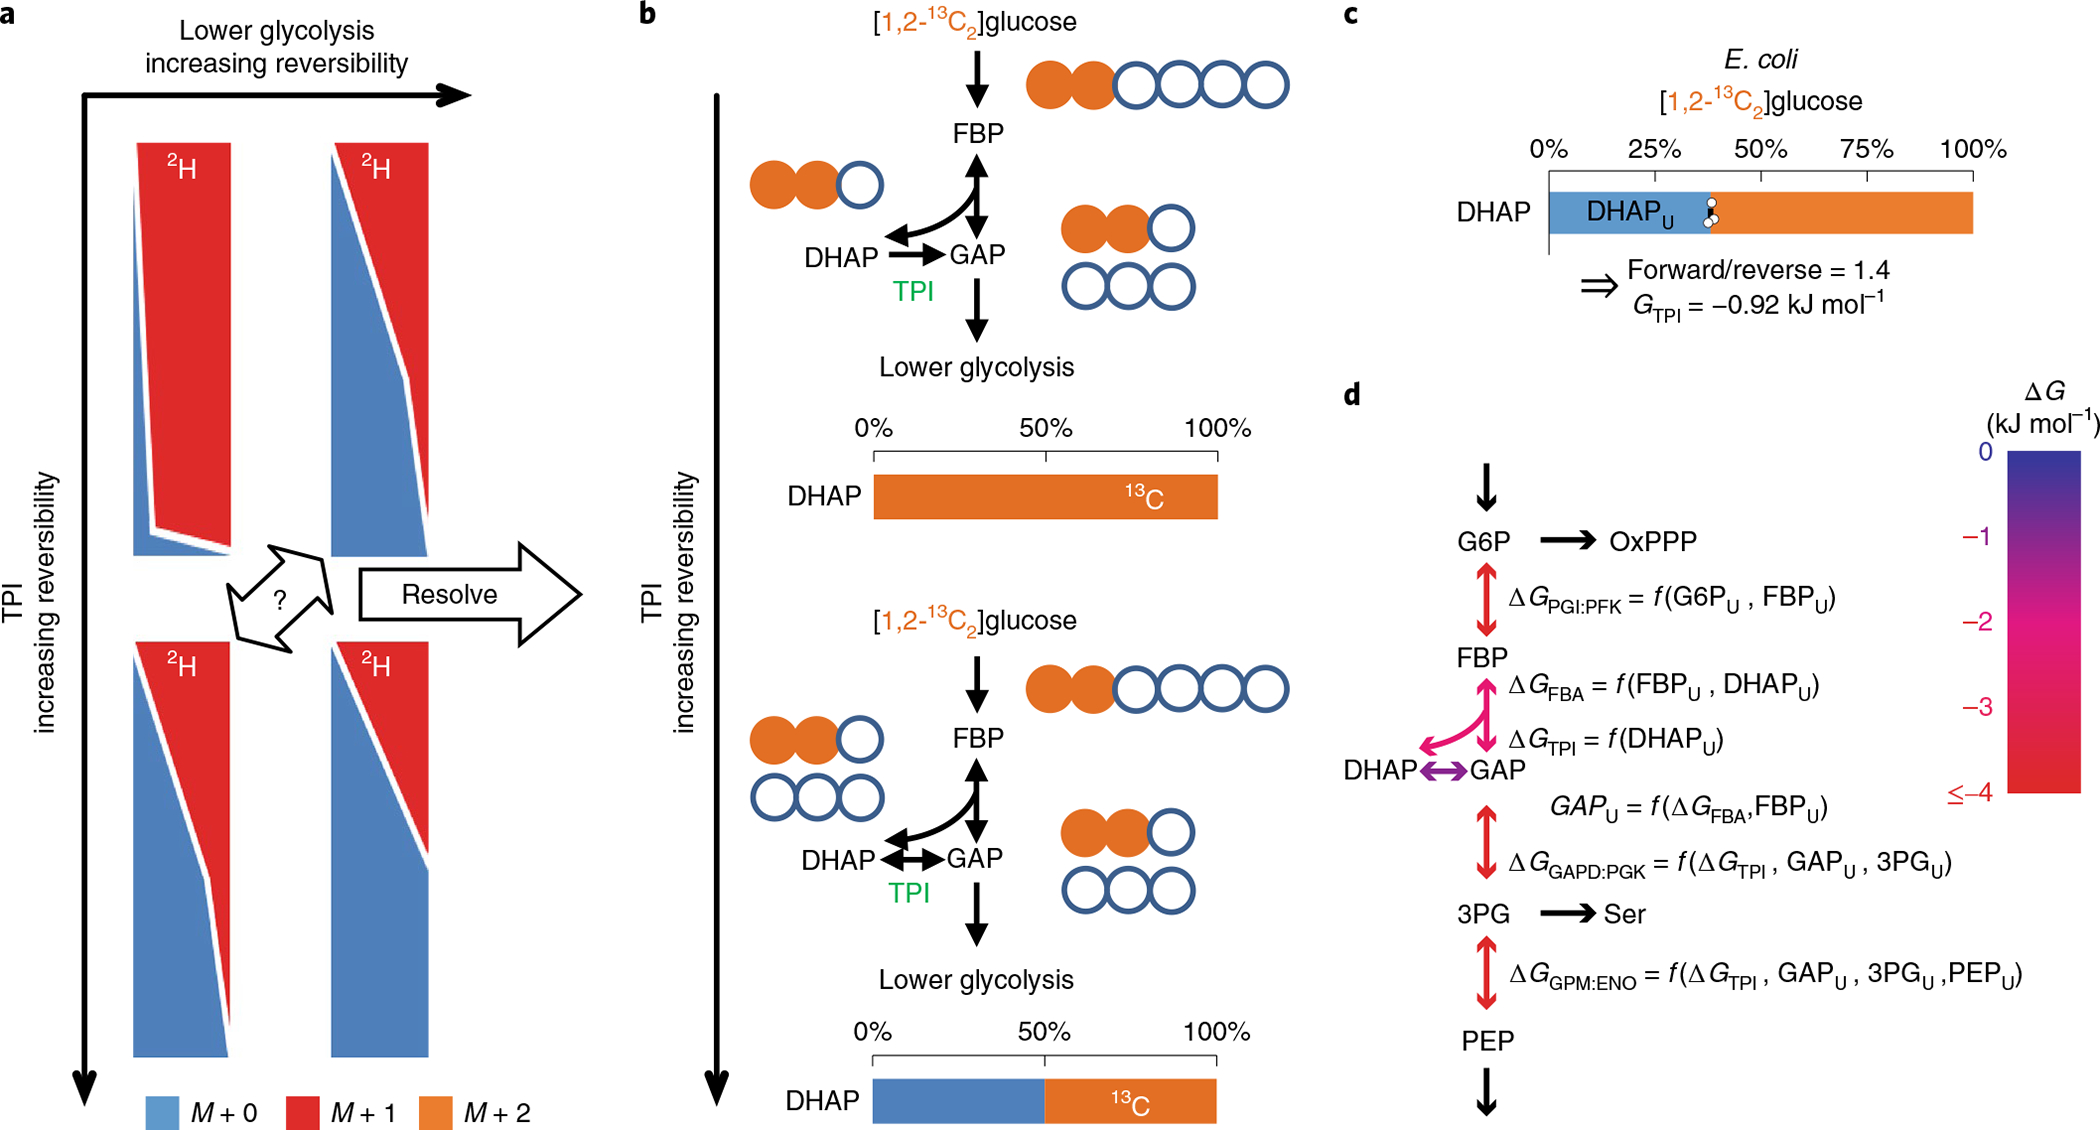
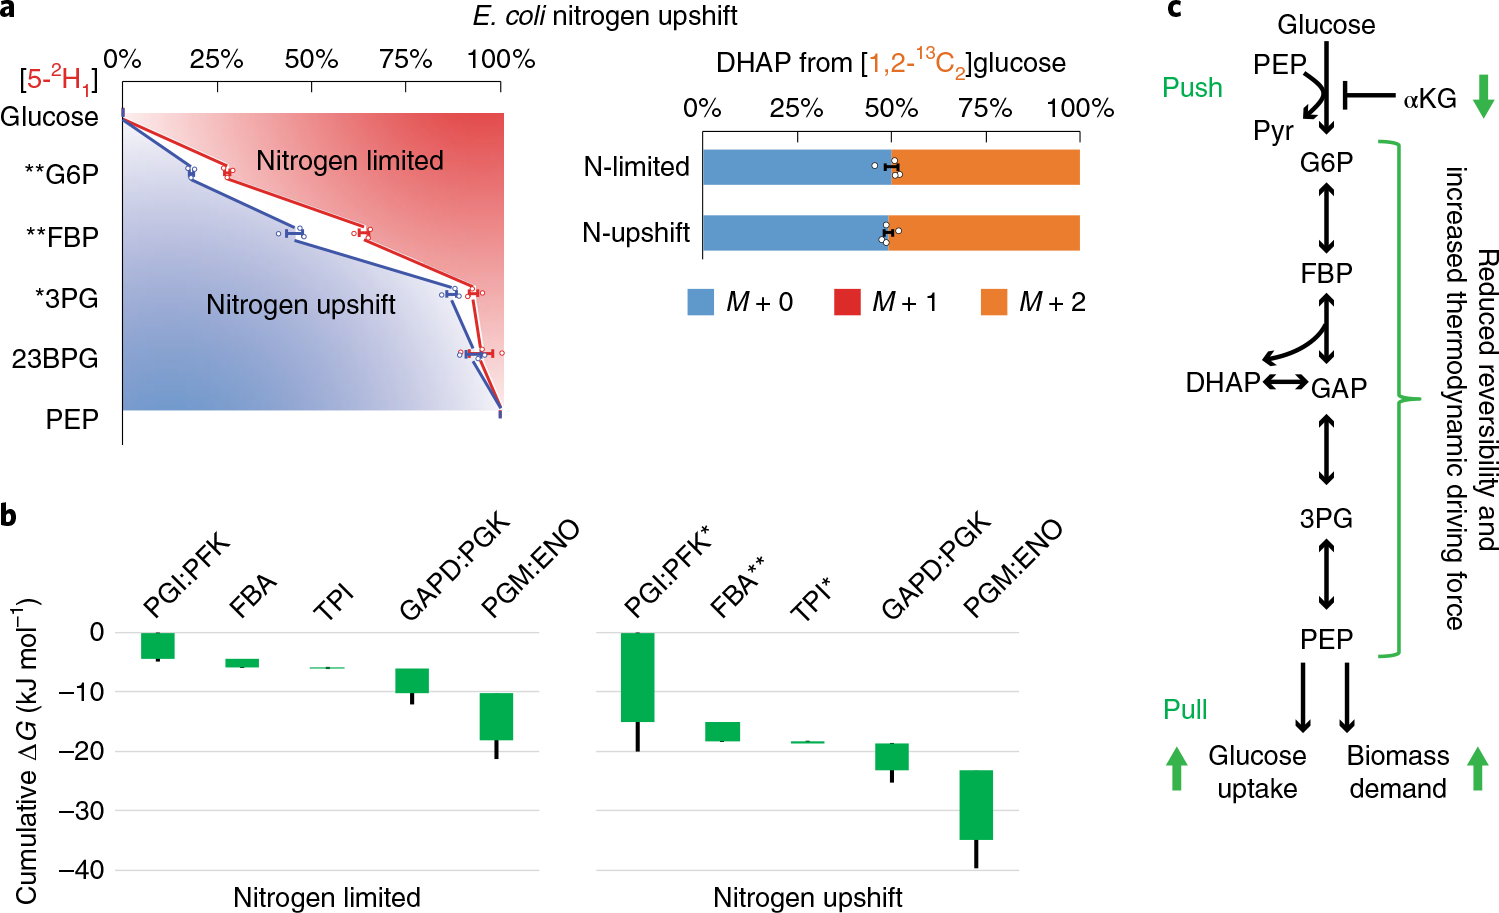
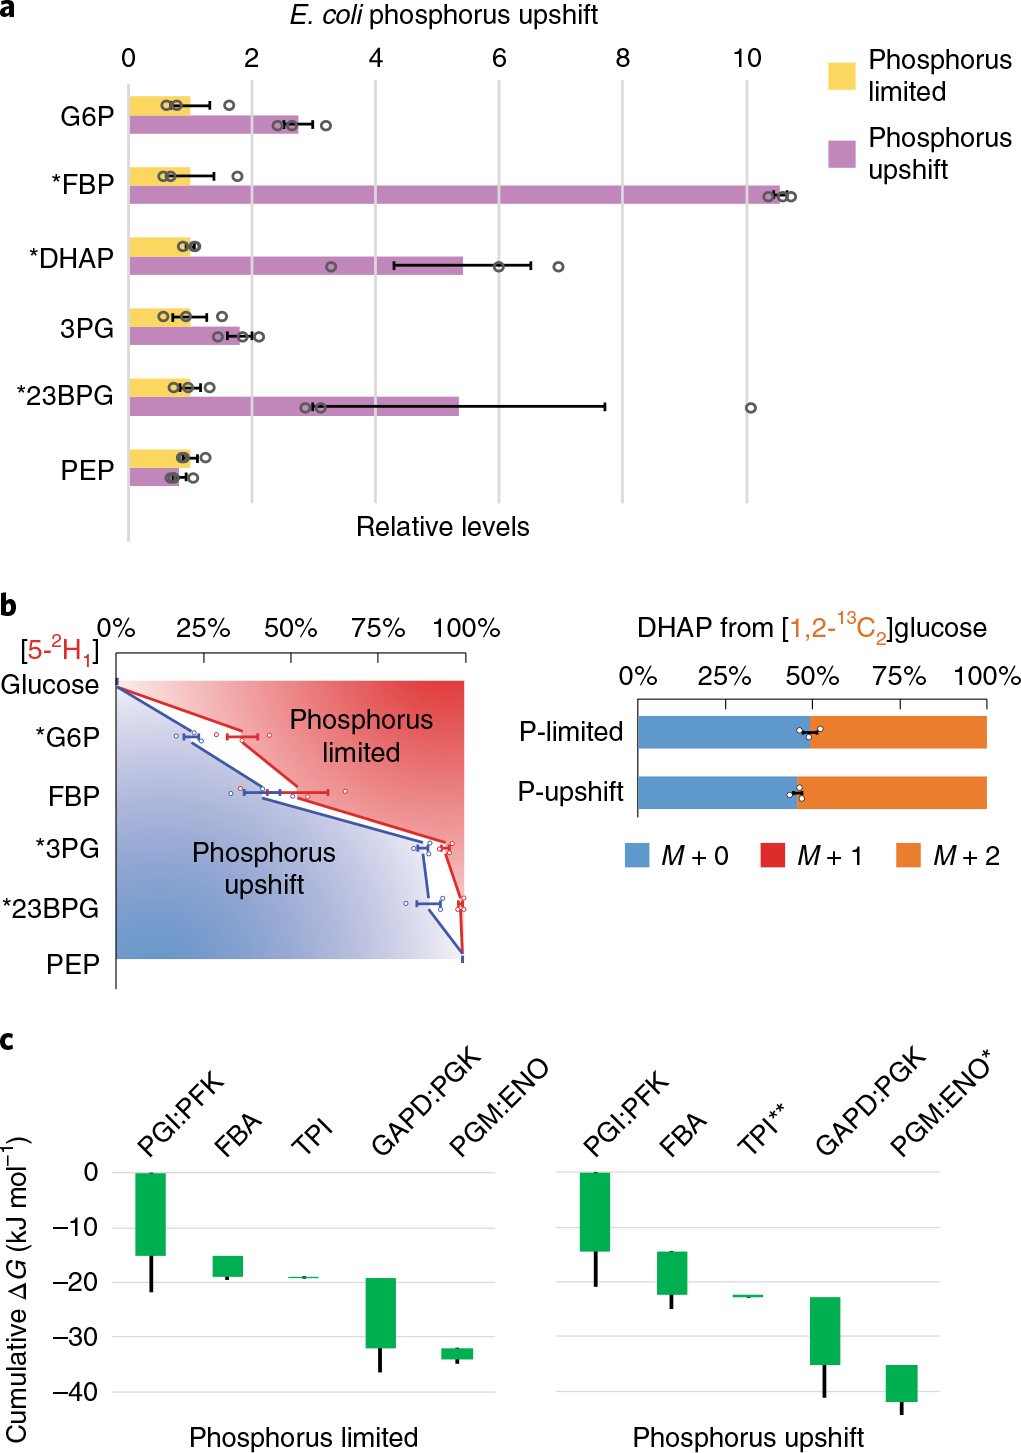
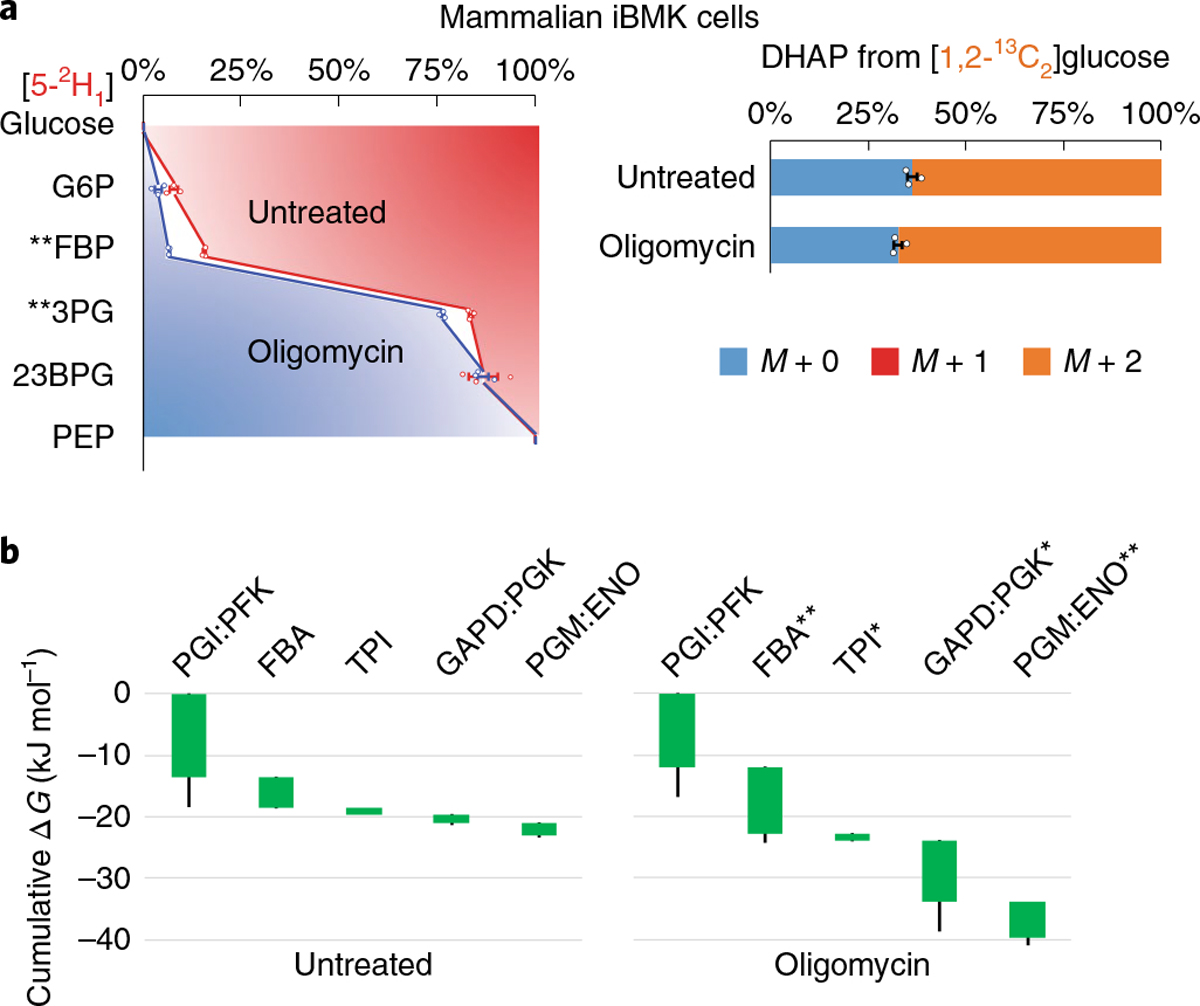
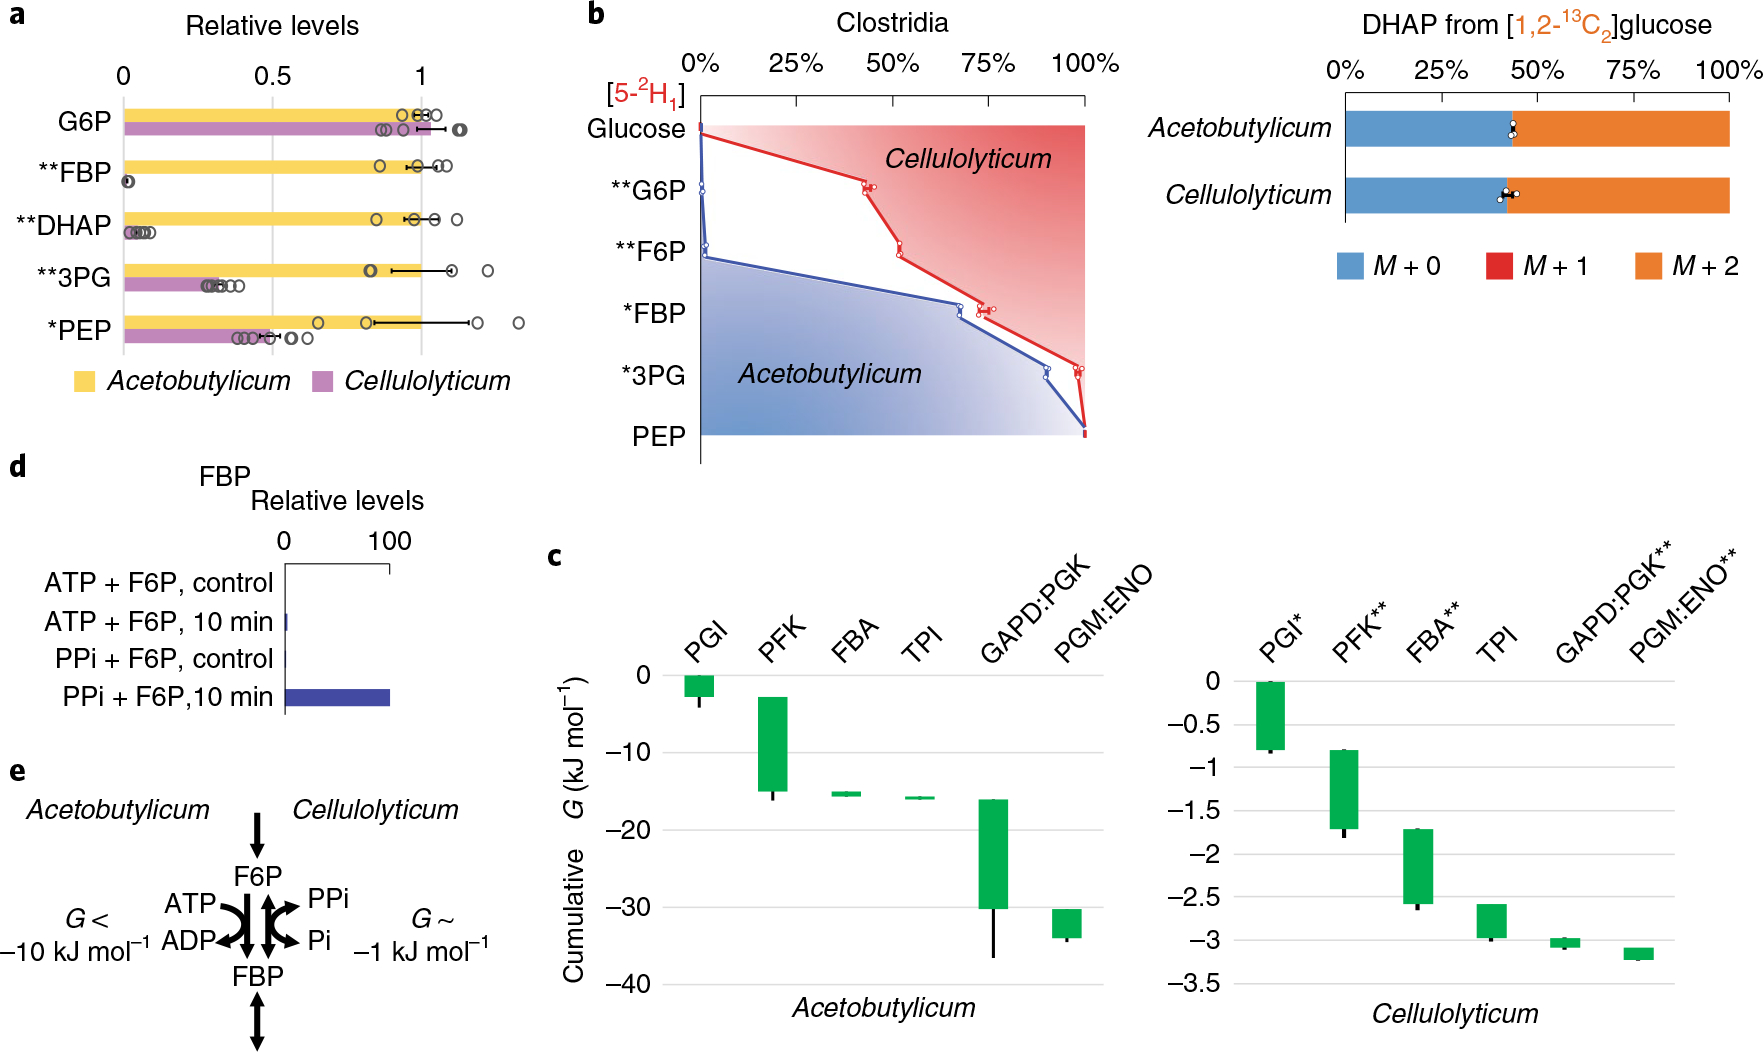
Glycolysis plays a central role in producing ATP and biomass. Its control principles, however, remain incompletely understood. Here, we develop a method that combines 2H and 13C tracers to determine glycolytic thermodynamics. Using this method, we show that, in conditions and organisms with relatively slow fluxes, multiple steps in glycolysis are near to equilibrium, reflecting spare enzyme capacity. In Escherichia coli, nitrogen or phosphorus upshift rapidly increases the thermodynamic driving force, deploying the spare enzyme capacity to increase flux. Similarly, respiration inhibition in mammalian cells rapidly increases both glycolytic flux and the thermodynamic driving force. The thermodynamic shift allows flux to increase with only small metabolite concentration changes. Finally, we find that the cellulose-degrading anaerobe Clostridium cellulolyticum exhibits slow, near-equilibrium glycolysis due to the use of pyrophosphate rather than ATP for fructose-bisphosphate production, resulting in enhanced per-glucose ATP yield. Thus, near-equilibrium steps of glycolysis promote both rapid flux adaptation and energy efficiency.


Conflict of interest statement

Competing interests

The authors declare no competing interests.

Figures

Fig. 1 |
Fig. 1 |. Visualizing the extent of glycolysis reversibility using [5-2H1]glucose.
a, The deuterium of [5-2H1]glucose is removed from glycolytic intermediates in the reverse triose phosphate isomerase (TPI: DHAP ⇌ GAP) and forward enolase (ENO: 2PG ⇌ PEP) reactions, leading to a descending gradient of 2H enrichment along glycolysis. b, Increasing reversibility of glycolysis results in 2H depleting earlier in the pathway. c, Labeling data from [5-2H1]glucose in E. coli: metabolite names with subscript U indicate unlabeled fractions. The center and error bars represent the mean ± s.e.m. (n = 4, biologically independent samples).
Fig. 2 |
Fig. 2 |. Simultaneous 2H and 13C labeling reveals ΔG.
a, [5-2H1]Glucose tracing alone falls short because each isotope labeling gradient could be the result of varying combinations of TPI and lower glycolysis reversibility. b, If TPI reversibility is known, the reversibility and ΔG of glycolysis can be determined. [1,2-13C2]Glucose reveals TPI reversibility and ΔG. As the reverse TPI reaction introduces M + 0 DHAP, 0% M + 0 DHAP measurement implies no backward TPI flux (ΔGTPI ≪ 0), while ~50% suggests a highly reversible reaction (ΔGTPI ≈ 0). c, In E. coli, [1,2-13C2]glucose generated 40% unlabeled DHAP (DHAPU). The center and error bars represent the mean ± s.e.m. (n = 3, biologically independent samples). d, The ΔG of a reaction can be expressed as a function of the measured unlabeled fractions of primary substrate and product as well as GAPU and ΔGTPI. GAPU was obtained from FBP aldolase reversibility and FBPU. Using the 2H–13C labeling information and flux modeling, we determined the reversibility and ΔG of glycolytic reactions.
Fig. 3 |
Fig. 3 |. Nitrogen upshift drives glycolysis forward.
a, Isotope tracing of glycolytic reversibility in E. coli during nitrogen limitation and immediately following nitrogen upshift. E. coli were cultured on [5-2H1]- or [1,2-13C2]glucose with arginine as the sole nitrogen source, which supports slow cell growth (that is, nitrogen limitation). Glycolytic intermediates retained significantly less deuterium than in the NH4Cl fast growth condition, indicating greater glycolytic reversibility. With [1,2-13C2]glucose, DHAP was ~50% unlabeled, indicating high TPI reversibility. Five minutes after spiking in NH4Cl (that is, nitrogen upshift), most glycolytic intermediates gained substantial deuterium labeling, while the DHAP labeling did not change. The center and error bars represent the mean ± s.e.m. (n = 3 or 4, biologically independent samples). b, Corresponding ΔG were inferred from the forward and backward fluxes that best simulated the observed 2H and 13C labeling. Each of the reaction(s) ΔG (<0) is represented by the height of the green bar. The bottom edges indicate the cumulative ΔG up to the corresponding step in glycolysis. Whiskers show s.e.m. (Methods). On nitrogen upshift, glycolysis shifted forward, with the most drastic free energy drops occurring near the beginning and the end of glycolysis. c, Schematic of glycolytic flux regulation during nitrogen upshift. Enzyme I is activated by the drop of αKG, accelerating G6P production and PEP consumption, with the middle of the pathway responding via decreased reversibility. *P < 0.05 and **P < 0.01 by two-tailed t-tests or bootstrapping (Methods).
Fig. 4 |
Fig. 4 |. Phosphorus upshift drives glycolysis forward.
a, Changes in relative levels of glycolytic intermediates 5 min after spiking in 1.32 mM phosphate to E. coli phosphate-limited cultures. Measurements are normalized by means of the individual metabolites in the phosphorus-limited condition. The center and error bars represent the mean ± s.e.m. (n = 3, biologically independent samples). b, E. coli cultured on [5-2H1]- or [1,2-13C2]glucose during phosphate limitation and 5 min after spiking in 1.32 mM phosphate. G6P, 3PG and 23BPG gained substantial deuterium labeling, while the unlabeled DHAP pool decreased. The center and error bars represent the mean ± s.e.m. (n = 3, biologically independent samples). c, Corresponding ΔG were inferred from the flux-modeling results that best fit the observed 2H and 13C labeling. Each of the reaction(s) ΔG (<0) is represented by the height of the green bar. The bottom edges indicate the cumulative ΔG up to the corresponding step in glycolysis. Whiskers show s.e.m.; *P < 0.05 and **P < 0.01 by two-tailed t-tests or bootstrapping (Methods).
Fig. 5 |
Fig. 5 |. Oligomycin enhances the forward driving force in glycolysis.
a, Mammalian iBMK cells cultured on [5-2H1]- or [1,2-13C2]glucose after addition of DMSO (untreated) or oligomycin for 30 min. On oligomycin treatment, the glycolytic intermediates retained more 2H and the unlabeled DHAP pool decreased, indicating less reversibility. The center and error bars represent the mean ± s.e.m. (n = 3, biologically independent samples). b, Corresponding ΔG were inferred from the flux-modeling results that best fit the observed 2H and 13C labeling. Each of the reaction(s) ΔG (<0) is represented by the height of the green bar. The bottom edges indicate the cumulative ΔG up to the corresponding step in glycolysis. Whiskers show s.e.m. (Methods). On oligomycin treatment, glycolysis shifted forward, towards a stronger thermodynamic force, especially at the aldolase and GAPD:PGK steps. *P < 0.05 and **P < 0.01 by two-tailed t-tests or bootstrapping (Methods).
Fig. 6 |
Fig. 6 |. Slow glycolysis of C. cellulolyticum operates near equilibrium using PPi-dependent PFK.
a, Relative levels of glycolytic intermediates in C. acetobutylicum versus C. cellulolyticum. Measurements are normalized by the means of the individual metabolites in C. acetobutylicum. The center and error bars represent the mean ± s.e.m. (n = 4 or 7, biologically independent samples). b, Isotope tracing of glycolytic reversibility in the obligate anaerobes C. cellulolyticum and C. acetobutylicum cultured on [5-2H1]- or [1,2-13C2]glucose. The center and error bars represent the mean ± s.e.m. (n = 3, biologically independent samples). c, All glycolytic reactions of C. cellulolyticum were close to equilibrium with ΔG > −1 kJ mol−1. The resulting cumulative ΔG from G6P to PEP was approximately −3 kJ mol−1, one-tenth of that of C. acetobutylicum. Each of the reaction(s) ΔG (<0) is represented by the height of the green bar. The bottom edges indicate the cumulative ΔG up to the corresponding step in glycolysis. Whiskers show s.e.m. (Methods). The most substantial differences between canonical (for example, E. coli, C. acetobutylicum and mammalian) and C. cellulolyticum glycolysis were in the ΔG of phosphofructokinase (PFK) and GAPD:PGK. d, In C. cellulolyticum cell lysate, fructose-1,6-bisphosphate (FBP) was produced in the presence of PPi but not ATP (10 min incubation). Control represents identical assays without cell lysate and the plotted results represent two replicate experiments. e, The weakly forward-driven PFK in C. cellulolyticum is due to the use of the PPi–Pi pair instead of the ATP–ADP pair. *P < 0.05 and **P < 0.01 by two-tailed t-tests or bootstrapping (Methods).

Similar articles

Cited by

References

    1. Tanner LB et al. Four key steps control glycolytic flux in mammalian cells. Cell Syst. 7, 49–62.e48 (2018). - PMC - PubMed
    1. Henry CS, Broadbelt LJ & Hatzimanikatis V Thermodynamics-based metabolic flux analysis. Biophys. J. 92, 1792–1805 (2007). - PMC - PubMed
    1. Fell D Understanding the Control of Metabolism (Portland Press, 1997).
    1. Hackett SR et al. Systems-level analysis of mechanisms regulating yeast metabolic flux. Science 354, aaf2786 (2016). - PMC - PubMed
    1. Flamholz A, Noor E, Bar-Even A, Liebermeister W & Milo R Glycolytic strategy as a tradeoff between energy yield and protein cost. Proc. Natl Acad. Sci. USA 110, 10039–10044 (2013). - PMC - PubMed

Publication types