Hyperbaric Oxygen Treatment Ameliorates Hearing Loss and Auditory Cortex Injury in Noise Exposed Mice by Repressing Local Ceramide Accumulation
- PMID: 31547176
- PMCID: PMC6801451
- DOI: 10.3390/ijms20194675
Hyperbaric Oxygen Treatment Ameliorates Hearing Loss and Auditory Cortex Injury in Noise Exposed Mice by Repressing Local Ceramide Accumulation
Abstract
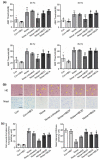
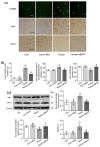
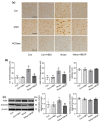
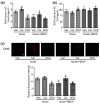
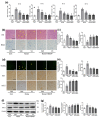
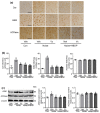
Noise-induced hearing loss (NIHL) relates closely to auditory cortex (AC) injury, so countermeasures aiming at the AC recovery would be of benefit. In this work, the effect of hyperbaric oxygen treatment on NIHL was elucidated, which was imposed on mice before (HBOP), during (HBOD) or after (HBOA) noise exposure. Morphology of neurons was assayed by hematoxylin-eosin or Nissl staining. Ceramide (Cer) level was measured through immunohistochemistry analysis. Apoptotic neurons were counted using transferase-mediated dUTP nick end labeling (TUNEL) staining. We demonstrated that the intense, broad band noise raised the threshold of auditory brainstem response, evoked neuronal degeneration or apoptosis and triggered the Cer accumulation in AC, all of which were restored significantly by HBOP, but not HBOD or HBOA. Cer over-generation reversed the advantages of HBOP significantly, while its curtailment recapitulated the effect. Next, noise exposure raised the superoxide or malondialdehyde (MDA) production which was blocked by HBOP or Cer repression. Oxidative control not only attenuated the hearing loss or neurodegeneration but, in turn, reduced the Cer formation significantly. In summary, mutual regulation between Cer and oxidative stress underlies the HBOP's curative effect on hearing loss and neuronal damage in noise-exposed mice.
Keywords: acid ceramidase; acid sphingomyelinase; ceramide; hearing loss; hyperbaric oxygen therapy; noise; oxidative stress.
Conflict of interest statement
The authors declare no conflicts of interest.
Figures

Similar articles
-
Doxepin Mitigates Noise-induced Neuronal Damage in Primary Auditory Cortex of Mice via Suppression of Acid Sphingomyelinase/Ceramide Pathway.Anat Rec (Hoboken). 2017 Dec;300(12):2220-2232. doi: 10.1002/ar.23677. Epub 2017 Aug 28. Anat Rec (Hoboken). 2017. PMID: 28806500
-
Hyperbaric oxygen treatment mitigates liver damage in mice with noise exposure.Clin Exp Pharmacol Physiol. 2020 Sep;47(9):1564-1574. doi: 10.1111/1440-1681.13330. Epub 2020 May 18. Clin Exp Pharmacol Physiol. 2020. PMID: 32347967
-
Olfactory epithelium neural stem cell implantation restores noise-induced hearing loss in rats.Neurosci Lett. 2016 Mar 11;616:19-25. doi: 10.1016/j.neulet.2016.01.016. Epub 2016 Jan 14. Neurosci Lett. 2016. PMID: 26777425
-
Reversible long-term changes in auditory processing in mature auditory cortex in the absence of hearing loss induced by passive, moderate-level sound exposure.Ear Hear. 2012 May-Jun;33(3):305-14. doi: 10.1097/AUD.0b013e318241e880. Ear Hear. 2012. PMID: 22343545 Review.
-
Reactive oxygen species, apoptosis, and mitochondrial dysfunction in hearing loss.Biomed Res Int. 2015;2015:617207. doi: 10.1155/2015/617207. Epub 2015 Mar 22. Biomed Res Int. 2015. PMID: 25874222 Free PMC article. Review.
Cited by
-
Effects of Broussonetia papyrifera (L.) L'Hér. ex Vent. fruits water extract on hippocampal neurogenesis in the treatment of APP/PS1 transgenic mice.Front Pharmacol. 2022 Oct 26;13:1056614. doi: 10.3389/fphar.2022.1056614. eCollection 2022. Front Pharmacol. 2022. PMID: 36386124 Free PMC article.
-
Ginsenoside Rd Ameliorates Auditory Cortex Injury Associated With Military Aviation Noise-Induced Hearing Loss by Activating SIRT1/PGC-1α Signaling Pathway.Front Physiol. 2020 Jul 21;11:788. doi: 10.3389/fphys.2020.00788. eCollection 2020. Front Physiol. 2020. PMID: 32792971 Free PMC article.
-
The Effect of Early Maternal Separation Combined With Adolescent Chronic Unpredictable Mild Stress on Behavior and Synaptic Plasticity in Adult Female Rats.Front Psychiatry. 2021 Mar 5;12:539299. doi: 10.3389/fpsyt.2021.539299. eCollection 2021. Front Psychiatry. 2021. PMID: 33746787 Free PMC article.
-
Plasma metabolomics analyses highlight the multifaceted effects of noise exposure and the diagnostic power of dysregulated metabolites for noise-induced hearing loss in steel workers.Front Mol Biosci. 2022 Aug 19;9:907832. doi: 10.3389/fmolb.2022.907832. eCollection 2022. Front Mol Biosci. 2022. PMID: 36060246 Free PMC article.
References
-
- Su Y.T., Meng X.X., Zhang X., Guo Y.B., Zhang H.J., Cheng Y.P., Xie X.P., Chang Y.M., Bao J.X. Doxepin Mitigates Noise-induced Neuronal Damage in Primary Auditory Cortex of Mice via Suppression of Acid Sphingomyelinase/Ceramide Pathway. Anat. Rec. 2017;300:2220–2232. doi: 10.1002/ar.23677. - DOI - PubMed
MeSH terms
Substances
Grants and funding
LinkOut - more resources
Full Text Sources
Medical

