Light-inducible activation of cell cycle progression in Xenopus egg extracts under microfluidic confinement
- PMID: 31544194
- PMCID: PMC7819639
- DOI: 10.1039/c9lc00569b
Light-inducible activation of cell cycle progression in Xenopus egg extracts under microfluidic confinement
Abstract
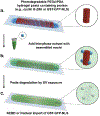
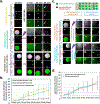
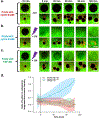
Cell-free Xenopus egg extract is a widely used and biochemically tractable model system that allows recapitulation and elucidation of fundamental cellular processes. Recently, the introduction of microfluidic extract manipulation has enabled compartmentalization of bulk extract and a newfound ability to study organelles on length scales that recapitulate key features of cellular morphology. While the microfluidic confinement of extracts has produced a compelling platform for the in vitro study of cell processes at physiologically-relevant length scales, it also imposes experimental limitations by restricting dynamic control over extract properties. Here, we introduce photodegradable polyethylene glycol (PEG) hydrogels as a vehicle to passively and selectively manipulate extract composition through the release of proteins encapsulated within the hydrogel matrix. Photopatterned PEG hydrogels, passive to both extract and encapsulated proteins, serve as protein depots within microfluidic channels, which are subsequently flooded with extract. Illumination by ultraviolet light (UV) degrades the hydrogel structures and releases encapsulated protein. We show that an engineered fluorescent protein with a nuclear localization signal (GST-GFP-NLS) retains its ability to localize within nearby nuclei following UV-induced release from hydrogel structures. When diffusion is considered, the kinetics of nuclear accumulation are similar to those in experiments utilizing conventional, bulk fluid handling. Similarly, the release of recombinant cyclin B Δ90, a mutant form of the master cell cycle regulator cyclin B which lacks the canonical destruction box, was able to induce the expected cell cycle transition from interphase to mitosis. This transition was confirmed by the observation of nuclear envelope breakdown (NEBD), a phenomenological hallmark of mitosis, and the induction of mitosis-specific biochemical markers. This approach to extract manipulation presents a versatile and customizable route to regulating the spatial and temporal dynamics of cellular events in microfluidically confined cell-free extracts.
Figures


Similar articles
-
Dynein-Based Accumulation of Membranes Regulates Nuclear Expansion in Xenopus laevis Egg Extracts.Dev Cell. 2015 Jun 8;33(5):562-75. doi: 10.1016/j.devcel.2015.04.016. Epub 2015 May 21. Dev Cell. 2015. PMID: 26004509
-
Microfluidic encapsulation of Xenopus laevis cell-free extracts using hydrogel photolithography.STAR Protoc. 2020 Dec 11;1(3):100221. doi: 10.1016/j.xpro.2020.100221. eCollection 2020 Dec 18. STAR Protoc. 2020. PMID: 33377113 Free PMC article.
-
Microfluidic Encapsulation of Demembranated Sperm Nuclei in Xenopus Egg Extracts.Cold Spring Harb Protoc. 2018 Aug 1;2018(8). doi: 10.1101/pdb.prot102913. Cold Spring Harb Protoc. 2018. PMID: 29437999
-
Probing the biology of cell boundary conditions through confinement of Xenopus cell-free cytoplasmic extracts.Genesis. 2017 Jan;55(1-2):10.1002/dvg.23013. doi: 10.1002/dvg.23013. Genesis. 2017. PMID: 28132422 Free PMC article. Review.
-
Use of Xenopus cell-free extracts to study size regulation of subcellular structures.Int J Dev Biol. 2016;60(7-8-9):277-288. doi: 10.1387/ijdb.160158dl. Int J Dev Biol. 2016. PMID: 27759156 Free PMC article. Review.
Cited by
-
Microtubule-dependent pushing forces contribute to long-distance aster movement and centration in Xenopus laevis egg extracts.Mol Biol Cell. 2020 Dec 1;31(25):2791-2802. doi: 10.1091/mbc.E20-01-0088. Epub 2020 Oct 7. Mol Biol Cell. 2020. PMID: 33026931 Free PMC article.
-
Cell Biology: Social Distancing of Microtubule Ends Increases Their Assembly Rates.Curr Biol. 2020 Aug 3;30(15):R888-R890. doi: 10.1016/j.cub.2020.06.014. Curr Biol. 2020. PMID: 32750351 Free PMC article.
-
Fabrication of Functional Biomaterial Microstructures by in Situ Photopolymerization and Photodegradation.ACS Biomater Sci Eng. 2018 Aug 13;4(8):3078-3087. doi: 10.1021/acsbiomaterials.8b00350. Epub 2018 Jul 5. ACS Biomater Sci Eng. 2018. PMID: 31984222 Free PMC article.
References
-
- Murray AW and Kirschner MW, Nature, 1989, 339, 275–280. - PubMed
-
- Murray AW, Methods Cell Biol, 1991, 36, 581–605. - PubMed
-
- Heald R, Tournebize R, Blank T, Sandaltzopoulos R, Becker P, Hyman A and Karsenti E, Nature, 1996, 382, 420–425. - PubMed
-
- Desai A, Murray AW, Mitchison T and Walczak CE, in Methods in Cell Biology, Academic Press, 1999, vol. 61, pp. 385–412. - PubMed
Publication types
MeSH terms
Substances
Grants and funding
LinkOut - more resources
Full Text Sources
Research Materials

