. 2019 Sep 19;10(1):4271.
doi: 10.1038/s41467-019-12221-6.

Endosomal PI(3)P regulation by the COMMD/CCDC22/CCDC93 (CCC) complex controls membrane protein recycling

Affiliations

Endosomal PI(3)P regulation by the COMMD/CCDC22/CCDC93 (CCC) complex controls membrane protein recycling

Amika Singla et al. Nat Commun. .

Abstract

Protein recycling through the endolysosomal system relies on molecular assemblies that interact with cargo proteins, membranes, and effector molecules. Among them, the COMMD/CCDC22/CCDC93 (CCC) complex plays a critical role in recycling events. While CCC is closely associated with retriever, a cargo recognition complex, its mechanism of action remains unexplained. Herein we show that CCC and retriever are closely linked through sharing a common subunit (VPS35L), yet the integrity of CCC, but not retriever, is required to maintain normal endosomal levels of phosphatidylinositol-3-phosphate (PI(3)P). CCC complex depletion leads to elevated PI(3)P levels, enhanced recruitment and activation of WASH (an actin nucleation promoting factor), excess endosomal F-actin and trapping of internalized receptors. Mechanistically, we find that CCC regulates the phosphorylation and endosomal recruitment of the PI(3)P phosphatase MTMR2. Taken together, we show that the regulation of PI(3)P levels by the CCC complex is critical to protein recycling in the endosomal compartment.


Conflict of interest statement

The authors declare no competing interests.

Figures
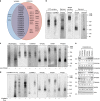
Fig. 1
Fig. 1
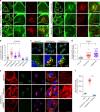
CCC and retriever are closely associated but distinct complexes. a Venn diagram depicting proteins identified by LC/MS-MS as interacting partners of VPS26C or CCDC93 in HeLa cells. All proteins presented were within 10-fold in abundance compared with the bait proteins. CRIPSR/Cas9 was used to make KO lines, which were then stably transduced with an empty vector (EV) or HA-tagged versions of VPS26C or CCDC93. bd Cell lysates from parental HeLa cells b, VPS26C deleted or rescued cells c, and COMMD3 deleted or rescued cells d were resolved using coomassie blue native (BN) gel electrophoresis. This was followed by membrane transfer and immunoblotting using the indicated antibodies. e Expression of CCC and retriever complex subunits was examined by immunoblotting in the indicated HeLa CRISPR/Cas9 knockout cell lines; quantification after normalization by the loading control (Actin), is also presented as % compared with the parental control (representative of at least three separate iterations)
Fig. 2
Fig. 2
CCC links retriever to endosomes but its loss affects retriever-independent cargoes. a Confocal images from VPS35L, EEA1, and VPS35 immunofluorescence staining depicting the subcellular localization of the retriever subunit VPS35L in the indicated cell lines. Representative images of two independent experiments are shown. Scale bars, 10 μm, for zoomed images 5 μm. b Immunoprecipitation of the retriever subunit VPS35L was followed by immunoblotting for WASH. Lysates from COMMD3 KO cells and an isogenic rescue line were used (representative of two independent iterations). c Pearson correlation coefficients for GLUT1 and EEA1. Results for individual cells are plotted, along with the mean and s.e.m. for each group (n = 76 cells for WT, 76 for COMMD3 KO, 38 for CCDC93 KO, 72 for VPS35L KO, 59 for VPS26C KO, and 50 for FAM45A KO); ***P < 0.0001 (one-way ANOVA and Dunnett’s test to control). d Confocal microscopy imaging of EEA1 and GLUT1 immunofluorescence staining quantified in c. Representative images from three independent experiments are shown. Scale bars, 10 μm
Fig. 3
Fig. 3
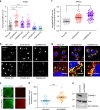
CCC depletion leads to WASH-dependent increase in endosomal F-actin. a Confocal imaging for F-actin and WASH immunofluorescence staining of HeLa WT and the indicated CRISPR/Cas9 knockout cell lines. Representative images of three independent experiments are shown. Scale bars 20 μm, for zoomed images 10 μm. b Quantification of normalized mean fluorescent intensity (MFI) of F-actin on WASH-positive vesicles from a. Results for individual cells are plotted, along with the mean and s.e.m. for each group (n = 62 cells for WT, 45 for CCDC93 KO, 48 for COMMD3 KO, 50 for VPS35L KO, 43 for VPS26C KO, 48 for FAM45A KO); ***P < 0.0001 (one-way ANOVA and Dunnett’s test to control). c Confocal imaging for cortactin and FAM21 immunofluorescence staining in the indicated cell lines. Representative images of two independent experiments are shown. Scale bars 20 μm, for zoomed images 5 μm. d Quantification of cortactin immunofluorescence on FAM21-positive vesicles from c. Results for individual cells are plotted, along with the mean and s.e.m. for each group (n = 51 for WT cells, 63 for CCDC93 KO, 56 for COMMD3 KO); ***P < 0.0001 (one-way ANOVA and Dunnett’s test to control). e Confocal imaging of F-actin, EEA1, and WASH immunofluorescence staining for the indicated cell lines. Representative images of two independent experiments are shown. Scale bars, 10 μm and 5 μm on zoomed images. f Quantitation of endosomal F-actin deposition on EEA1-positive endosomes in the indicated cell lines (n = 35 cells for HeLa WT, 36 for CCDC93 KO shcontrol, 37 for CCDC93 shWASH). The mean MFI and the s.e.m. for each group are plotted; ***P < 0.0001 (unpaired two-tailed t test to CCDC93 KO shcontrol)
Fig. 4
Fig. 4
WASH endosomal recruitment and activity are increased in CCC-deficient cells. a Normalized mean fluorescence intensity (MFI) of WASH was quantified in the indicated cell lines. Results for individual cells are plotted, along with the mean and s.e.m. for each group (n = 62 cells for HeLa WT, 45 for CCDC93 KO, 48 for COMMD3 KO, 50 for VPS35L KO, 43 for VPS26C KO, 48 for FAM45A KO); ***P < 0.0001; *P < 0.05 (one-way ANOVA and Dunnett’s test to control). b Confocal imaging of WASH immunofluorescence staining in the indicated cell lines, corresponding to a. Representative images are shown from two independent experiments. Scale bars, 10 μm. c WASH complex activity was determined by pyrene-actin assembly assays in the indicated cell lines (Wash knockout fibroblasts reconstituted with HA-GFP-WASH, that were further transduced with shControl or shCommd1 lentiviruses). WASH recovery and F-actin deposition on protein G beads was determined by fluorescence microscopy (examples shown on the left panels). d Quantification of F-actin fluorescence, normalized to WASH recovery is shown (middle panel), with mean values and s.e.m. plotted (n = 35 cells); ***P < 0.0001 (unpaired two-tailed t test to control). e Immunoblot analysis of the two cell lines is also shown (right panel), including Commd1, WASH (GFP), and actin (as a loading control). Results are representative of three independent iterations. f Quantification of ARPC2 immunofluorescence on VPS35-positive endosomes. Results for individual cells are plotted, along with the mean and s.e.m. for each group (n = 60 cells for WT, 84 for CCDC93 KO, 77 for COMMD3 KO); ***P < 0.0001 (one-way ANOVA and Dunnett’s test to control). g Confocal imaging of ARPC2 and VPS35 immunofluorescence staining in the indicated cell lines, corresponding to f. Representative images of two independent experiments are shown. Scale bars, 10 μm on non-zoomed and 5 μm on zoomed images
Fig. 5
Fig. 5
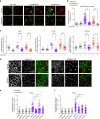
PI(3)P levels are increased in CCC-deficient cells. a Confocal microscopy imaging from EEA1 and WASH immunofluorescence staining in the indicated cell lines, corresponding to b and c. Representative images of two independent experiments are shown. Scale bars, 10 μm on non-zoomed and 5 μm on zoomed images. For complete staining see Supplementary Fig. 4. b Quantification of the normalized mean fluorescence intensity of EEA1 in the indicated cells lines. Results for individual cells are plotted, along with the mean and s.e.m. for each group (n = 42 cells for WT, 69 for CCDC93 KO, 86 for COMMD3 KO, 62 for VPS26C KO); ***P < 0.0001 (one-way ANOVA and Dunnett’s test to WT control). c In the same cells used for b, WASH mean fluorescence intensity in the region occupied by EEA1-positive endosomes was quantified; ***P < 0.0001; ns, not significant (one-way ANOVA and Dunnett’s test to control). d Confocal microscopy imaging from cells transfected with a dsRed-EEA1-FYVE domain PI(3)P reporter plasmid (pseudocolored in green) and co-stained for WASH. Scale bars, 10 μm on non-zoomed and 5 μm on zoomed images. e Quantification of the normalized mean fluorescence intensity of the PI(3)P reporter (FYVE). Results for individual cells are plotted, along with the mean and s.e.m. for each group (n = 35 cells for WT, 43 for COMMD3 KO, 40 for CCDC93 KO, 36 for VPS26C KO); ***P < 0.0001; ns, not significant (one-way ANOVA and Dunnett’s test to control). f PI(3)P levels determined by HPLC in HeLa WT and COMMD3 KO cells. Mean and s.e.m. of four biological replicates per group are plotted. Representative data of two independent experiments are shown; ***P < 0.0001 (unpaired two-tailed t test to control)
Fig. 6
Fig. 6
VPS34 inhibition restores trafficking in CCC-deficient cells. a Confocal images of cells transfected with a PI(3)P reporter (FYVE) and co-stained for FAM21 (left panels). Cells were treated with vehicle (DMSO) or a VPS34 kinase inhibitor (VPS34-IN1). Scale bars, 10 μm. b Normalized FYVE fluorescence intensity was quantified. Results for individual cells are plotted, along with the mean and s.e.m. for each group (number of cells: WT = 94, WT VPS34-IN1 = 58, COMMD3 KO = 92, COMMD3 KO VPS34-IN1 = 77, CCDC93 KO = 99, CCDC93 KO VPS34-IN1 = 81); ***P < 0.0001 (unpaired two-tailed t test). c HeLa WT and two CCC KO cells (COMMD3 and CCDC93 KO) were treated with the VPS34 inhibitor or vehicle control. Quantification of normalized EEA1 mean fluorescence intensity (MFI) per cell (left panel), as well as WASH and phalloidin MFI on EEA1-positive areas (middle and right panels) are shown. Results for individual cells are plotted, along with the mean and s.e.m. for each group (number of cells: WT = 26, WT VPS34-IN1 = 34, COMMD3 KO = 12, COMMD3 KO VPS34-IN1 = 32, CCDC93 KO = 40, CCDC93 KO VPS34-IN1 = 50); ***P < 0.0001 (unpaired two-tailed t test against DMSO negative control). d Confocal microscopy imaging of ITGα5 and WASH immunofluorescence staining after an ITGα5 recycling experiment. VPS34 silencing (siVPS34) in the indicated cell lines is shown. Representative of 2 independent experiments. Scale bars, 10 μm. e, f Cells were transfected with control or three independent VPS34 siRNAs and normalized mean fluorescence intensity of WASH per cell d or ITGα5 on WASH-positive endosomes e was quantified. Results for individual cells are plotted, along with the mean and s.e.m. for each group (number of cells: HeLa control siRNA (csiRNA) = 130, HeLa siVPS34 1 = 113, HeLa siVPS34 2 = 82, HeLa siVPS34 3 = 142, COMMD3 KO csiRNA = 90, COMMD3 KO siVPS34 1 = 120, COMMD3 KO siVPS34 2 = 85, COMMD3 KO siVPS34 3 = 130); ***P < 0.0001; **P < 0.001 (one-way ANOVA and Dunnett’s test to control siRNA)
Fig. 7
Fig. 7
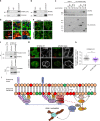
CCC complex regulates MTMR2 phosphorylation. a Immunoprecipitation of CCDC22 from HEK293T cells transfected with pEBB-2xHA-MTMR2. Precipitates were immunoblotted for MTMR2 (HA) and CCDC22. Representative of three independent iterations. b Immunoprecipitation of endogenous CCDC22 from HEK293T cell lysates followed by immunoblotting for CCDC22 and MTMR2. Representative of three different iterations. c The indicated HA-tagged CCDC22 constructs were transfected in HEK293T cells followed by immunoprecipitation with HA antibody. The recovered material was immunoblotted for endogenous MTMR2 and COMMD1, as well as CCDC22 (HA). Representative of two different iterations. d Confocal imaging of F-actin (phalloidin) and FAM21 immunofluorescence staining in HeLa cells transfected with two independent MTMR2 siRNAs or a control oligonucleotide. Data are representative of three independent experiments. Scale bars, 10 μm, 5 μm on zoomed images. e Confocal microscopy imaging of ITGβ1 and WASH immunofluorescence staining after an ITGβ1 recycling experiment. Cells were transfected with control or MTMR2 targeting siRNA and treated with VPS34 kinase inhibitor (VPS34-IN1) or vehicle control (DMSO) as indicated. Representative of two independent experiments. Scale bars, 10 μm. f Immunoprecipitation of endogenous MTMR2 from cell lysates obtained from HEK293T shControl and shCOMMD1, followed by immunoblotting for phosphoserine, MTMR2 and COMMD1. The experiment is representative of three independent iterations. g Confocal imaging for MTMR2 (HA), FAM21, and phalloidin immunofluorescence staining from HeLa WT and COMMD3 KO cells transiently transfected with pEBB-2xHA-MTMR2 and pEBB-2xHA-MTMR2 S58A. Representative images from two separate iterations are shown. Scale bar, 10 μm. h Quantification of normalized mean fluorescent intensity (MFI) of F-actin on FAM21-positive vesicles in COMMD3 KO. Results for individual cells are plotted, along with the mean and s.e.m. for each group (n = 69 for COMMD3 KO 2HA-MTMR2 WT, n = 40 for 2xHA-MTMR2 S58A); ***P < 0.0001 (unpaired two-tailed t test). i Model depicting how the CCC complex regulates retriever recruitment as well as WASH-dependent actin nucleation on endosomes by regulating PI(3)P levels through MTMR2 phosphorylation/recruitment. Please refer to the Discussion section for additional details

Similar articles

Cited by

References

    1. Huotari J, Helenius A. Endosome maturation. EMBO J. 2011;30:3481–3500. doi: 10.1038/emboj.2011.286. - DOI - PMC - PubMed
    1. Volinia S, et al. A human phosphatidylinositol 3-kinase complex related to the yeast Vps34p-Vps15p protein sorting system. EMBO J. 1995;14:3339–3348. doi: 10.1002/j.1460-2075.1995.tb07340.x. - DOI - PMC - PubMed
    1. Christoforidis S, et al. Phosphatidylinositol-3-OH kinases are Rab5 effectors. Nat. Cell Biol. 1999;1:249–252. doi: 10.1038/12075. - DOI - PubMed
    1. Murray JT, Panaretou C, Stenmark H, Miaczynska M, Backer JM. Role of Rab5 in the recruitment of hVps34/p150 to the early endosome. Traffic. 2002;3:416–427. doi: 10.1034/j.1600-0854.2002.30605.x. - DOI - PubMed
    1. Teasdale RD, Collins BM. Insights into the PX (phox-homology) domain and SNX (sorting nexin) protein families: structures, functions and roles in disease. Biochem. J. 2012;441:39–59. doi: 10.1042/BJ20111226. - DOI - PubMed

Publication types

MeSH terms