. 2019 Nov 14;134(20):1717-1729.
doi: 10.1182/blood.2019000973.

B-cell-specific IRF4 deletion accelerates chronic lymphocytic leukemia development by enhanced tumor immune evasion

Affiliations

B-cell-specific IRF4 deletion accelerates chronic lymphocytic leukemia development by enhanced tumor immune evasion

Daniela Asslaber et al. Blood. .

Abstract

Chronic lymphocytic leukemia (CLL) is a heterogenous disease that is highly dependent on a cross talk of CLL cells with the microenvironment, in particular with T cells. T cells derived from CLL patients or murine CLL models are skewed to an antigen-experienced T-cell subset, indicating a certain degree of antitumor recognition, but they are also exhausted, preventing an effective antitumor immune response. Here we describe a novel mechanism of CLL tumor immune evasion that is independent of T-cell exhaustion, using B-cell-specific deletion of the transcription factor IRF4 (interferon regulatory factor 4) in Tcl-1 transgenic mice developing a murine CLL highly similar to the human disease. We show enhanced CLL disease progression in IRF4-deficient Tcl-1 tg mice, associated with a severe downregulation of genes involved in T-cell activation, including genes involved in antigen processing/presentation and T-cell costimulation, which massively reduced T-cell subset skewing and exhaustion. We found a strong analogy in the human disease, with inferior prognosis of CLL patients with low IRF4 expression in independent CLL patient cohorts, failed T-cell skewing to antigen-experienced subsets, decreased costimulation capacity, and downregulation of genes involved in T-cell activation. These results have therapeutic relevance because our findings on molecular mechanisms of immune privilege may be responsible for the failure of immune-therapeutic strategies in CLL and may lead to improved targeting in the future.


Conflict of interest statement

Conflict-of-interest disclosure: The authors declare no competing financial interests.

Figures

None
Graphical abstract
Figure 1.
Figure 1.
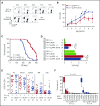
CLL development in Tcl-1 tg mice with and without IRF4 expression. (A) CD19+ CD5+ CLL cells were measured in the peripheral blood using flow cytometry and (B) analyzed over time. N = 6 (Tcl-1 tg IRF4+/+, red), N = 8 (Tcl-1 tg IRF4 ΔB/ΔB, blue). Arrows indicate mice euthanized because of overt CLL development. (C) Kaplan-Maier analysis showing overall survival of Tcl-1 tg IRF4+/+ mice (N = 36) and Tcl-1 tg IRF4 ΔB/ΔB mice (N = 28). The study end point of this analysis was 400 ± 20 days. (D) Spleen size and weight were analyzed in healthy age-matched littermates of the indicated genotypes (green) and leukemic Tcl-1 tg mice with WT IRF4 expression (red) or without IRF4 expression (blue). Analyzed mouse numbers are depicted on the y-axis. (E) CD19+ CD5+ CLL cells were measured in lymphoid organs derived from leukemic Tcl-1 tg mice with WT IRF4 expression (red) or without IRF4 expression (blue). (F) CLL clone sizes as measured by BCR sequencing. LNp, peripheral lymph nodes; major, major clone in % of total CLL cells; minor, minor clones in % of CLL cells; PC, peritoneal cavity; WT, wild-type.
Figure 2.
Figure 2.
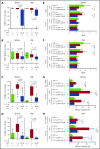
RNA-Seq and real-time PCR validation in Tcl-1 tg IRF4 WT and deficient CLL cells. (A) Number of significantly downregulated (negative y-axis, green bars) and upregulated genes (positive y-axis, red bars) corresponding to enriched GO terms (x-axis) in Tcl-1 tg IRF4 ΔB/ΔB (N = 3) as compared with Tcl-1 tg IRF4+/+ mice (N = 4). GO term descriptions and P values are indicated in the table. (B) Heatmap of differentially regulated genes within the GO term 0042110 T-cell activation. The counts per million were used for heatmap generation; unsupervised clustering (Euclidean) was used. (C) Validation of RNA-Seq data by real-time PCR in purified CLL cells derived from the spleen of Tcl-1 tg IRF4+/+ (red) and Tcl-1 tg IRF4 ΔB/ΔB (blue) mice. PCR was performed with TaqMan primers for the MHC1 genes H2-K1 and D1, (D) the MHC2 genes H2-Dmb and H2-Aa, (E) the MHC2 transactivator CIITA, and (F) the costimulatory molecules CD80 and CD86. Real-time PCR data were normalized to 18S and the mRNA relative expression ratio calculated according to the delta CT method.
Figure 3.
Figure 3.
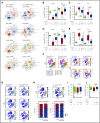
Surface marker expression in Tcl-1 tg IRF4+/+ and Tcl-1 tg IRF4 ΔB/ΔB mice. (A) MHC1, (B) MHC2, (C) CD80, and (D) CD86 surface expression was measured by flow cytometry in healthy C57/BL6 WT littermates (green), Tcl-1 tg IRF4+/+ (red), and Tcl-1 tg IRF4 ΔB/ΔB (blue) CD19+ B cells or CD19+ CD5+ CLL cells derived from either the spleen or the LNp. All measurements were performed with a proper isotype control to define negative cell populations or to calculate the MFIR. (E) The surface expression of CTLA4 and CD28 was measured in CD8 or CD4+ T cells using flow cytometry in cells derived from the spleen or (F) the lymph nodes. MFIR were calculated using an isotype control. Analyzed mouse numbers are depicted on the y-axis. (G) Flow cytometry of PD-L1 MFIR in CLL cells and percent PD-1+ cells in either CD4+ or CD8+ T cells. Genotypes and mouse numbers are depicted on the y-axis. All measurements were isotype controlled and were performed in cells derived from either the spleen or (H) the lymph nodes. MFIR, mean fluorescence intensity ratio.
Figure 4.
Figure 4.
Naïve and antigen-experienced T-cell subsets in Tcl-1 tg IRF4-proficient and IRF4-deficient mice and in vitro cocultures. (A) SPADE (spanning-tree progression of density normalized events) analysis from single-cell mass cytometry data (Helios, CyTOF) showing the splenic T-cell compartment of leukemic Tcl-1 tg IRF4+/+ or Tcl-1 tg ΔB/ΔB mice. The color code represents staining intensities ranging from blue (no expression) to red (high expression). (B) Naïve and (C) antigen-experienced CD4+ T cells derived from the spleen or the lymph nodes of Tcl-1 tg IRF4+/+ or Tcl-1 tg ΔB/ΔB leukemic mice measured by flow cytometry. (D) Naïve and (E) antigen-experienced CD8+ T cells derived from the spleen or the lymph nodes of Tcl-1 tg IRF4+/+ or Tcl-1 tg ΔB/ΔB leukemic mice measured by flow cytometry. (F) Single-cell mass cytometry data showing the splenic T-cell compartment of leukemic Tcl-1 tg IRF4+/+ and Tcl-1 tg ΔB/ΔB mice. Color-coded viSNE overlay plots assign T-cell subsets to the TSNE1/TSNE2 coordinate system (left). viSNE intensity plots (blue = no expression to red = high expression) of CD4 and CD8 are shown on the right. (G) Expression of CD223 (Lag-3), CD224, CD160, and (H) PD-1 in the splenic T-cell compartment of leukemic Tcl-1 tg IRF4+/+ and Tcl-1 tg ΔB/ΔB mice. All viSNE plots are derived from the same experiment and show concatenated information of 3 mice per genotype. Data were validated using classical flow cytometry and results are shown as a stacking plot. PD-1+ cells are depicted in red, PD-1 cells in blue in naïve, TCM, and TEM CD4+ or CD8+ T cells. (I) Naïve CD4+ and (J) CD8+ T cells derived from healthy C57/BL6 IRF4+/+ mice measured 72 hours after coculture with Tcl-1 tg IRF4+/+ (red) or Tcl-1 tg IRF4 ΔB/ΔB (blue) tumors derived from the spleen of leukemic mice. Green box plots show control CD4+ or CD8+ T cells cultured in absence of tumor cells. TEM/TCM represents the total amount of both TEM and TCM cells. 145Nd, 168Er, 162Dy, 164Dy, 170Er, 174Yb, 165Ho, and 159Tb refer to rare metal conjugates of antibodies used in single-cell mass cytometry.
Figure 5.
Figure 5.
In vitro activation of healthy T cells and adoptive transfer. (A) CD4+ and (B) CD8+ T cells derived from healthy C57/BL6 IRF4+/+ mice were activated with CD3/CD28 beads and coincubated with CLL tumor cells derived from the spleen of either Tcl-1 tg IRF4+/+ or Tcl-1 tg ΔB/ΔB leukemic mice for 24 hours. The activation status of T cells was measured using CD25 and CD69 antibodies by flow cytometry. (C) IFN-γ secretion was measured 72 hours after CD3/CD28 bead activation in cell culture supernatants using enzyme-linked immunosorbent assay and (D) intracellular flow cytometry. (E) CLL tumor cells derived from the spleen of either Tcl-1 tg IRF4+/+ (red) or Tcl-1 tg ΔB/ΔB (blue) leukemic mice were transplanted into C57/BL6 WT (solid lines) or NOD-SCID recipients (dashed lines) using intraperitoneal injection. Overall survival of recipient mice is shown as Kaplan-Maier analysis. (F) Naïve and (G) antigen-experienced CD4+ and CD8+ T cells derived from the spleen of Tcl-1 tg IRF4+/+ or Tcl-1 tg ΔB/ΔB tumors transplanted in C57/BL6 recipients.
Figure 6.
Figure 6.
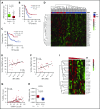
Relation of IRF4 expression to disease progression and the immune phenotype in human CLL patients. (A) Primary CLL cells derived from the blood of 98 chemonaive CLL patients and B cells derived from the blood of 9 healthy donors were purified and mRNA measured by real-time PCR. The mRNA expression ratio normalized to 18S and the mean expression in healthy donors is shown. (B) Kaplan-Maier analysis showing TTFT intervals for the IRF4low and IRF4high CLL patient group. The cutoff to discriminate between IRF4 groups was calculated by ROC analysis and Youden index calculation. (C) GSE39671 data were used for Kaplan-Maier analysis showing TTFT intervals in the IRF4low and IRF4high group. Group cutoffs were calculated using ROC analysis and Youden index calculation. (D) GSE39671 gene expression data were analyzed for differentially expressed genes (P < .05) in IRF4low and IRF4high CLL patients. Differentially expressed genes were filtered using the murine gene list GO: 0042210 and are depicted as heatmap using unsupervised clustering. (E) The percentage of CD4+ and (F) CD8+ naïve T cells and (G) CD86+ CLL cells was analyzed by flow cytometry and correlated to IRF4 expression measured by real-time PCR. (H) CIITA was measured by real-time PCR in IRF4low and IRF4high CLL patients. CIITA expression ratios are depicted as delta CT ratio, normalized to 18S. (I) Heatmaps of HLA genes extracted from Affymetrix Gene chip data derived from the public dataset GSE21029 are shown for BM samples of CLL patients. IRF4 expression is shown on the x-axis using a declining expression gradient.

Similar articles

Cited by

References

    1. Siegel RL, Miller KD, Jemal A. Cancer statistics, 2019. CA Cancer J Clin. 2019;69(1):7-34. - PubMed
    1. Sant M, Allemani C, Tereanu C, et al. ; HAEMACARE Working Group . Incidence of hematologic malignancies in Europe by morphologic subtype: results of the HAEMACARE project. Blood. 2010;116(19):3724-3734. - PubMed
    1. Kröber A, Seiler T, Benner A, et al. . V(H) mutation status, CD38 expression level, genomic aberrations, and survival in chronic lymphocytic leukemia. Blood. 2002;100(4):1410-1416. - PubMed
    1. Zenz T, Mertens D, Küppers R, Döhner H, Stilgenbauer S. From pathogenesis to treatment of chronic lymphocytic leukaemia. Nat Rev Cancer. 2010;10(1):37-50. - PubMed
    1. Pleyer L, Egle A, Hartmann TN, Greil R. Molecular and cellular mechanisms of CLL: novel therapeutic approaches. Nat Rev Clin Oncol. 2009;6(7):405-418. - PubMed

Publication types

Substances