. 2019 Sep;573(7775):605-608.
doi: 10.1038/s41586-019-1561-0. Epub 2019 Sep 18.

eIF5B gates the transition from translation initiation to elongation

Affiliations

eIF5B gates the transition from translation initiation to elongation

Jinfan Wang et al. Nature. 2019 Sep.

Abstract

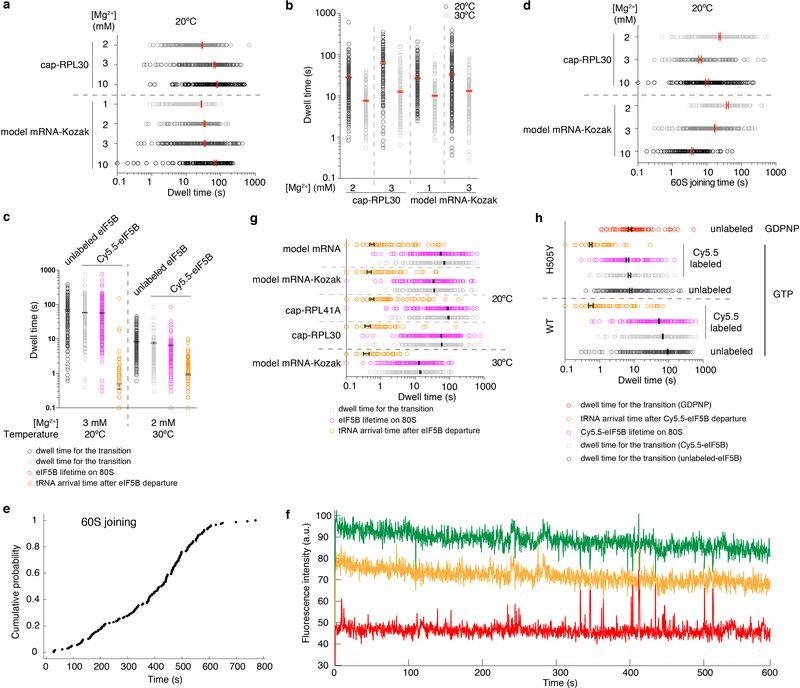
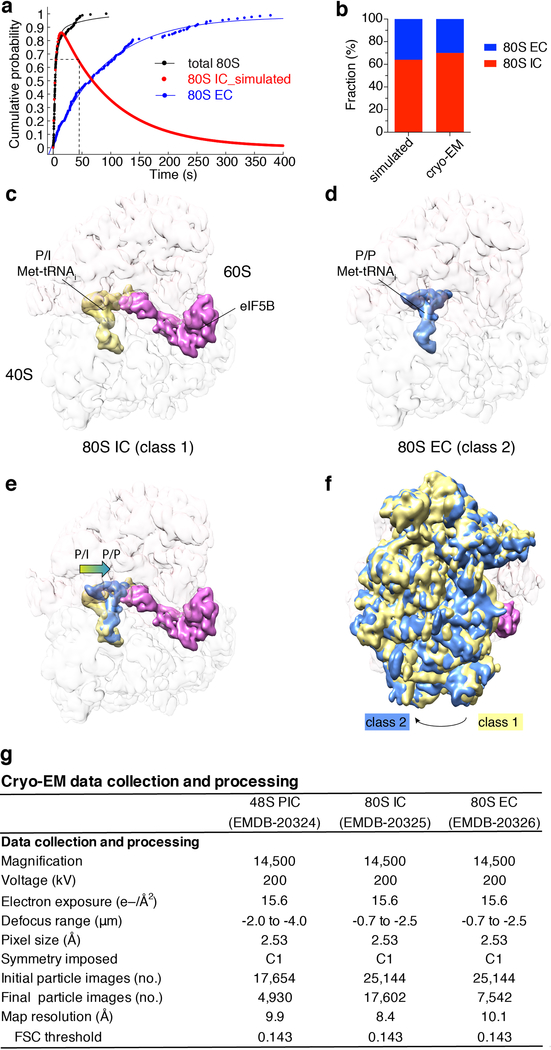
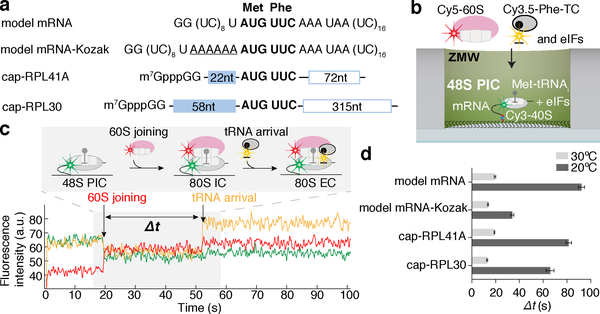
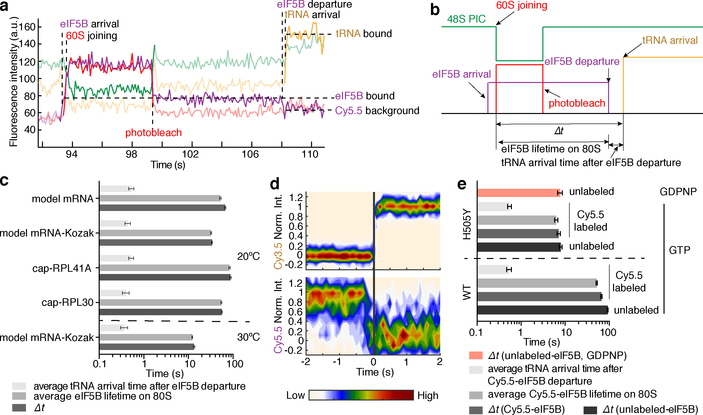
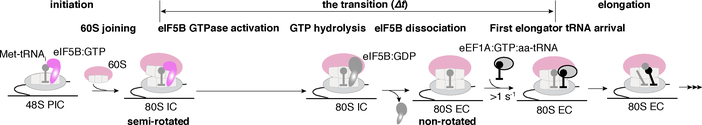
Translation initiation determines both the quantity and identity of the protein that is encoded in an mRNA by establishing the reading frame for protein synthesis. In eukaryotic cells, numerous translation initiation factors prepare ribosomes for polypeptide synthesis; however, the underlying dynamics of this process remain unclear1,2. A central question is how eukaryotic ribosomes transition from translation initiation to elongation. Here we use in vitro single-molecule fluorescence microscopy approaches in a purified yeast Saccharomyces cerevisiae translation system to monitor directly, in real time, the pathways of late translation initiation and the transition to elongation. This transition was slower in our eukaryotic system than that reported for Escherichia coli3-5. The slow entry to elongation was defined by a long residence time of eukaryotic initiation factor 5B (eIF5B) on the 80S ribosome after the joining of individual ribosomal subunits-a process that is catalysed by this universally conserved initiation factor. Inhibition of the GTPase activity of eIF5B after the joining of ribosomal subunits prevented the dissociation of eIF5B from the 80S complex, thereby preventing elongation. Our findings illustrate how the dissociation of eIF5B serves as a kinetic checkpoint for the transition from initiation to elongation, and how its release may be governed by a change in the conformation of the ribosome complex that triggers GTP hydrolysis.


Conflict of interest statement

The authors declare no competing interests. Readers are welcome to comment on the online version of the paper.

Figures

Extended Data Fig. 1 |
Extended Data Fig. 1 |. A reconstituted yeast translation system with fluorescently labeled ribosomes for inter-subunit smFRET.
a, We previously have established the Cy5 labeling of yeast 60S ribosomal subunit via a SNAP tag fused to the uL18 protein and the reaction with a SNAP-647 dye. b, In this work, we engineered a yeast strain in which all the 40S subunits carried the N-terminal ybbR-tagged uS19 protein. Upon purification, the 40S was labeled by SFP synthase with CoA-547 at the serine residue (in bold and underlined) of the ybbR tag, resulting in the Cy3–40S. c, The estimated distance between the two ribosomal labeling sites is within 50Å from published yeast 80S 3D structures (g). The ribosome model was created in PyMOL with PDB 4V8Z. d, TIRFM experimental setup to characterize the inter-subunit FRET signal. 80S complexes were assembled from Cy3–40S and Cy5–60S on the model mRNA (Fig. 1a) in the presence of required factors (Method) and were immobilized on a quartz slide used for TIRFM imaging with green laser illumination. e and f, Sample TIRFM experimental trace (e) and the inter-subunit smFRET efficiency histogram (f, fit with a single-Gaussian distribution, with a mean FRET efficiency at 0.89 ± 0.15 s.e.m.), n = 107 molecules. g, Estimated distances between the two labeling sites on the ribosomal subunits from a few examples of the published yeast 80S structures in different functional states, and the expected FRET efficiencies based on a Förster radius (R0) of 54 Å for the Cy3/Cy5 FRET pair. h, A representative SDS-PAGE analysis of the purified core eIFs (blue numbering) and eEFs (red numbering) used for the reconstitution of the translation system. Each component was analyzed at least three times with similar results.
Extended Data Fig. 2 |
Extended Data Fig. 2 |. Native gel shift assays and cryo-EM analysis showing active translation initiation with our purified yeast translation system.
a, A representative gel showing initiation on the model mRNA. A merged view of Cy5 (red) and Cy3 (blue) scans of the same gel is shown. For gel source data, see Supplementary Figure 1. The model mRNA was labeled with Cy5 and 40S was labeled with Cy3. Addition of Cy3–40S, Met-tRNAi:eIF2:GTP (Met-TC), eIF1 and eIF1A to the model mRNA-Cy5 resulted in the formation of a distinct 48S PIC band. Further addition of eIF5, eIF5B and 60S led to the formation of the 80S band. The experiment was repeated three times with similar results. b, A representative gel showing initiation on the cap-RPL41A mRNA. For gel source data, see Supplementary Figure 1. The cap-RPL41A mRNA was labeled with Cy3, and other components were unlabeled. The gel was scanned for Cy3 fluorescence. Various mRNA/protein complexes were formed in the absence of the 40S. Upon adding 40S to the mixture, a distinct 48S PIC band was formed and further addition of eIF5B and 60S shifted this band to the 80S band. The apparent electrophoretic mobility of the 48S PIC formed with the capped-RPL41A mRNA differs from that with the model mRNA, likely due to the different charges/hydrodynamic radius of the complex brought about by the capped-mRNA. Both 48S PIC and 80S formation were very inefficient when the cap-binding eIF4F (eIFs 4A, 4E and 4G) and eIF4B proteins were omitted from the reaction, demonstrating the cap-dependence of the initiation when the full set of eIFs were added. The experiment was repeated three times with similar results. c,d and e, With our 48S PIC assembly regime, we would expect that the 48S PIC in the post-scanning state, with the eIFs required during the scanning process potentially dissociated from the complex. A 9.9Å cryo-EM map was obtained for the 48S PIC formed on the cap-RPL30 mRNA (grey), which was compared with the reported scanning-competent, mRNA channel-open (EMD 3049, yellow, c), or scanning-incompetent, mRNA channel-closed (EMD 3048, cyan, d) 48S PIC structures (see Methods). The cap-RPL30/48S PIC was assembled in the same way as for our single-molecule experiments, and the comparisons showed that it resembles the post-scanning closed state, with the Met-tRNAi positioned in the P-site (e, in red was the modeled Met-tRNAi in the EMD 3048 structure, PDB 3JAP).
Extended Data Fig. 3 |
Extended Data Fig. 3 |. Real-time 80S assembly on the model mRNA at the single-molecule level.
a, smFRET assay for subunit joining in ZMWs. 48S PICs were formed by incubating Cy3–40S, Met-TC, model mRNA-biotin, eIF1, eIF1A and eIF5 at 30ºC for 15 min before immobilization in the ZMWs. After washing away free components, the experiment was started with green laser illumination and delivery of Cy5–60S, eIF5, and eIF5B. The reaction was performed in the 1x Recon buffer supplemented with 1 mM GTP:Mg2+ at 20ºC. b, Example experimental trace showing real-time observation of Cy5–60S joining to immobilized Cy3–48S PIC to form the 80S complex, identified by the appearance of smFRET. Single photobleaching events are denoted. Similar results were obtained from three independent experiments. c, The cumulative probability distribution of 60S joining dwell times was fit to a double-exponential equation, resulting in a fast phase rate of ~0.22 s−1 with ~46% amplitude, and a slow phase rate of ~0.03 s−1 with ~54% amplitude. n = 178. The kinetics is comparable to prior bulk measurement of the same reaction under similar condition (~77% fast phase with a rate of ~0.076 s−1; ~23% slow phase with a rate of 0.019 s−1). d and e, Spermidine-driven initiation in the absence of eIF5B. The cumulative probability distributions of the dwell times for 60S joining (d) and the transition to elongation (e) from experiments performed in the presence or absence of 3 mM spermidine and/or 1 μM eIF5B at 20ºC with the model mRNA were fit to a double-exponential (d) or a single-exponential (e) equation. The estimated average fast and slow phase rates (kfast and kslow) and amplitudes (Afast and Aslow) of 60S joining (from d) and Δt values (from e) with the 95% confidence intervals were shown in the inset table in e. n = 232 (for + spermidine + eIF5B), 117 (for + spermidine – eIF5B) and 164 (for – spermidine + eIF5B). Notably, the Δt is small in the presence of only spermidine, likely due to the lack of the rate-limiting eIF5B dissociation step. Consistently, this Δt falls in the same range of the average tRNA arrival times after eIF5B departure in those experiments performed with labeled eIF5B (Fig. 2).
Extended Data Fig. 4 |
Extended Data Fig. 4 |. Single-molecule assays demonstrate that the first A-site aa-tRNA association is codon/tRNA specific and can lead to further elongation.
a, Experimental setup (left) and sample fluorescence trace (right) for the single-molecule assay to assess the A-site tRNA binding specificity. 48S PICs containing Cy3–40S, Met-tRNAi, and the 3’-biotyinlated model mRNA (encoding Met-Phe-Lys-stop) were immobilized in ZMWs in the presence of required eIFs. Experiments were started by illuminating ZMWs with a green laser and delivering Cy5–60S, Cy3.5-Lys-tRNALys:eEF1A:GTP ternary complex (TC) and eIFs. No Cy3.5-Lys-tRNALys binding events were observed in the 15-min imaging window, demonstrating that the A-site aa-tRNA association was codon/tRNA specific. n = 150. b-e, The elongation competence of the 80S complex is scored by (Cy3.5)tRNAPhe-(Cy5)tRNALys smFRET after initiation and elongation to the second elongation codon in the model mRNA. In order to study the tRNA-tRNA smFRET in the context of ribosomal inter-subunit smFRET, we decided to use Cy3 and Cy5.5 for the labeling of the 40S and 60S, respectively. Therefore, we engineered the yeast 60S to carry a ybbR-tag at the C-terminus of uL18 and labeled the 60S with Cy5.5-CoA by SFP synthase (b), and show that the different tag/label did not significantly affect the kinetics of the transition to elongation (red curve, Δt = 95.4 ± 2.6 s, n = 146, model mRNA, 20ºC and 3 mM free Mg2+) compared with that when using the original Cy5-SNAP-tagged 60S (black curve, Δt = 92.2 ± 2.5 s, n = 164) (c, errors represent 95% confidence intervals of the average dwell times from fitting the lifetimes to single-exponential distributions). d shows a sample fluorescence trace from the experiments where Cy5.5–60S, Cy3.5-Phe-TC, Cy5-Lys-TC, eEF2, eEF3:ATP, eIF5A and other required eIFs were delivered to ZMWs immobilized with 48S PICs containing Cy3–40S, Met-tRNAi, and the 3’-biotyinlated model mRNA, and illuminated with a green laser at 20ºC. Out of n = 152 molecules showing the sequential 60S and Cy3.5-Phe-tRNA association events, n = 113 molecules showed the subsequent Cy3.5-tRNAPhe to Cy5-tRNALys FRET signal (d). And the distribution of the dwell times between the appearance of the Cy3.5 and Cy5 signals was fit to a single-exponential equation, with the average time being 142 ± 8 s (e, the error represents the 95% confidence interval, n = 113). Thus 74% of the first A-site aa-tRNA association yielded the elongation to the next codon.
Extended Data Fig. 5 |
Extended Data Fig. 5 |. Comparisons of the kinetics of the transition from initiation to elongation under various conditions.
The transition dwell times (open circles) were fit to single-exponential distributions to estimate the average dwell times (i.e. Δt values, gray bars, with error bars in black represent the 95% confidence intervals), and compared when no extra factors were added (data taken from Fig. 1d, n = 164), or in presence of eIF3 and eEF3 (n = 130), or with addition of eIF5A (n = 143) (a); or when the concentration of Cy3.5-Phe-TC was at 50 nM (n = 221) or 100 nM (data taken from Fig. 1d, n = 164) (b) in experiments performed with the model mRNA at 20ºC. Similar comparison was shown in (c) for experiments performed with the cap-RPL30 mRNA at 20ºC when the concentration of Cy3.5-Phe-TC was at 100 nM (n = 118) or 200 nM (n = 132). d, The Δt values (the average dwell time estimated from fitting the transition dwell times, open circles, to a single-exponential equation, with 95% confidence intervals in black) compared across all assayed mRNAs at 20ºC and 30ºC (related to Fig. 1a,d). In model mRNA-Kozak_−3U, the −3 position A of the optimal Kozak sequence was mutated to U, which largely abolished the Kozak sequence effect. From bottom to top for each group, n = 118, 130, 130, 121, 149, 161, 189, 159, 164 and 136.
Extended Data Fig. 6 |
Extended Data Fig. 6 |. Neither truncation nor fluorescent labeling of eIF5B perturbs its function.
a, Fluorescent labeling of eIF5B with Cy5.5 via a ybbR-tag at the N-terminal end, which is distal from the ribosomal subunit labels and hence not expected to interfere with the inter-subunit smFRET. The ribosome model was created in PyMOL with PDB 4V8Z. b, A N-terminal domain truncated version of eIF5B (eIF5B-Trunc) was used in most of our assays, as in other reported reconstituted, purified yeast translation assays,,–,,. Previous reports failed to purify the full-length protein and have demonstrated that the truncated protein supported initiation in vitro and in vivo,. c, We tagged eIF5B-Trunc at the N-terminus with a ybbR tag and labeled the protein by SFP synthase with a CoA-Cy5.5 dye. A representative gel is shown, which was first scanned for Cy5.5 fluorescence (right) and subsequently stained with Coomassie blue (left) following SDS-PAGE analysis of ybbR-eIF5B-Trunc post-labeling with and without SFP synthase. The experiment was repeated three times with similar results. d, The GTPase activity of Cy5.5-eIF5B-Trunc was not perturbed by the labeling. Multiple turnover GTP hydrolysis was performed in 50 mM HEPES-KOH pH 7.5, 10 mM Mg(OAc)2, 100 mM KOAc at 30ºC 30min before quenching with malachite green assay solution. Where applicable, concentrations were: GTP 100 μM; eIF5B-Trunc 2.5 μM; Cy5.5-eIF5B-Trunc 2.5 μM; 40S+60S 0.2 μM each. The GTP only group was used as negative controls and the values were normalized to 0. Bars represent mean, and error bars indicate standard deviations of three biological replicates (individual data points are indicated with open circles). e, The dwell times (open circles) between 60S arrival and A-site Phe-TC arrival were fit to single-exponential distributions (n = 141, 159, 164, 118, 133, 130, 131, 189, 134 and 164 from bottom to top for each group) for experiments performed with Cy5.5-eIF5B (related to Fig. 2c) versus those with unlabeled eIF5B (related to Fig. 1d) and at 20ºC or 30ºC. Error bars (in black) represent the 95% confidence intervals of the average dwell times (Δt values). f, Despite it being reported that recombinant yeast eIF5B-FL purification cannot be achieved, we were able to recombinantly express and purify it as shown by a 12% SDS-PAGE gel analysis. The experiment was repeated three times with similar results. g, Use of the full-length eIF5B in our assay did not lead to faster transition to elongation in experiments performed with the cap-RPL30 mRNA at 3 mM free Mg2+ 20ºC. Error bars (in black) represent the 95% confidence intervals of the average dwell times (Δt values, gray bars) from fitting of the dwell times (open circles) to single-exponential distributions. From left to right, n = 118 (related to Fig. 1d) and 205.
Extended Data Fig. 7 |
Extended Data Fig. 7 |. The use of a non-hydrolysable GTP analog, GDPNP, traps eIF5B on the 80S and prevents the transition to elongation.
a, Sample trace from experiments performed with GTP (n = 134). The grey highlighted part of the trace is shown in Fig. 2a as a zoomed-in view. b, Sample trace from experiments performed with non-hydrolysable GDPNP (n = 105), whereupon 60S joining eIF5B is trapped on the 80S and no A-site tRNA binding was observed. Black dash boxed Cy5.5 events are transient eIF5B sampling events to the 48S PIC prior to 60S joining. c, The cumulative probability distributions of the Cy5.5-eIF5B lifetimes on 80S in experiments performed with the model mRNA at 3 mM Mg2+ and 20ºC in the presence of GTP (n = 134, related to Fig. 2d) or GDPNP (n = 105). In the presence of GTP, the mean lifetime was 51.9 s (± 1.8 s, 95% confidence interval from fitting to a single-exponential equation); in the presence of GDPNP, the mean lifetime was 848 s (± 19 s, 95% confidence interval from fitting to a linear equation).
Extended Data Fig. 8 |
Extended Data Fig. 8 |. The effects of eIF5B mutations on the kinetics of 60S joining and the transition to elongation.
The cumulative probability distributions of the 60S joining (a) and the transition to elongation (b) dwell times from experiments performed with unlabeled wild-type (WT, n = 164), or T439A mutant (n = 131), or H505Y mutant (n = 119) eIF5B and the model mRNA at 20ºC in the presence of 3 mM Mg2+ and 1mM GTP. The estimated average fast and slow phase rates (kfast and kslow) and amplitudes (Afast and Aslow) of 60S joining (from a) and Δt values (from b) with the 95% confidence intervals were shown in (c), from fitting the distributions to a double-exponential (WT and H505Y) or a single-exponential (T439A) equation for the 60S joining; to a single-exponential equation for the transition dwell times. *Note: in case of T439A mutant eIF5B, out of n = 131 molecules showing 60S joining signal, only n = 17 molecules showed the subsequent A-site aa-tRNA association signal. Thus the T439A mutant is defective in catalyzing subunit joining (consistent with bulk measurement), and inhibits the A-site tRNA association.
Extended Data Fig. 9 |
Extended Data Fig. 9 |. Free Mg2+ concentration modulates 60S joining and the transition to elongation.
a, The dwell times for the transition from initiation to elongation (open circles) were fit to single-exponential distributions to estimate the average transition dwell times (Δt values, with 95% confidence intervals, in red) from experiments performed with unlabeled eIF5B and cap-RPL30 mRNA or model mRNA-Kozak at 20ºC in the presence of 1 to 10 mM Mg2+ (data for 3 mM Mg2+ were taken from Fig. 1d). For cap-RPL30, unstable 80S formation was observed at 1 mM Mg2+ (see (f) below) and thus no Δt values were obtained. From bottom to top for each group, n = 108, 189, 124, 150, 144, 118 and 195. b, The dwell times for the transition from initiation to elongation (open circles) were fit to single-exponential distributions to estimate the average transition dwell times (Δt values, with 95% confidence intervals, in red) from experiments performed with unlabeled eIF5B and cap-RPL30 or model mRNA-Kozak under denoted conditions. From left to right for each group, n = 195, 152, 118, 130, 150, 132, 189 and 159. c, The dwell times (open circles) for the transition from initiation to elongation, eIF5B lifetimes on 80S, and tRNA arrival times after eIF5B departure were fit to single-exponential distributions to estimate the average dwell times (with 95% confidence intervals, in black). Experiments were performed with cap-RPL30 mRNA at 3 mM free Mg2+ and 20ºC in the presence of unlabeled (n = 195, data taken from Fig. 1d) or Cy5.5-eIF5B (n = 164, data taken from Fig. 2c); or at 2 mM free Mg2+ and 30ºC in the presence of unlabeled (n = 152, data taken from b) or Cy5.5-eIF5B (n = 150). d, The 60S joining dwell times (open circles) from the same experiments as in (a) were fit to single-(for model mRNA-Kozak) or double- (for cap-RPL30, with the fast phase average times were plotted here) exponential distributions to estimate the average dwell time (with 95% confidence intervals, in red). e, The cumulative probability distribution of the 60S joining times showing compromised 60S joining rate in experiments performed with the model mRNA-Kozak at 1 mM Mg2+ and 20ºC as in (a) (n = 150). However, we still observed that A-site tRNA arrival occurred readily after 80S formation. The 60S joining kinetics under this reaction condition were not well fit by a single- nor double-exponential distributions and therefore no average time was deduced for the bar plot in (d). f, Sample trace from experiments performed with cap-RPL30 mRNA at 1 mM Mg2+ and 20ºC as described in (a), n = 200. g and h, Dot plots for Fig. 2c and 2e, showing the single-exponential distributions of the dwell times, with the average dwell times (with 95% confidence interval) in black. Notes: (1) Increasing free Mg2+ concentrations increased the Δt values (i.e. higher Mg2+ concentration favors the eIF5B-bound semi-rotated 80S conformation, Extended Data Fig. 10). This seems opposite to the known effects of free Mg2+ concentrations on the conformation of the bacterial pre-translocation 70S elongation complex: lower Mg2+ concentration favors the rotated state and higher Mg2+ concentration favors the non-rotated state. The seeming discrepancy might be a result of the different compositions of the complexes: in our case, the semi-rotated state of the 80S contains an acylated Met-tRNAi in the P site and a protein factor eIF5B bound in the A site; while in the pre-translocation 70S complex, the P-site tRNA is deacylated and the A site is bound with a peptidyl-tRNA. The energy landscape differences between these two types of complexes can also be explained by no apparent fluctuations between semi-rotated and non-rotated 80S conformations with eIF5B bound vs. frequent fluctuations between rotated and non-rotated 70S conformations in the pre-translocation complexes. (2) The different magnitudes of temperature (Fig. 1d)/Mg2+ concentration dependence of Δt values for different mRNAs suggest that there are mRNA sequence context differences in the thermodynamics governing the transition from initiation to elongation. Similarly, the minimal Mg2+ concentrations required for stable 80S assembly on different mRNAs are different.
Extended Data Fig. 10 |
Extended Data Fig. 10 |. Cryo-EM analyses of the on-pathway 80S complexes during initiation and the transition to elongation.
a, Cumulative probability distributions of the dwell times for 60S joining to 48S PIC (i.e. the formation of 80S complex, black, designated as “total 80S”) and the subsequent A-site aa-tRNA association (corresponding to the Δt value, blue, designated as “80S EC”) were from the single-molecule experiment with the model mRNA and wild-type eIF5B at 20ºC and 3 mM free Mg2+ (n = 164). The red curve corresponds to the time-evolution of the fraction of the eIF5B-bound 80S complex (80S IC) simulated with the kinetics of the prior two curves. Dashed lines indicate that at time point 45 s, ~64.5% of the 80S complexes should be in the 80S IC state under this condition. b, The cryo-EM observed population sizes of the two classes of 80S complexes (80S IC, 17,602 particles, 70%; 80S EC, 7,542 particles, 30%) were in agreement with predictions from our single-molecule kinetics at time point 45 s. c-f show the compositional and conformational differences between the 80S IC and EC complexes. g. Summary of cryo-EM data collection and processing for the 48S PIC (Extended Data Fig. 2c–e), 80S IC (c) and 80S EC (d) maps.
Fig. 1.
Fig. 1.. Real-time observation of eukaryotic translation initiation and the transition to elongation.
a, mRNA constructs used in single-molecule assays (also see Extended Data Fig. 5d). All the mRNAs contain a UUC phenylalanine (Phe) codon after the AUG start codon and are biotinylated at their 3’ ends. b, Experimental setup for single-molecule assays. 48S preinitiation complexes (PICs) containing Cy3–40S, Met-tRNAi, and the 3’-biotyinlated mRNA of interest were immobilized in ZMWs in the presence of required eIFs. Experiments were started by illuminating ZMWs with a green laser and delivering Cy5–60S, Cy3.5-Phe-tRNAPhe:eEF1A:GTP ternary complex (TC) and eIFs. c, Example experimental trace (bottom) and schematic illustration (top) of the molecular events along the reaction coordinate. The dwell times between the 60S joining and the A-site Phe-TC arrival were measured for n = 118, 130, 130, 121, 189, 159, 164 and 136 molecules (d, from bottom to top for each bar), and fit to single-exponential distributions to estimate the average time, “Δt” (with 95% confidence interval), of the transition from initiation to elongation.
Fig. 2.
Fig. 2.. eIF5B gates the transition between initiation and elongation.
Sample trace (a) and schematic illustration (b) showing the correlation of the Cy5.5-eIF5B occupancy on the ribosomal complex with Cy5–60S joining and Cy3.5-Phe-TC arrival. c, For all assayed mRNAs, the Δt values, average eIF5B lifetimes on 80S, and average tRNA arrival times after eIF5B departure (with 95% confidence intervals) were estimated by fitting the dwell times (from bottom to top for each group of three bars, n = 141, 164, 133, 131 and 134) to single-exponential distributions (also see Extended Data Fig. 9g). d, Contour plots of Cy5.5-eIF5B departure (bottom, normalized Cy5.5 fluorescence intensity changing from 1 to 0) and Cy3.5-Phe-TC arrival (top, normalized Cy3.5 intensity changing from 0 to 1) in experiments performed with model mRNA in the presence of GTP, generated by superimposing all the analyzed fluorescence traces such that the Cy3.5-Phe-TC arrival was set at time 0. Contours are plotted from tan (lowest population) to red (highest population), n = 134. e, The same types of average dwell times (with 95% confidence intervals from fitting to single-exponential distributions) as in (c) were determined for experiments performed with the model mRNA at 3 mM free Mg2+ and 20ºC, in the presence of GTP with either unlabeled wild-type (WT) eIF5B (n = 164, data taken from Fig. 1d); Cy5.5-labeled WT eIF5B (n = 134, data taken from c); unlabeled eIF5B-H505Y (n = 119); or Cy5.5-labeled eIF5B-H505Y (n = 80); or separately in the presence of GDPNP with unlabeled eIF5B-H505Y (n = 80) (also see Extended Data Fig. 9h).
Fig. 3.
Fig. 3.. Model of the late eukaryotic translation initiation and its transition to elongation.
eIF5B catalyzes 60S subunit joining to the 48S PIC to form the 80S initiation complex (IC), and its dissociation from the 80S IC requires GTP hydrolysis, plausibly leading to an altered eIF5B conformation thereby lowering its affinity to the 80S. Thus, the dissociation of eIF5B from the 80S IC gates the transition to elongation, marked by the binding of an elongator aa-tRNA to the elongation 80S complex (80S EC). Effects of free Mg2+ concentration, the sequence context surrounding the start codon, and temperature on the rate of the transition indicate that conformational rearrangements may play key roles in governing the rate of eIF5B dissociation, likely by controlling its GTPase activity.

Similar articles

Cited by

References

    1. Hinnebusch AG The scanning mechanism of eukaryotic translation initiation. Annu. Rev. Biochem 83, 779–812 (2014). - PubMed
    1. Sokabe M & Fraser CS Toward a kinetic understanding of eukaryotic translation. Cold Spring Harb. Perspect. Biol a032706 (2018). doi:10.1101/cshperspect.a032706. - DOI - PMC - PubMed
    1. Kaledhonkar S et al. Real-time structural dynamics of late steps in bacterial translation initiation visualized using time-resolved cryogenic electron microscopy. Nature 570, 400–404 (2019). - PMC - PubMed
    1. Tsai A et al. Heterogeneous pathways and timing of factor departure during translation initiation. Nature 487, 390–393 (2012). - PMC - PubMed
    1. Goyal A, Belardinelli R, Maracci C, Milón P & Rodnina MV Directional transition from initiation to elongation in bacterial translation. Nucleic Acids Res. 43, 10700–10712 (2015). - PMC - PubMed

Methods-only References

    1. Yin J, Lin AJ, Golan DE & Walsh CT Site-specific protein labeling by Sfp phosphopantetheinyl transferase. Nat. Protoc 1, 280–285 (2006). - PubMed
    1. Petrov A, Grosely R, Chen J, O’Leary SE & Puglisi JD Multiple parallel pathways of translation initiation on the CrPV IRES. Mol. Cell 62, 92–103 (2016). - PMC - PubMed
    1. Bowen AM et al. Ribosomal protein uS19 mutants reveal its role in coordinating ribosome structure and function. Translation 3, e1117703 (2015). - PMC - PubMed
    1. Ito H, Fukuda Y, Murata K & Kimura A Transformation of intact yeast cells treated with alkali cations. J. Bacteriol 153, 163–168 (1983). - PMC - PubMed
    1. Maniatis T, Fritsch EF & Sambrook J Molecular cloning: a laboratory manual. (Cold Spring Harbor Laboratory Press, 1982).

Publication types

MeSH terms

Substances

LinkOut - more resources