. 2019 Sep 17;28(12):3212-3223.e6.
doi: 10.1016/j.celrep.2019.08.045.

Polymer Modeling Predicts Chromosome Reorganization in Senescence

Affiliations

Polymer Modeling Predicts Chromosome Reorganization in Senescence

Michael Chiang et al. Cell Rep. .

Abstract

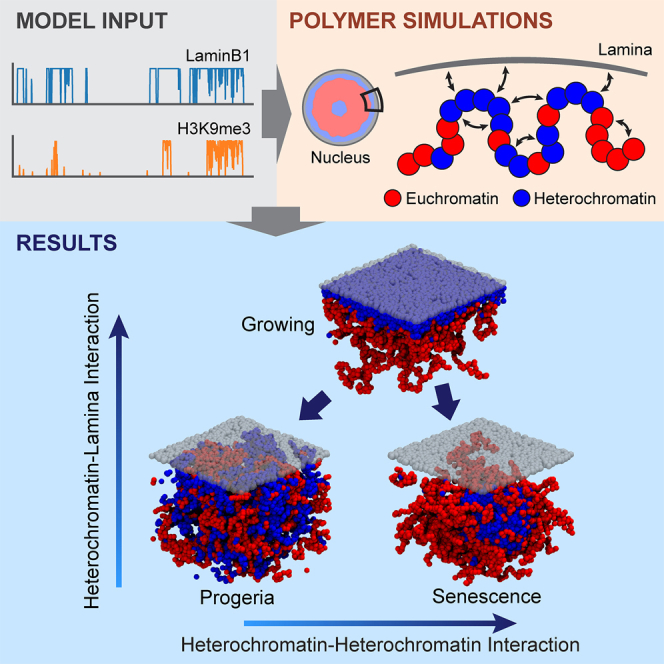
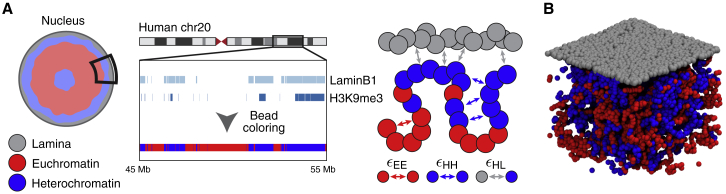
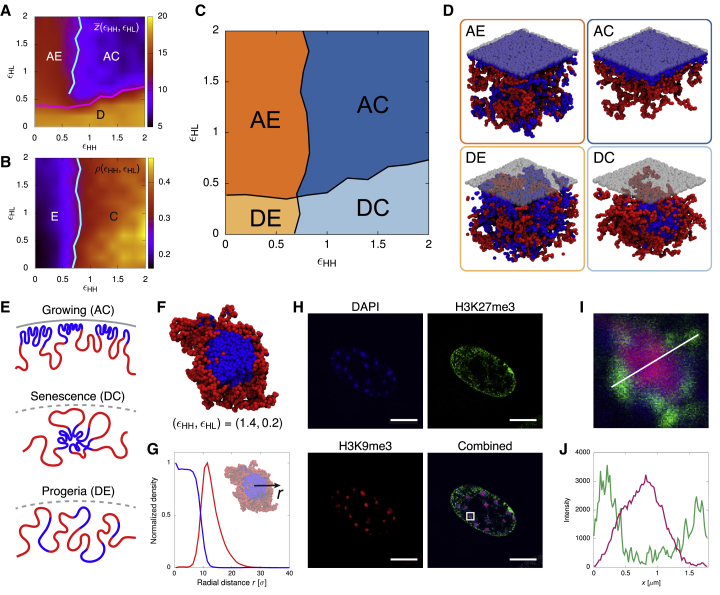
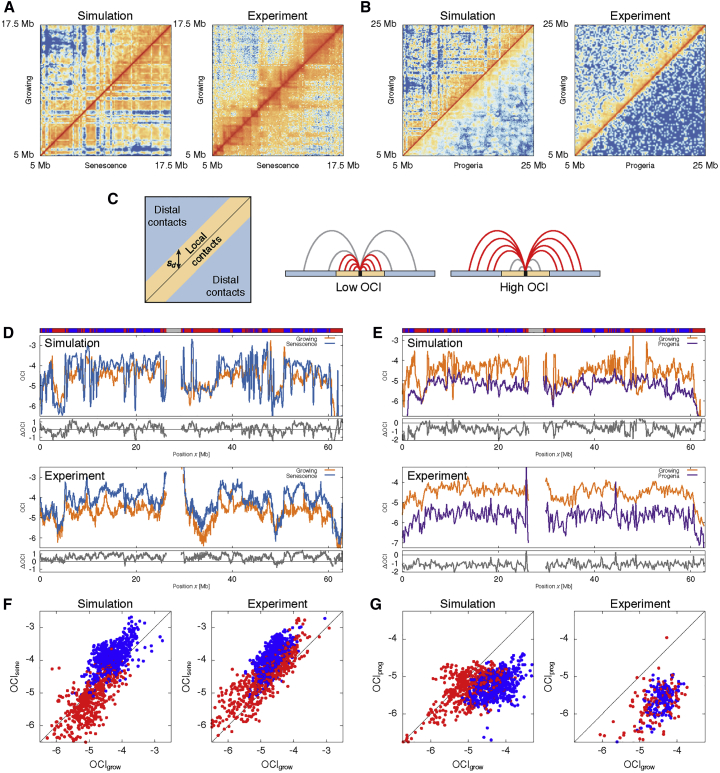
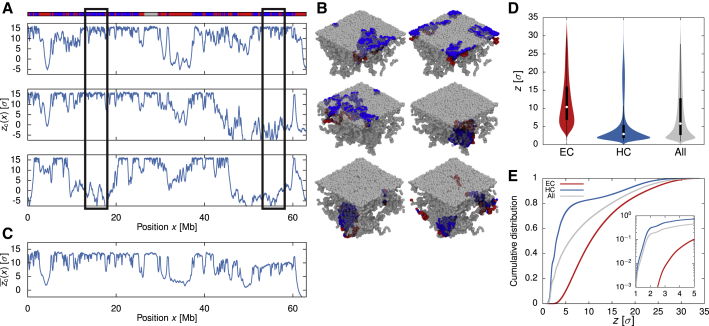
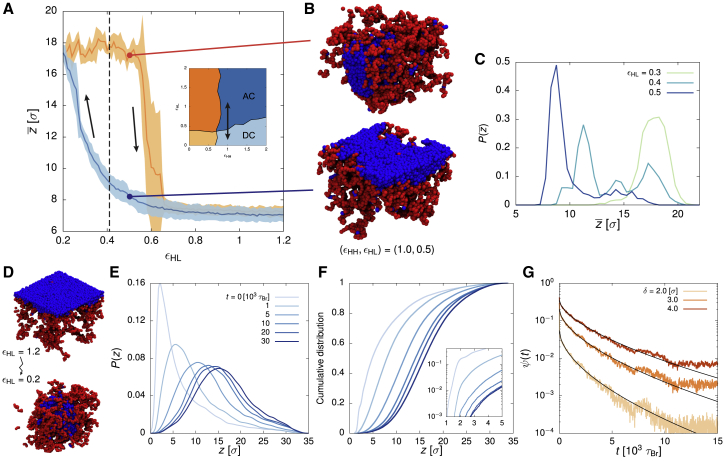
Lamina-associated domains (LADs) cover a large part of the human genome and are thought to play a major role in shaping the nuclear architectural landscape. Here, we perform polymer simulations, microscopy, and mass spectrometry to dissect the roles played by heterochromatin- and lamina-mediated interactions in nuclear organization. Our model explains the conventional organization of heterochromatin and euchromatin in growing cells and the pathological organization found in oncogene-induced senescence and progeria. We show that the experimentally observed changes in the locality of contacts in senescent and progeroid cells can be explained as arising due to phase transitions in the system. Within our simulations, LADs are highly stochastic, as in experiments. Our model suggests that, once established, the senescent phenotype should be metastable even if lamina-mediated interactions were reinstated. Overall, our simulations uncover a generic physical mechanism that can regulate heterochromatin segregation and LAD formation in a wide range of mammalian nuclei.

Keywords: cellular senescence; genome organization; heterochromatin; nuclear lamina; phase transitions; polymer simulations; progeria.


Conflict of interest statement

The authors declare no competing interests.

Figures

None
Graphical abstract
Figure 1
Figure 1
A Polymer Model for Lamina-Mediated Chromosome Organization in Different Cell States (A) A subsection of the nuclear periphery and human chromosome 20 were simulated. Chromatin was modeled as a flexible bead-spring chain, with red beads representing euchromatin (EC) and blue beads representing heterochromatin (HC). The nuclear lamina (NL) was represented as a layer of static beads (gray). Chromatin beads were labeled HC if the corresponding genomic region was enriched in H3K9me3 and/or LaminB1. Beads corresponding to the centromeric region (26.4–29.4 Mb) were also treated as HC. All of the other beads were labeled EC. EC and HC beads can interact with beads of the same kind with interaction strength ϵEE and ϵHH, respectively. HC beads can also interact with the NL beads with interaction strength ϵHL. (B) A simulation snapshot of the model when the HC-HC and HC-NL interactions are weak.
Figure 2
Figure 2
Variations of the Two Model Parameters Reproduce Chromatin Organization in Growing, Senescent, and Progeroid Cells (A) A heatmap showing the distance z¯ between the center of mass of the chromosome from the NL across the parameter space (ϵHH,ϵHL). Ten simulations were performed for every 0.2 increment in both ϵHH and ϵHL directions. Distances are reported in units of the bead size (σ70 nm). The pink line separating the adsorbed and desorbed regime was estimated based on the inflection points in z¯ when varying ϵHL for fixed ϵHH. z¯ also captures the transition between the collapsed and extended phase in the adsorbed regime, as a compact fiber would stay closer to the NL. The cyan line reports the inflection points at which this transition occurs. (B) A heatmap showing the average local number density ρ of chromatin beads across the parameter space. The cyan line separating the extended and collapsed phases was estimated based on the inflection points in ρ. Its location is consistent with that estimated from z¯. The interaction strengths for extended and collapsed conformation are also in line with recent studies on chromatin structure in yeast (Socol et al., 2019) and Drosophila (Lesage et al., 2019). (C) A full-phase diagram of the four observed phases: adsorbed-extended (AE), adsorbed-collapsed (AC), desorbed-extended (DE), and desorbed-collapsed (DC). The boundary lines are those from (A) and (B). (D) Simulation snapshots of the four phases. (E) Illustrations of chromatin structures for cells in growing, senescent, and progeroid conditions. (F) Cross-sectional view of a simulation snapshot corresponding to the DC or senescent phase. (G) Time-averaged density profiles of HC and EC as a function of distance r from the center of the globule. (H) Confocal images of chromosomes in senescent cells with DAPI, H3K27me3, and H3K9me3 staining. Scale bars indicate 10 μm. (I) Enlarged view of an SAHF corresponding to the white square in the combined image in (H). (J) Corresponding intensity profiles for H3K9me3 and H3K27me3 along the white line in (I).
Figure 3
Figure 3
Chromatin Contact Network and the Open Chromatin Index (OCI) in Growing (AC), Senescent (DC), and Progeroid (DE) Phases (A and B) Heatmaps comparing the contact frequencies between (A) growing and senescence and (B) growing and progeria in simulations and experiments. In our simulations, we used (ϵHH,ϵHL)=(1.0,1.6) for growing, (1.4,0.2) for senescence, and (0.2,0.2) for progeria. We performed 20 simulations for each case. We used Hi-C data from Chandra et al. (2015) for the comparison between growing and senescence, and data from McCord et al. (2013) for the comparison between growing and progeria. The contact frequencies are plotted in log scale to aid visualization. (C) The open chromatin index (OCI). Contacts were defined to be local or distal based on a threshold sd, which was set to 2 Mb (close to the maximum size of a TAD [Dekker and Heard, 2015]; see STAR Methods). (D and E) The OCI value of each bin in the heatmap for (D) growing and senescence and (E) growing and progeria. Their difference (ΔOCI) is shown in the bottom track. The top track indicates the chromatin state along the polymer (i.e., red for EC, blue for HC, and gray for centromeric region). (F and G) Scatterplots of the OCI value of each bin for (F) growing versus senescence and (G) growing versus progeria. The color of each point indicates the chromatin state of the corresponding bin (treating centromeric region as HC).
Figure 4
Figure 4
Simulations Show Stochasticity in Chromatin Contacts with the NL (A) Plots showing the distance zc of each chromatin bead from the horizontal plane at the center of the simulation box for three simulation runs in the growing (AC) phase (ϵHH=1.0,ϵHL=1.6). As the NL is located at the top of the box (zc17σ), a high value in zc indicates that the bead is close to the NL. The x axis shows the genomic position corresponding to each bead. The top track indicates the chromatin state along the polymer. (B) Snapshots of the simulation runs coloring only the beads within the two highlighted regions in (A) (rectangular boxes). These figures reveal that the same chromatin segment can reside in different positions relative to the NL in different runs, which is consistent with experimental observations that LADs associate with the NL stochastically. (C) The average value of zc for each bead over 20 simulations. (D) Violin plots showing the distributions of the distance z from the NL for EC, HC, and all beads. (E) Cumulative distributions of z for EC, HC, and all beads. The inset shows the distributions (in log-linear form) for small z.
Figure 5
Figure 5
The Transition between the Growing (AC) and Senescent (DC) Phase Is Abrupt and History Dependent (A) The distance z¯ between the center of mass of the chromosome and the NL, averaged over five simulation runs in which we fix ϵHH=1.0 and gradually decrease ϵHL from 1.2 to 0.2 over 106 Brownian time steps, before increasing it back to 1.2 over the same time (its path in the phase diagram is shown in the inset). The shaded area around the curve reports the SD of the mean. The dashed line marks the predicted transition point between the adsorbed and desorbed regime at ϵHH=1.0 (see Figures 2A and 2C). Hysteresis occurs in the region ϵHL0.3–0.6. (B) Snapshots of the system at ϵHL=0.5 showing that it can either be in the AC (growing) or the DC (senescent) phase, depending on its history. (C) The probability density function of z¯ at ϵHL=0.3, 0.4, and 0.5 (ϵHH=1.0; 50 simulations were sampled for each parameter set). A bimodal behavior is found when ϵHL0.4, suggesting the coexistence of both the AC and DC phases. (D) Snapshots of our simulation modeling the process of LADs detachment from the NL, during which we change ϵHL instantaneously from 1.2 to 0.2. (E) The probability density function of the distance z of each bead from the NL at time t after ϵHL has been reduced (sampled from ten simulations). (F) The corresponding cumulative distribution of z. The inset shows the distribution for small z in log-linear form. (G) A log-linear plot of the fraction of beads ψ in contact with the NL (those whose distance from the NL is less than δ) at time t after the weakening in ϵHL, for three different thresholds of δ. The black curves are stretch exponential fits f(t)=κexp(αtβ). The fitted stretch exponents β are 0.56, 0.58, and 0.61 for δ=2, 3, and 4σ, respectively.

Similar articles

Cited by

References

    1. Barbieri M., Chotalia M., Fraser J., Lavitas L.M., Dostie J., Pombo A., Nicodemi M. Complexity of chromatin folding is captured by the strings and binders switch model. Proc. Natl. Acad. Sci. USA. 2012;109:16173–16178. - PMC - PubMed
    1. Barbieri M., Fraser J., Lavitas L.M., Chotalia M., Dostie J., Pombo A., Nicodemi M. A polymer model explains the complexity of large-scale chromatin folding. Nucleus. 2013;4:267–273. - PMC - PubMed
    1. Binder K. Theory of first-order phase transitions. Rep. Prog. Phys. 1987;50:783–859.
    1. Bonev B., Cavalli G. Organization and function of the 3D genome. Nat. Rev. Genet. 2016;17:661–678. - PubMed
    1. Boumendil C., Hari P., Olsen K.C.F., Acosta J.C., Bickmore W.A. Nuclear pore density controls heterochromatin reorganization during senescence. Genes Dev. 2019;33:144–149. - PMC - PubMed

LinkOut - more resources