. 2019 Sep 17;28(12):3131-3143.e5.
doi: 10.1016/j.celrep.2019.08.048.

The Synaptic Organization of Layer 6 Circuits Reveals Inhibition as a Major Output of a Neocortical Sublamina

Affiliations

The Synaptic Organization of Layer 6 Circuits Reveals Inhibition as a Major Output of a Neocortical Sublamina

Jaclyn Ellen Frandolig et al. Cell Rep. .

Abstract

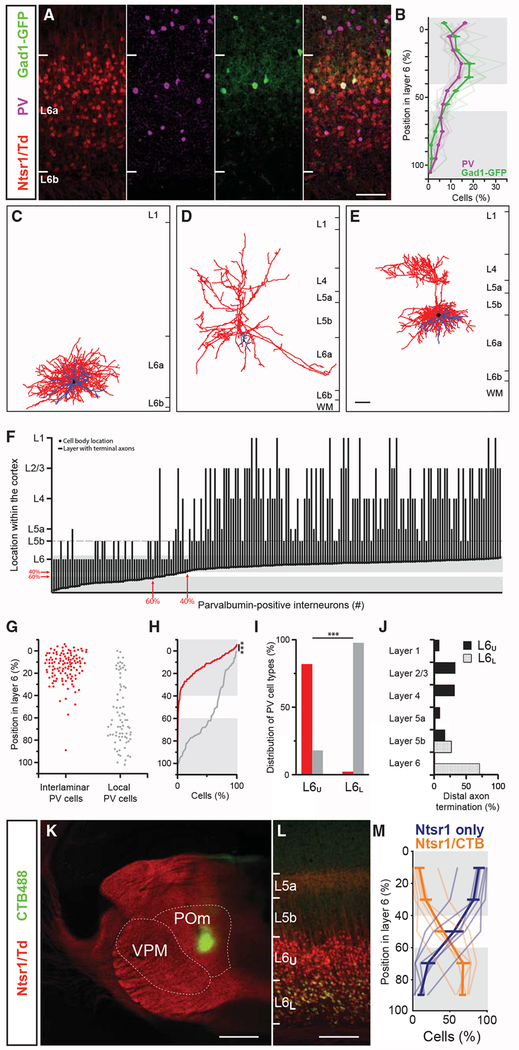
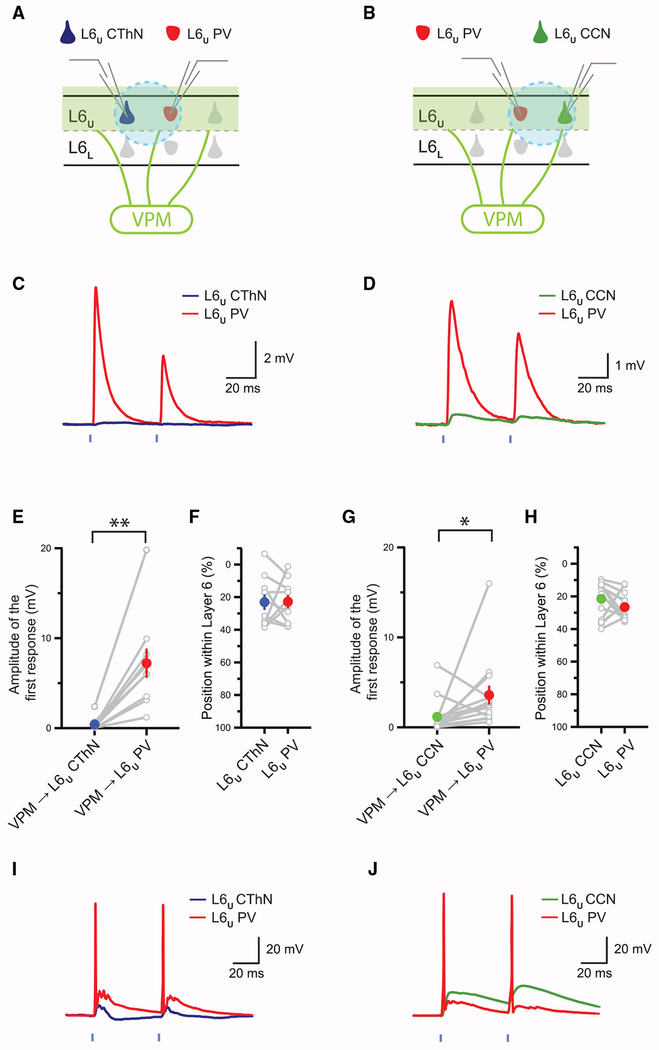
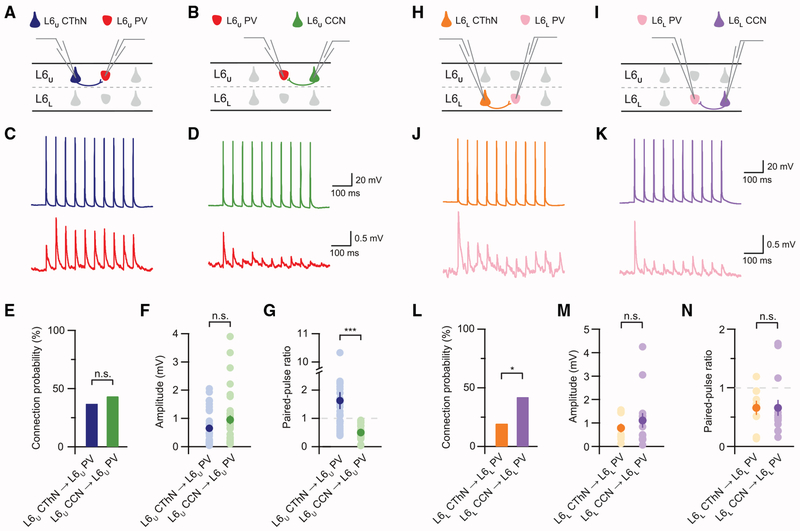
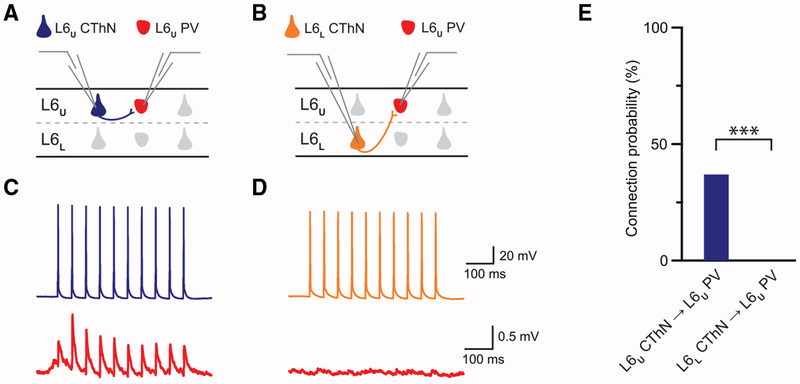
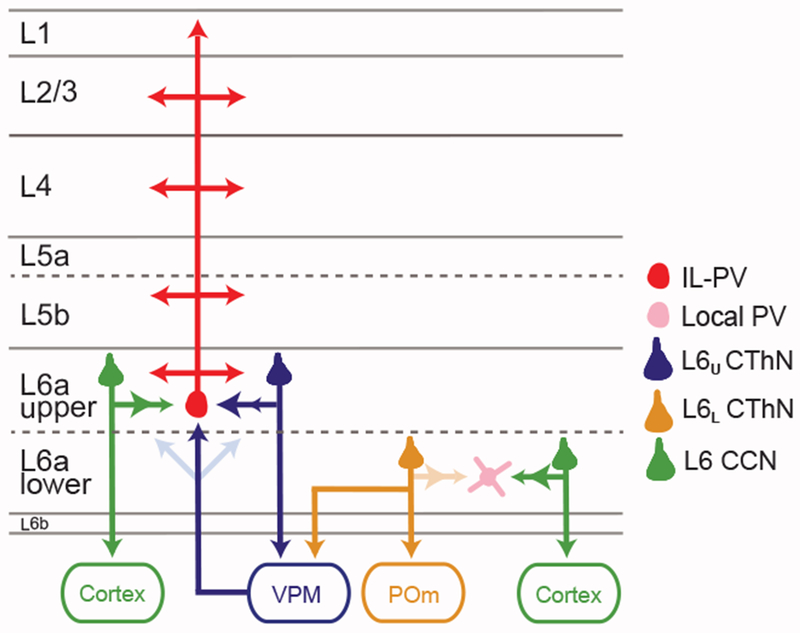
The canonical cortical microcircuit has principally been defined by interlaminar excitatory connections among the six layers of the neocortex. However, excitatory neurons in layer 6 (L6), a layer whose functional organization is poorly understood, form relatively rare synaptic connections with other cortical excitatory neurons. Here, we show that the vast majority of parvalbumin inhibitory neurons in a sublamina within L6 send axons through the cortical layers toward the pia. These interlaminar inhibitory neurons receive local synaptic inputs from both major types of L6 excitatory neurons and receive stronger input from thalamocortical afferents than do neighboring pyramidal neurons. The distribution of these interlaminar interneurons and their synaptic connectivity further support a functional subdivision within the standard six layers of the cortex. Positioned to integrate local and long-distance inputs in this sublayer, these interneurons generate an inhibitory interlaminar output. These findings call for a revision to the canonical cortical microcircuit.

Keywords: corticocortical neurons; corticothalamic neurons; fast-spiking interneurons; layer 6; neocortex; parvalbumin interneurons; thalamus.


Conflict of interest statement

DECLARATION OF INTERESTS

The authors declare no competing interests.

Figures

Figure 1.
Figure 1.. Interlaminar Parvalbumin Interneurons (IL-PV INs) Are Restricted to a Sublamina in Upper Layer 6a
(A) Confocal images of L6 corticothalamic neurons (CThNs) identified by Ntsr1-Cre;tdTomato expression (red, far left), parvalbumin interneurons (PV INs) identified with antibodies to PV (purple, left), or GFP expression in a Gad1-GFP mouse line (G42 line) in which GFP is selectively expressed in PV INs (green, right) in barrel cortex, overlaid in the far-right panel. (B) Distribution of PV+ and GFP+ INs in L6 (n = 9 slices from 2 mice). Gray shading highlights regions above 40% (L6U) and below 60% (L6L) of the vertical extent of L6a, between which comparisons were made (number of PV INs in L6U, top gray region: 64.9% ± 1.5% and L6L, bottom gray region: 20.2% ± 1.4%; p < 0.0039, Wilcoxon signed-rank test; number of GFP INs in L6U, top gray region: 67.8% ± 0.4% and L6L, bottom gray region: 12.1% ± 1.1%, p < 0.0039, Wilcoxon signed-rank test). (C–E) Three-dimensional reconstruction of a PV IN with locally ramifying axons (C) and two PV INs with interlaminar-projecting axons (D and E). Axons in red, dendrites in blue, and cell bodies in black. (F) Plot showing the soma location and layer containing the distal terminal axons of morphologically identified PV INs (n = 195). The red arrows indicate depths of 40% and 60% in L6a (y axis) and cell body locations of the PV INs most closely positioned to these depths (x axis). L6U and L6L were defined based on the proportion of local PV and IL-PV INs and are indicated by the gray shading. (G) Summary data showing the soma location of each IL-PV (red) and local PV IN (gray) in L6a. (H) Cumulative distribution in L6a of the soma location of IL-PV (red) and local (gray) PV INs (p = 2.8 × 10⁻¹⁹; Kolmogorov-Smirnov test). (I) Percentage of PV INs with interlaminar or local morphology in L6U (n = 139) and L6L (n = 44; p = 6.46 × 10 −23, Fisher’s exact test). (J) Laminar location of the distal-most axonal process for neurons in L6U (n = 139, black) and L6L (n = 44, stippled; p < 0.00001, chi-square test). (K) Low-magnification view of an injection of retrograde tracer (green, Alexa 488 cholera toxin B [CTB]; Alexa 488 CTB) into the posterior medial nucleus (POm) of the thalamus of an Ntsr1-Cre;tdTomato mouse. (L) Image of the barrel cortex showing L6 CThNs that project to the ventral posterior medial nucleus (VPM) of the thalamus (red, VPM-only L6 CThNs) and L6 CThNs that project to VPM and the POm (yellow, VPM/POm L6 CThNs). (M) Distribution of VPM-only (Ntsr1) and VPM/POm (Ntsr1/CTB) L6 CThNs in L6a of the barrel cortex (n = 6 slices from 4 mice). Gray shading highlights L6U and L6L as defined by the distribution of IL-PV and local PV INs. Scale bars, 100 μm in (A), (C)–(E), and (L); 500 μm in (K). See also Figures S1 and S2.
Figure 2.
Figure 2.. Thalamocortical (TC) Input Is Stronger onto IL-PV INs Than CThNs or CCNs in L6U
(A and B) Recording configurations for L6U CThN-L6U PV IN (A) and L6U CCN-L6U PV IN (B) pairs. (C and D) Examples of monosynaptic TC input to an L6U CThN and L6U PV IN (C) and to an L6U CCN and L6U PV IN (D) pair. (E and G) Summary data of the amplitudes of monosynaptic TC input to L6U CThN and L6U PV IN pairs (E; n = 10; p = 0.0020, Wilcoxon signed-rank test) and to L6U CCN and L6U PV IN pairs (G; n = 14; p = 0.0419, Wilcoxon signed-rank test). (F and H) Summary data of the laminar positions in L6a for each L6U PV-L6U CThN (F) and L6U PV-L6U CCN pair (H) recorded in (E) and (G). (I and J) Responses recorded in an L6U PV and L6U CThN (I) and an L6U PV and L6U CCN pair (J) under conditions that evoked action potentials in at least one neuron. See also Figures S3 and S4.
Figure 3.
Figure 3.. CThNs in L6a Do Not Preferentially Synapse onto Either IL-PV INs in L6U or Local PV INs in L6L
(A and B) Recording configurations for L6U CThN-L6U PV IN (A) and L6U CCN-L6U PV IN (B) pairs. (C and D) Unitary synaptic connections for an L6U CThN→L6U PV (C) and an L6U CCN→L6U PV (D) pair. (E) The probability of connection for tested L6U CThN→L6U PV and L6U CCN→L6U PV connections (L6U CThN→L6U PV: 37%, n = 32 of 86 tested connections; L6U CCN→L6U PV: 44%, n = 34 of 78 tested connections; p = 0.43, Fisher’s exact test). (F) The amplitudes of the unitary excitatory postsynaptic potentials (uEPSPs) of connected pairs (L6U CThN→L6U PV: 0.65 ± 0.12 mV, n = 32; L6U CCN→L6U PV: 0.95 ± 0.16 mV, n = 34; p = 0.1190, Wilcoxon rank-sum test). (G) The paired-pulse ratio (PPR) for connected pairs differed between the two types of connections (p = 9.3728 × 10⁻⁹, Wilcoxon rank-sum test). (H and I) Recording configurations for L6L CThN-L6L PV IN (A) and L6L CCN-L6L PV IN (B) pairs. (J and K) Unitary synaptic connections for an L6L CThN→L6L PV (J) and an L6L CCN→L6L PV (K) pair. (L) The probability of connection for tested L6L CThN→L6L PV and L6L CCN→L6L PV connections (L6L CCN→L6L PV: 42%, n = 14 of 33 tested connections; L6L CThN→L6L PV: 20%, n = 9 of 46 tested connections; p = 0.0436, Fisher’s exact test). (M) The amplitudes of the uEPSPs of connected pairs (L6L CThN→L6L PV: 0.78 ± 0.19 mV, n = 9; L6L CCN→L6L PV: 1.11 ± 0.32 mV, n = 14; p = 0.9247, Wilcoxon rank-sum test). (N) The PPR for connected pairs (p = 0.5495, Wilcoxon rank-sum test). See also Figures S5 and S6.
Figure 4.
Figure 4.. The Vertical Distribution of Interlaminar and Local Parvalbumin Interneurons Correlates with the Distribution of Infrabarrels in L6a and the Two Classes of L6a CThNs
(A–D) Low-magnification view of the distribution of presynaptic terminals of thalamocortical afferents from VPM stained with antibodies to vesicular glutamate transporter 2 (VGluT2) in the barrels and infrabarrels (A, shown with asterisk), the barrel hollows visible via DAPI-stained nuclei in L4 (B, shown with asterisk), and VPM/POm L6 CThNs in L6L as well as L5 POm-projecting CThNs retrogradely labeled with fluorescent microspheres (C, red, Lumafluor). In (D), (A) and (C) are overlaid, showing that the infrabarrels are located in L6U, above the VPM/POm L6 CThNs in L6L. (E and G) Localized injections biased toward L6U (E) or L6L (G) of an adenoassociated virus carrying a Cre-dependent YFP construct. (F and H) Confocal images of L6 CThNs primarily in L6U (F) or L6L (H). Scale bars, 100 μm in (A)–(D), (F), and (H); 200 μm in (E) and (G).
Figure 5.
Figure 5.. CThNs in L6L Do Not Synapse onto IL-PV INs in L6U
(A and B) Recording configurations for L6U CThN→L6U PV IN (A) and L6L CThN-L6U PV IN (B) pairs. (C) Unitary connection for an L6U CThN→L6U PV pair different from the pair in Figure 3C. (D) Tested L6L CThN→L6U PV pair showing no synaptic connection. (E) The probability of connection for tested L6U CThN/L6U PV (replotted from Figure 3E) and L6L CThN→L6U PV pairs (L6U CThN→L6U PV: 37%, n = 32 of 86 tested connections; L6L CThN→L6U PV: 0%, 0 of 28 tested connections; p = 2.2863 × 10⁻⁵, Fisher’s exact test).
Figure 6.
Figure 6.. Summary Schematic Showing the Distinct Circuit Organization of L6U and L6L
L6U IL-PV INs are restricted to L6U. The probability of connection onto L6U IL-PV INs is similar for VPM-only CThNs (VPM-only L6U CThNs) and CCNs in L6U, although the CThN synapses facilitate, while the CCN synapses depress (arrowheads). Thalamocortical input from VPM is stronger to L6U than to L6L and activates L6U IL-PV INs more than either VPM-only L6U CThNs or L6U CCNs. In L6L, CCNs have twice the probability of synapsing onto local PV INs than VPM/POm L6L CThNs. Both CCNs and CThNs form depressing synapses onto these local PV INs (arrowheads). Below L6a lies a molecularly distinct set of neurons called L6b.

Similar articles

Cited by

References

    1. Adesnik H, and Naka A (2018). Cracking the function of layers in the sensory cortex. Neuron 100, 1028–1043. - PMC - PubMed
    1. Agmon A, and Connors BW (1991). Thalamocortical responses of mouse somatosensory (barrel) cortex in vitro. Neuroscience 41, 365–379. - PubMed
    1. Arzt M, Sakmann B, and Meyer HS (2018). Anatomical correlates of local, translaminar, and transcolumnar inhibition by layer 6 GABAergic interneurons in somatosensory cortex. Cereb. Cortex 28, 2763–2774. - PubMed
    1. Audette NJ, Bernhard SM, Ray A, Stewart LT, and Barth AL (2019). Rapid plasticity of higher-order thalamocortical inputs during sensory learning. Neuron 103, 277–291.e4. - PMC - PubMed
    1. Bastos AM, Usrey WM, Adams RA, Mangun GR, Fries P, and Friston KJ (2012). Canonical microcircuits for predictive coding. Neuron 76, 695–711. - PMC - PubMed

Publication types