. 2019 Nov;597(21):5265-5293.
doi: 10.1113/JP278416. Epub 2019 Oct 10.

Dynamic postnatal development of the cellular and circuit properties of striatal D1 and D2 spiny projection neurons

Affiliations

Dynamic postnatal development of the cellular and circuit properties of striatal D1 and D2 spiny projection neurons

Rohan N Krajeski et al. J Physiol. 2019 Nov.

Abstract

Key points: Imbalances in the activity of the D1-expressing direct pathway and D2-expressing indirect pathway striatal projection neurons (SPNs) are thought to contribute to many basal ganglia disorders, including early-onset neurodevelopmental disorders such as obsessive-compulsive disorder, attention deficit hyperactivity disorder and Tourette's syndrome. This study provides the first detailed quantitative investigation of development of D1 and D2 SPNs, including their cellular properties and connectivity within neural circuits, during the first postnatal weeks. This period is highly dynamic with many properties changing, but it is possible to make three main observations: many aspects of D1 and D2 SPNs progressively mature in parallel; there are notable exceptions when they diverge; and many of the defining properties of mature striatal SPNs and circuits are already established by the first and second postnatal weeks, suggesting guidance through intrinsic developmental programmes. These findings provide an experimental framework for future studies of striatal development in both health and disease.

Abstract: Many basal ganglia neurodevelopmental disorders are thought to result from imbalances in the activity of the D1-expressing direct pathway and D2-expressing indirect pathway striatal projection neurons (SPNs). Insight into these disorders is reliant on our understanding of normal D1 and D2 SPN development. Here we provide the first detailed study and quantification of the striatal cellular and circuit changes occurring for both D1 and D2 SPNs in the first postnatal weeks using in vitro whole-cell patch-clamp electrophysiology. Characterization of their intrinsic electrophysiological and morphological properties, the excitatory long-range inputs coming from cortex and thalamus, as well their local gap junction and inhibitory synaptic connections reveals this period to be highly dynamic with numerous properties changing. However it is possible to make three main observations. Firstly, many aspects of SPNs mature in parallel, including intrinsic membrane properties, increases in dendritic arbours and spine densities, general synaptic inputs and expression of specific glutamate receptors. Secondly, there are notable exceptions, including a transient stronger thalamic innervation of D2 SPNs and stronger cortical NMDA receptor-mediated inputs to D1 SPNs, both in the second postnatal week. Thirdly, many of the defining properties of mature D1 and D2 SPNs and striatal circuits are already established by the first and second postnatal weeks, including different electrophysiological properties as well as biased local inhibitory connections between SPNs, suggesting this is guided through intrinsic developmental programmes. Together these findings provide an experimental framework for future studies of D1 and D2 SPN development in health and disease.


Figures

Figure 1
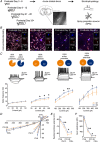
Figure 1. Maturational and intrinsic differences in electrophysiological properties of striatal D1 and D2 SPNs
A, whole‐cell patch‐clamp recordings were made from striatal spiny projection neurons (SPNs) in acute coronal brain slices of mice at four developmental stages: postnatal day (P)3–6, P9–12, P21–28 and P35 and older. B, internal recording solutions included biocytin allowing for post hoc confirmation of SPN type using immunocytochemistry for the SPN marker CTIP2 and the D2 SPN marker PPE. Recorded SPNs are indicated by asterisks. Note the example SPN at P3–6 is PPE‐negative and CTIP2‐positive, corresponding to a putative D1 SPN, whereas the SPNs for other age ranges are PPE‐positive (as indicated by crosses) and CTIP2‐positive, corresponding to putative D2 SPNs. C, hyperpolarizing and depolarizing current steps were used to characterize the electrophysiological properties of SPNs. We found that the majority of SPNs were already able to generate small action potentials from P3–6 onwards. Whereas in the first postnatal week both D1 and D2 SPNs exhibit similar action potential frequencies, at later stages in development D2 SPNs start exhibiting a significantly higher action potential frequency persisting into adulthood. D, a pronounced inward rectifying current develops as both D1 and D2 SPNs mature. E, the resting membrane potential becomes progressively more hyperpolarized as SPNs mature. Note the consistently more depolarized resting membrane potential of the D2 SPNs. F, the input resistance progressively decreases as SPNs mature. Note the consistently higher input resistance of the D2 SPNs.
Figure 2
Figure 2. Development of dendritic arbours and spines of D1 and D2 SPNs
A, example reconstructions of previously recorded SPNs processed for DAB immunohistochemistry. SPNs are grouped according to age (left to right, P3–6, P9–12, P21–28 and P35+) and whether they are D1 (orange, top) or D2 (blue, bottom) SPNs. The examples shown are all reconstructed and analysed neurons from coronal sections and are aligned such that top is dorsal, bottom is ventral, left is lateral and right is medial. B, D1 (orange) and D2 (blue) SPNs exhibit a significant and similar increase in their dendritic length as they mature C, Scholl analysis of dendritic complexity of D1 and D2 SPNs reveals a similar elaboration of distal dendritic segments as they mature. D, polarity analysis of dendrites of D1 and D2 SPNs reveals a mostly uniform and radial distribution of their dendrites. Note the bias to extend dendrites from lateral–ventral aspects to medial–dorsal aspects. E, spine density of D1 and D2 SPNs in different age ranges. Note the similar increase in spine density in both D1 and D2 SPNs as they mature.
Figure 3
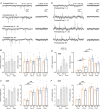
Figure 3. Characterization of mEPSCs and mIPSCs in D1 and D2 SPNs
A, mEPSCs were recorded as downward deflections from SPNs held in voltage‐clamp at a holding potential of −70 mV in the presence of TTX (1 µm). B, bar plot of mEPSC frequency showing a relatively stable mEPSC frequency across development for all recorded SPNs (left) and identified D1 (orange) and D2 (blue) SPNs (right). Note the absence of significant differences in mEPSC frequency between D1 and D2 SPNs. C, bar plot of mEPSC amplitude for all recorded SPNs showing a significant increase in amplitude between P3–6 and P9–12 (P < 0.0001, left). This increase in amplitude is seen for both the D1 and D2 SPNs (right). D, mIPSCs were recorded as upward deflections from SPNs held in voltage‐clamp at a holding potential of 0 mV in the presence of TTX (1 µm). E, bar plot of mIPSC frequency showing a steady increase across the early developmental age ranges (P3–6 to P9–12, P < 0.0001, and P9–12 to P21–28, P < 0.0001, left), which is seen for both D1 and D2 SPNs (right), after which there is a slight, but insignificant (P = 0.526), drop in frequency. F, bar plot of mIPSC amplitude showing a significant increase between P3–6 and P9–12 (P < 0.0001, left) for both D1 and D2 SPNs (right).
Figure 4
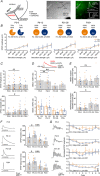
Figure 4. Development of cortical excitatory synaptic inputs onto D1 and D2 SPNs
A, diagram of the recording configuration and placement of stimulation electrode to activate cortical afferents (left). Example Dodt contrast image (middle) and fluorescence image (right) of the striatum in a D2–GFP transgenic mouse. Inset: example of an evoked cortical EPSP and EPSC. B, graphs of EPSP amplitude across a range of stimulation strengths (range 20–220 µA) for the four different age ranges. Note the similar amplitude in evoked EPSPs between the D1 (orange) and D2 (blue) SPNs. Also, note that ∼70% of SPNs exhibited a response at P3–6 and responses could always be observed at later ages. C, bar plot of the maximum evoked EPSP amplitude across the age ranges which remains relatively constant at ∼3 to 4 mV (top). Bar plot of EPSC amplitude shows an increase in the cortically evoked excitatory current (bottom), especially evident from P9–12 to P21–28. D, bar plots of the NMDA/AMPA ratio across the age ranges. Note the decrease in the ratio as the neurons mature (top), which occurs in parallel for both D1 and D2 SPNs (bottom). E, bar plots of the NMDA receptor‐mediated current (top) and AMPA/kainate receptor‐mediated current (bottom) across the age ranges. Note the significant increase in the AMPA/kainate receptor‐mediated current whereas the NMDA receptor‐mediated current stayed constant. F, bar plots of the EPSP duration and decay time. Note the transient and significant increase in the EPSP duration and decay time at P9–12. G, graphs of the EPSP amplitude across 10 stimulations at 20 Hz showing that corticostriatal synapses at D1 and D2 SPNs predominantly exhibit short‐term depression at all age ranges. D1 SPNs: orange squares; D2 SPNs: blue squares; and unclassified SPNs: grey squares.
Figure 5
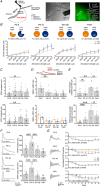
Figure 5. Rapid development of excitatory thalamic inputs onto D1 and D2 SPNs
A, diagram of the recording configuration and placement of stimulation electrode in the internal capsule to activate thalamic afferents (left). Example Dodt contrast image (middle) and fluorescence image (right) of the striatum in a D2–GFP transgenic mouse. Inset: example of an evoked thalamic EPSP and EPSC. B, graphs of EPSP amplitude across a range of stimulation strengths (range 20–220 µA) for the different age ranges. Note the comparable amplitudes of evoked EPSPs in both the D1 (orange) and D2 (blue) SPNs, except at P9–12 when the D2 SPNs transiently receive a stronger thalamic input. Note that only ∼70% of SPNs exhibited a response at P3–6 whereas they always exhibited a response at later age ranges. C, bar plot of the maximum evoked EPSP amplitudes, which progressively become larger across development (top). Bar plots of EPSC amplitudes also shows an increase in the thalamic evoked excitatory current (bottom). D, bar plots of the NMDA/AMPA ratio across the age ranges. Note the significant decrease in the ratio from P3–6 to P9–12 (top), for both D1 and D2 SPNs (bottom). E, bar plots of the NMDA receptor‐mediated currents (top) and AMPA/kainate receptor‐mediated currents (bottom). Note the significant increase in the AMPA/kainate receptor‐mediated current from P3–6 to P9–12. F, bar plots of the EPSP duration (top) and EPSP decay time. Note the transient and significantly longer EPSP duration and decay time at P9–12. G, graphs of the EPSP amplitude across 10 stimulations at 20 Hz showing that thalamic synapses at D1 and D2 SPNs predominantly exhibit short‐term depression at all age ranges. D1 SPNs: orange squares; D2 SPNs: blue squares; and unclassified SPNs: grey squares.
Figure 6
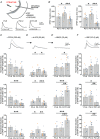
Figure 6. Changes in receptor expression at glutamatergic synapses onto striatal D1 and D2 SPNs
A, diagram of recording configuration consisting of a stimulation electrode placed in the striatum close to the recorded SPNs (top). All recordings were performed in the presence of the GABA receptor antagonists. Example traces of striatal evoked EPSPs at three different age ranges (bottom). B, bar plots of the duration (left) and decay time (right) of striatal evoked EPSPs. Note the transient and significantly longer EPSP duration and decay time at P9–12. C, example trace and bar plots of the reduction of the normalized EPSP amplitude (top), duration (middle) and decay time (bottom) after superfusion of the NMDA receptor NR2C/D subunit‐selective antagonist PPDA (200 nm). Note the dominant effect on all parameters is at P3–6. D, example trace and bar plots of the reduction of the normalized EPSP amplitude (top), duration (middle) and decay time (bottom) after further addition of the NMDA receptor antagonist d‐AP5 (50 µm) to the superfusate. Note the dominant effect on all parameters is at P9–12. E, example trace and bar plots of the reduction of the normalized EPSP amplitude (top), duration (middle) and decay time (bottom) after final addition of the AMPA/kainate receptor antagonist NBQX (20 µm) to the superfusate, which fully blocks the residual EPSP. F, example trace and bar plots of the reduction of the normalized EPSP amplitude (top), duration (middle) and decay time (bottom) after addition of the kainate receptor antagonist UBP‐310 (5 µm) to the superfusate. Note that across development UBP‐310 exhibits an increasing effect on the amplitude of the EPSP and a decreasing effect on duration and decay time.
Figure 7
Figure 7. Gradual replacement of symmetrical gap junctions with precise inhibitory synaptic connections between SPNs
A, Dodt‐contrast image of recording configuration consisting of four simultaneously patched SPNs. B, post hoc immunocytochemistry of recorded neurons using antibodies against streptavidin, PPE and CTIP2 allowed for classification of neurons as D1 or D2 SPNs. Note that SPN no. 1 is PPE negative and CTIP2 positive and therefore a D1 SPN, whereas SPN no. 2 is positive for PPE (indicated by asterisk) and therefore a D2 SPN. C, subsequently the slices were processed for DAB immunohistochemistry to label SPNs (left) and reveal dendritic structures allowing for reconstruction of SPNs (right). D, hyperpolarizing current steps revealed the presence of potential gap junctions connecting recorded SPNs. Note the presence of bidirectional gap junctions between D1 SPN no. 1 (orange) and D2 SPN no. 3 (blue). E, suprathreshold current injections elicited action potentials in recorded SPNs and revealed potential synaptic connections to other simultaneously recorded SPNs. Note the presence of a unidirectional synaptic connection from D2 SPN no. 2 to D2 SPN no. 3. F, diagram of experimental set‐up to test for potential gap junctions between SPNs (left). Bar plots showing a significant decrease in the incidence of detected gap junctions as the SPNs mature (right). G, bar plots of the incidence of gap junctions between D1 and D2 SPNs across the age ranges. Note the relatively uniform incidence of gap junctions in all SPN groups at P3–6 followed by a progressive reduction and absence of detected gap junctions at P21–28. H, diagram of experimental set‐up to test for synaptic connections between SPNs (left). Bar plots showing a progressive and significant increase in the incidence of detected synaptic connections as the SPNs mature (right). I, bar plots of incidences of synaptic connections between D1 and D2 SPNs across the age ranges. Note the earliest appearance of synaptic connections at P3–6 from D1 SPNs only. By P9–12 synaptic connections from both D1 and D2 SPNs can be observed and relative biases in synaptic connectivity, i.e. high incidence of connectivity between D2 SPN, are already apparent and are maintained.

Similar articles

Cited by

References

    1. Akerman CJ, Smyth D & Thompson ID (2002). Visual experience before eye‐opening and the development of the retinogeniculate pathway. Neuron 36, 869–879. - PubMed
    1. Albin RL (2018). Tourette syndrome: a disorder of the social decision‐making network. Brain 141, 332–347. - PMC - PubMed
    1. Arama J, Abitbol K, Goffin D, Fuchs C, Sihra TS, Thomson AM & Jovanovic JN (2015). GABAA receptor activity shapes the formation of inhibitory synapses between developing medium spiny neurons. Front Cell Neurosci 9, 290. - PMC - PubMed
    1. Arlotta P, Molyneaux BJ, Jabaudon D, Yoshida Y & Macklis JD (2008). Ctip2 controls the differentiation of medium spiny neurons and the establishment of the cellular architecture of the striatum. J Neurosci 28, 622–632. - PMC - PubMed
    1. Bagetta V, Picconi B, Marinucci S, Sgobio C, Pendolino V, Ghiglieri V, Fusco FR, Giampa C & Calabresi P (2011). Dopamine‐dependent long‐term depression is expressed in striatal spiny neurons of both direct and indirect pathways: implications for Parkinson's disease. J Neurosci 31, 12513–12522. - PMC - PubMed

Publication types

Substances