. 2019 Sep 17;10(5):e01723-19.
doi: 10.1128/mBio.01723-19.

First Days in the Life of Naive Human B Lymphocytes Infected with Epstein-Barr Virus

Affiliations

First Days in the Life of Naive Human B Lymphocytes Infected with Epstein-Barr Virus

Dagmar Pich et al. mBio. .

Abstract

Epstein-Barr virus (EBV) infects and activates resting human B lymphocytes, reprograms them, induces their proliferation, and establishes a latent infection in them. In established EBV-infected cell lines, many viral latent genes are expressed. Their roles in supporting the continuous proliferation of EBV-infected B cells in vitro are known, but their functions in the early, prelatent phase of infection have not been investigated systematically. In studies during the first 8 days of infection using derivatives of EBV with mutations in single genes of EBVs, we found only Epstein-Barr nuclear antigen 2 (EBNA2) to be essential for activating naive human B lymphocytes, inducing their growth in cell volume, driving them into rapid cell divisions, and preventing cell death in a subset of infected cells. EBNA-LP, latent membrane protein 2A (LMP2A), and the viral microRNAs have supportive, auxiliary functions, but mutants of LMP1, EBNA3A, EBNA3C, and the noncoding Epstein-Barr virus with small RNA (EBERs) had no discernible phenotype compared with wild-type EBV. B cells infected with a double mutant of EBNA3A and 3C had an unexpected proliferative advantage and did not regulate the DNA damage response (DDR) of the infected host cell in the prelatent phase. Even EBNA1, which has very critical long-term functions in maintaining and replicating the viral genomic DNA in established cell lines, was dispensable for the early activation of infected cells. Our findings document that the virus dose is a decisive parameter and indicate that EBNA2 governs the infected cells initially and implements a strictly controlled temporal program independent of other viral latent genes. It thus appears that EBNA2 is sufficient to control all requirements for clonal cellular expansion and to reprogram human B lymphocytes from energetically quiescent to activated cells.IMPORTANCE The preferred target of Epstein-Barr virus (EBV) is human resting B lymphocytes. We found that their infection induces a well-coordinated, time-driven program that starts with a substantial increase in cell volume, followed by cellular DNA synthesis after 3 days and subsequent rapid rounds of cell divisions on the next day accompanied by some DNA replication stress (DRS). Two to 3 days later, the cells decelerate and turn into stably proliferating lymphoblast cell lines. With the aid of 16 different recombinant EBV strains, we investigated the individual contributions of EBV's multiple latent genes during early B-cell infection and found that many do not exert a detectable phenotype or contribute little to EBV's prelatent phase. The exception is EBNA2 that is essential in governing all aspects of B-cell reprogramming. EBV relies on EBNA2 to turn the infected B lymphocytes into proliferating lymphoblasts preparing the infected host cell for the ensuing stable, latent phase of viral infection. In the early steps of B-cell reprogramming, viral latent genes other than EBNA2 are dispensable, but some, EBNA-LP, for example, support the viral program and presumably stabilize the infected cells once viral latency is established.

Keywords: B lymphocytes; human herpesviruses; reprogramming; transformation.


Figures

FIG 1
FIG 1
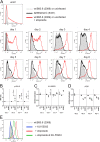
Evaluation of parameters and conditions supporting EBV infection of naive B lymphocytes. (A) Primary naive B lymphocytes were sorted and infected with wt/B95.8 (2089) EBV using the indicated multiplicities of infection (MOI). The number of proliferating, growth-transformed B cells was recorded by flow cytometry daily, as described in Materials and Methods and in Fig. 2A of our recent publication (26). Two experiments with B cells from two different donors are shown. (B) Annexin V binding of infected B lymphocytes from the two donors analyzed in panel A is provided. (C) The fraction of EBNA2-positive cells in B cells on days 1, 3, and 5 p.i. is shown as a function of MOI. (D) The ratio of lymphoblasts versus lymphocytes, as determined by forward- and side-scatter flow cytometry analysis was calculated with B cells infected with wt/B95.8 (2089) and different MOIs as indicated on days 1, 3, and 5 p.i. The horizontal dashed red line indicates a 1:1 ratio, and the orange line indicates a 9:1 ratio of lymphoblasts versus lymphocytes. Panels A and B show the results from two representative experiments out of three, and panels C and D show the results from one representative experiment out of three.
FIG 2
FIG 2
Cell volume of naive B lymphocytes infected with EBV. FACS-sorted naive B lymphocytes from adenoid tissue were left uninfected or were infected with wt/B95.8 (2089) EBV with an MOI of 0.1 and cultivated for the indicated days. After Ficoll gradient centrifugation, microscopic images of the samples were recorded with a Tali image-based cytometer (Thermo Fisher) and analyzed for their cellularity and the cells’ diameters, which were determined with the aid of calibration beads, as described in Materials and Methods. Based on the cell diameter, the mean volume of at least 200 cells per time point was calculated, assuming perfect spheres.
FIG 3
FIG 3
Activation kinetics of naive B lymphocytes infected with four different recombinant wild-type EBV strains. Sorted naive B lymphocytes isolated from adenoid tissue were loaded with an intracellular dye (cell trace violet [CTV]; Thermo Fisher Scientific). The cells were infected with the four indicated EBV strains with an MOI of 0.1. The strains are wild type with respect to EBV’s latent genes but have different genotypes, as specified in Table 1. (A) The kinetics of cell division of the infected cells were analyzed by flow cytometry, and the resulting division index (DI) was calculated and plotted. DI indicates the average number of cell divisions a cell in the starting populations has undergone, including the peak of undivided cells. (B) Cells were incubated with 5-bromo-2′-deoxyuridine (BrdU) for 1 h prior to harvest and analyzed by flow cytometry after staining with a BrdU specific antibody. The percentage of cells in the different phases of the cell cycle were calculated. (C) Cell numbers of viable cells were analyzed by flow cytometry as described in reference and plotted. The initial cell numbers in this experiment were 2 × 105 per well, as indicated. (D) Annexin V binding of infected cells was analyzed by flow cytometry. The results from one representative experiment out of three experiments with B lymphocytes from three individual donors are shown.
FIG 4
FIG 4
Activation kinetics of naive B lymphocytes cultivated on CD40L feeder cells in the presence of IL-4. As in Fig. 3, naive B lymphocytes isolated from adenoid tissue were loaded with an intracellular dye and cultivated on CD40L feeder cells with IL-4, as described previously (39). (A) Division index is shown. (B) Cell cycle distributions of cultivated cells are provided. (C) Viable cells were counted by flow cytometry. (D) Binding of annexin V was analyzed by flow cytometry. Shown are the results from one representative experiment out of three with B lymphocytes from three different B-cell donors.
FIG 5
FIG 5
Activation kinetics of naive B lymphocytes infected with mutant EBVs negative for EBNA-LP or EBNA2. As in Fig. 3, sorted naive B lymphocytes were loaded with an intracellular dye and infected with the indicated viruses, which are wild type with respect to viral latent genes [wt/B95.8 (2089) and wt/B95.8 (5750)] or are incapable of expressing EBNA2 [ΔEBNA2 (5968)] or EBNA-LP [ΔEBNA-LP (5969)]. (A) Division index is shown. (B) Cell cycle distributions of cultivated cells are provided. (C) Viable cells were counted by flow cytometry. (D) Binding of annexin V was analyzed by flow cytometry. The results from one representative experiment out of five experiments with B lymphocytes from individual donors are shown.
FIG 6
FIG 6
Activation kinetics of naive B lymphocytes infected with an EBV strain lacking all viral miRNAs. As in Fig. 3, sorted naive B lymphocytes were loaded with an intracellular dye and infected with wild-type wt/B95.8 (2089) EBV or ΔmiR (4027) mutant negative for EBV’s miRNAs (42). (A) Division index is shown. (B) Cell cycle distributions of cultivated cells are provided. (C) Viable cells were counted by flow cytometry. (D) Binding of annexin V was analyzed by flow cytometry. The results from one representative experiment out of five experiments with B lymphocytes from five individual donors are shown.
FIG 7
FIG 7
Activation kinetics of naive B lymphocytes infected with an LMP1-negative or LMP2A-negative EBV strain. As in Fig. 3, sorted naive B lymphocytes were loaded with an intracellular dye and infected with the wild-type wt/B95.8 (2089) EBV strain or with ΔLMP1 (2597) mutant EBV, which carries a knockout of EBV’s latent membrane protein 1 [LMP1] (14) or with a ΔLMP2A (2525) mutant EBV with a deletion of the first exon of LMP2A (97). (A) Division index is shown. (B) Cell cycle distributions of cultivated cells are provided. (C) Viable cells were counted by flow cytometry. (D) Binding of annexin V was analyzed by flow cytometry. The results from one representative experiment out of three experiments with B lymphocytes from three individual donors are shown.
FIG 8
FIG 8
Activation kinetics of naive B lymphocytes infected with EBV strains incapable of expressing EBNA3A, EBNA3C, or both EBNA3 family members. As in Fig. 3, sorted naive B lymphocytes were loaded with an intracellular dye and infected with a wild-type strain [wt/B95.8 (2089)] or three EBV strains deficient in EBNA3A, EBNA3B, or both, as indicated (Table 1). (A) Division index is shown. (B) Cell cycle distributions of cultivated cells are provided. (C) Viable cells were counted by flow cytometry. (D) Binding of annexin V was analyzed by flow cytometry. The results from one representative experiment out of three experiments with B lymphocytes from three individual donors are shown.
FIG 9
FIG 9
γ-H2A.X levels in uninfected B lymphocytes and cells infected with wild-type EBV or an EBNA3A/3C double-knockout EBV with ATM and ATR inhibitors. (A) FACS-sorted naive B lymphocytes were infected with wt/B95.8 (2089) EBV or ΔEBNA3A/C (6331) mutant EBV with an MOI of 0.1 and analyzed at different time points, as indicated. Intracellular staining detected the levels of the phosphorylated histone variant H2A.X (γ-H2A.X) in viable cells (according to scatter criteria by flow cytometry). As a positive control, uninfected B lymphocytes or cells infected with wt/B95.8 (2089) EBV were treated with 85 μM etoposide for 1 h prior to harvest (red line). The results from one representative experiment out of three with B lymphocytes from three individual donors are shown. (B) FACS-sorted naive B lymphocytes were infected with B95.8 EBV with an MOI of 0.1. The cells were pulse labeled with EdU (5-ethynyl-2′-deoxyuridine, a nucleoside analog to thymidine incorporated into DNA during active DNA synthesis) for 1 h, fixed, permeabilized, and frozen at –80°C at the indicated time points. For flow cytometry analysis, the cells were thawed and analyzed after intracellular staining with an antibody directed against γ-H2A.X and a click reaction between EdU and Alexa Fluor 488. Single viable cells were considered by gating, and the mean fluorescence intensity (MFI) values of the fluorochrome-coupled γ-H2A.X specific antibody were separately recorded in the cell cycle fractions G1, S, and G2/M. MFI values of the S and G2/M fractions were compared with the MFI values of G1 cells and expressed as ratios of S versus G1 or G2/M versus G1 MFI levels. The MFI levels of γ-H2A.X fluorescence in G1 were set to 1.0. On days 3 to 5, cells in S and G2/M had 2- to 3-fold higher γ-H2A.X levels compared to those with cells in G1. Cells infected for 2 days do not cycle or synthesize DNA. The results from three independent experiments are summarized. (C) B95.8-infected B lymphocytes were incubated with EdU together with the ATM inhibitor KU-55933 or were incubated with EdU only for 1 h prior to harvest, as in panel B. Shown are the MFI ratios of γ-H2A.X levels in the different cell cycle fractions of KU-55933-treated versus untreated cells. KU-55933 showed a slight inhibitory effect on day 3 p.i. in S-phase cells, but other γ-H2A.X levels were not reduced but sometimes even elevated when KU-55933 was applied. The results from three independent experiments are summarized. (D) The experimental setup is identical to that in panel C except that the ATR inhibitor AZ20 was applied for 1 h together with EdU. Cells in S and G2/M phase but not cells in G1 phase showed a clear reduction in γ-H2A.X levels in the presence of AZ20 on days 3, 4, and 5 p.i. The results from three independent experiments are summarized. (E) The histogram demonstrates the inhibitory effect of the inhibitor KU-55933 on an etoposide-induced DDR. B lymphocytes were infected with wt/B95.8 (2089) EBV for 5 days and treated with KU-55933 for 1 h prior to analysis with the γ-H2A.X specific antibody by intracellular flow cytometry (red line in the histogram). Concomitant addition of the ATM inhibitor KU-55933 for 1 h together with etoposide reduced the induced levels of γ-H2A.X considerably (green), whereas the addition of KU-55933 alone (blue) had no effect on cells that were not treated with etoposide (gray-shaded histogram).
FIG 10
FIG 10
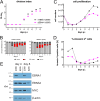
Activation kinetics of naive B lymphocytes infected with an EBV strain lacking EBNA1. As in Fig. 3, sorted naive B lymphocytes were loaded with an intracellular dye and infected with wild-type wt/B95.8 (2089) EBV or the ΔEBNA1 (6285) mutant, which cannot express EBNA1 due to a point mutation in EBNA1’s translational start codon. (A) Division index is shown. (B) Cell cycle distributions of cultivated cells are provided. (C) Viable cells were counted by flow cytometry. (D) Binding of annexin V was analyzed by flow cytometry. (E) Steady-state protein levels of B cells infected with wtB95.8 (2089) or ΔEBNA1 (6285) mutant EBV for 4 or 8 days were analyzed by Western blotting immunodetection with antibodies directed against EBNA1, EBNA2, MYC, or β-actin. The results from one representative experiment out of five are shown.
FIG 11
FIG 11
A vector approach identifies EBNA2 as an essential viral gene in EBV’s prelatent phase. Naive primary B lymphocytes were infected for 6 days with vector stocks obtained by packaging the plasmids p554 and p613 (5) into EBV-based viral particles (54). Noninfected B lymphocytes and cells infected with an MOI of 0.1 of wt/B95.8 (2089) virus stock served as negative and positive controls, respectively. (A) Annexin V binding and (B) TMRE staining of active mitochondria indicated apoptotic and metabolically active cells, respectively. (C) BrdU incorporation revealed cycling cells in S phase. The results from one representative experiment out of three are shown. p554 encodes EBNA2, EBNA-LP, BHRF1, and BHLF1, whereas p613 lacks EBNA2.
FIG 12
FIG 12
Transcriptional regulation of EBNA2 and selected cellular genes involved in DNA damage response or DNA replication stress. Primary naive B lymphocytes were isolated and infected with wt/B95.8 (2089) EBV. The transcriptomes of uninfected and infected B cells were investigated by RNA sequencing (RNA-seq) technologies at the indicated time points, as described previously (27). (A) EBNA2 and MYC appear to be coregulated. (B) The transcriptional regulation of the ATM-Chek1 (Chk1) and ATR-Chek2 (Chk2) pathways, which are activated by DNA double-strand breaks and single-stranded DNA, respectively, is shown. (C and D) The transcriptional regulation of components of the MRN complex and genes involved in double-strand break (C) and single-strand DNA break and repair (D) are shown. The data were obtained from our recent work (27) and are freely accessible online (http://ebv-b.helmholtz-muenchen.de/).

Similar articles

Cited by

References

    1. Epstein MA, Achong BG, Barr YM. 1964. Virus particles in cultured lymphoblasts from Burkitt’s lymphoma. Lancet i:702–703. doi:10.1016/S0140-6736(64)91524-7. - DOI - PubMed
    1. Henle W, Diehl V, Kohn G, Zur Hausen H, Henle G. 1967. Herpes-type virus and chromosome marker in normal leukocytes after growth with irradiated Burkitt cells. Science 157:1064–1065. doi:10.1126/science.157.3792.1064. - DOI - PubMed
    1. Pope JH. 1967. Establishment of cell lines from peripheral leucocytes in infectious mononucleosis. Nature 216:810–811. doi:10.1038/216810a0. - DOI - PubMed
    1. Pope JH, Horne MK, Scott W. 1968. Transformation of foetal human keukocytes in vitro by filtrates of a human leukaemic cell line containing herpes-like virus. Int J Cancer 3:857–866. doi:10.1002/ijc.2910030619. - DOI - PubMed
    1. Hammerschmidt W, Sugden B. 1989. Genetic analysis of immortalizing functions of Epstein-Barr virus in human B lymphocytes. Nature 340:393–397. doi:10.1038/340393a0. - DOI - PubMed

Publication types

LinkOut - more resources