. 2019 Sep 13;10(1):4190.
doi: 10.1038/s41467-019-12164-y.

Distinct initiating events underpin the immune and metabolic heterogeneity of KRAS-mutant lung adenocarcinoma

Affiliations

Distinct initiating events underpin the immune and metabolic heterogeneity of KRAS-mutant lung adenocarcinoma

Sarah A Best et al. Nat Commun. .

Abstract

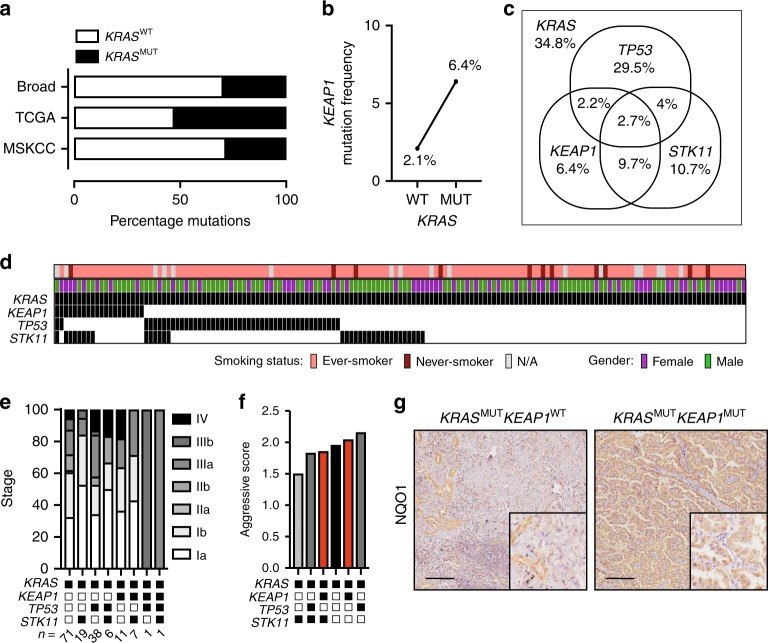
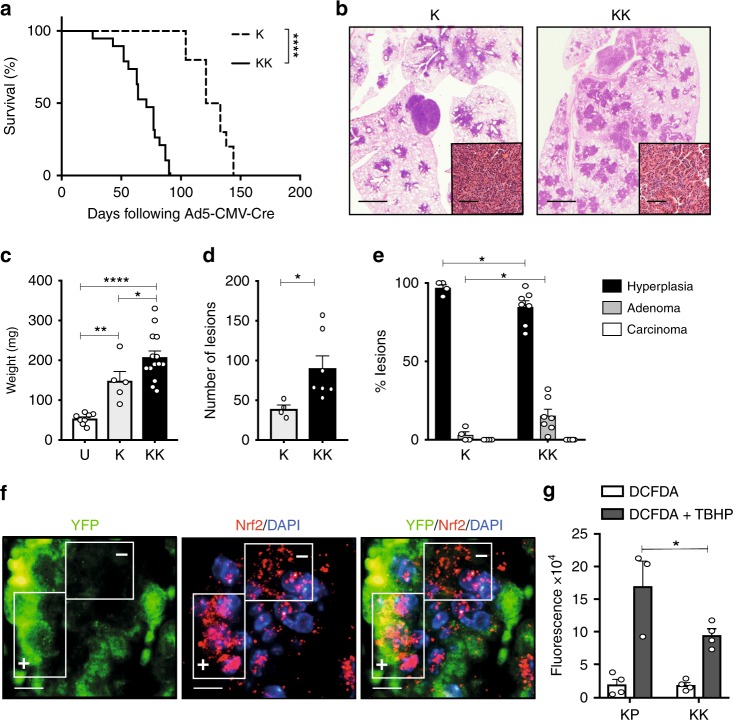
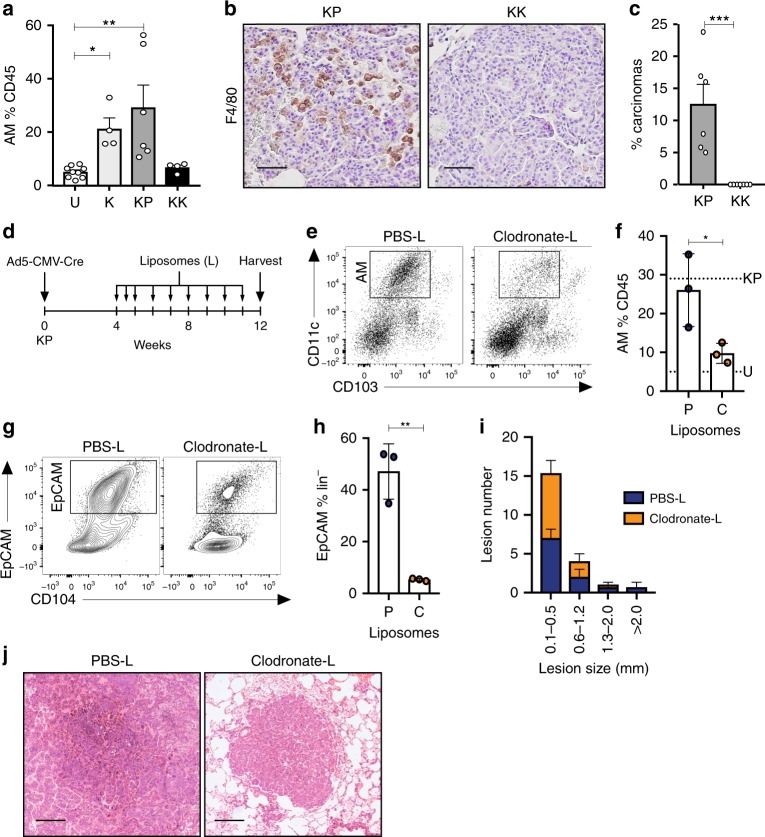
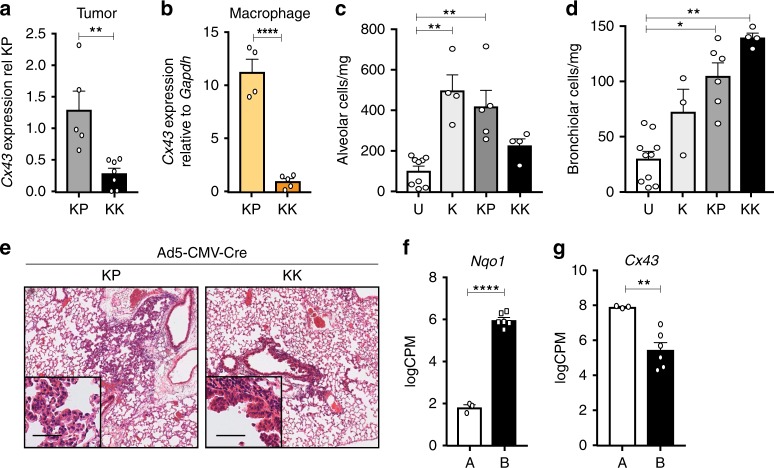
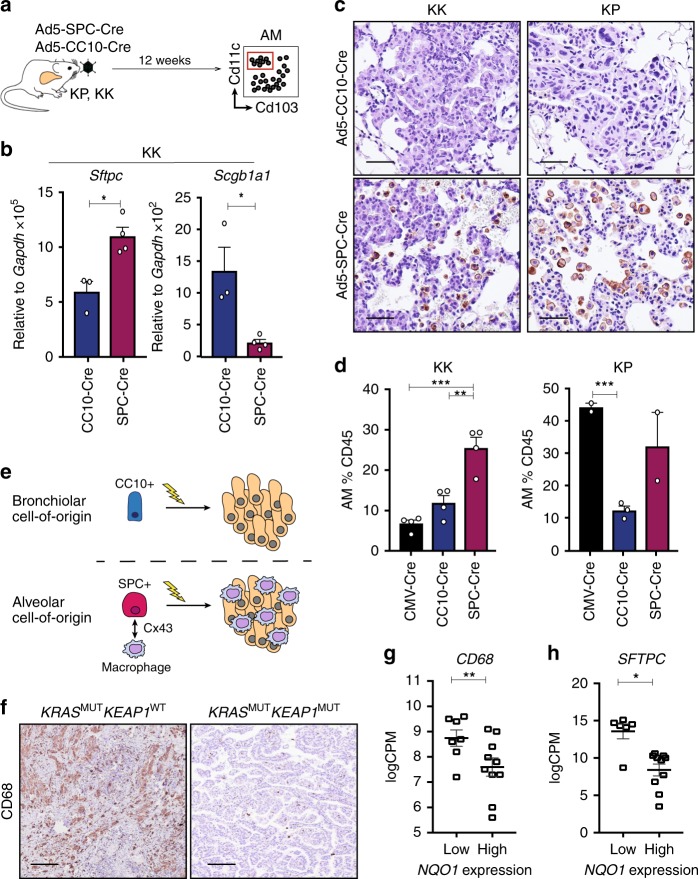
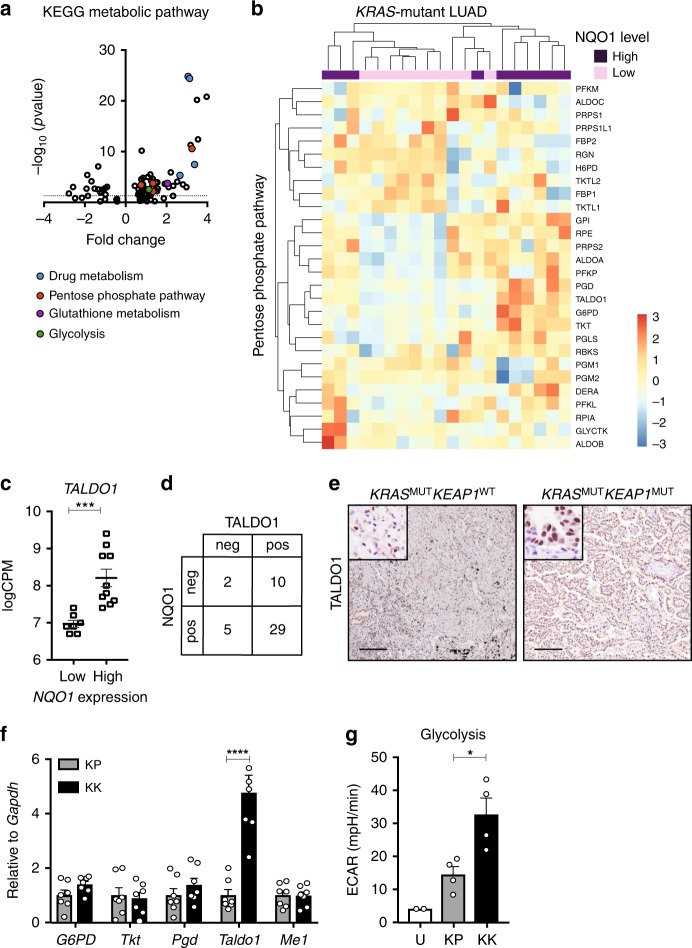
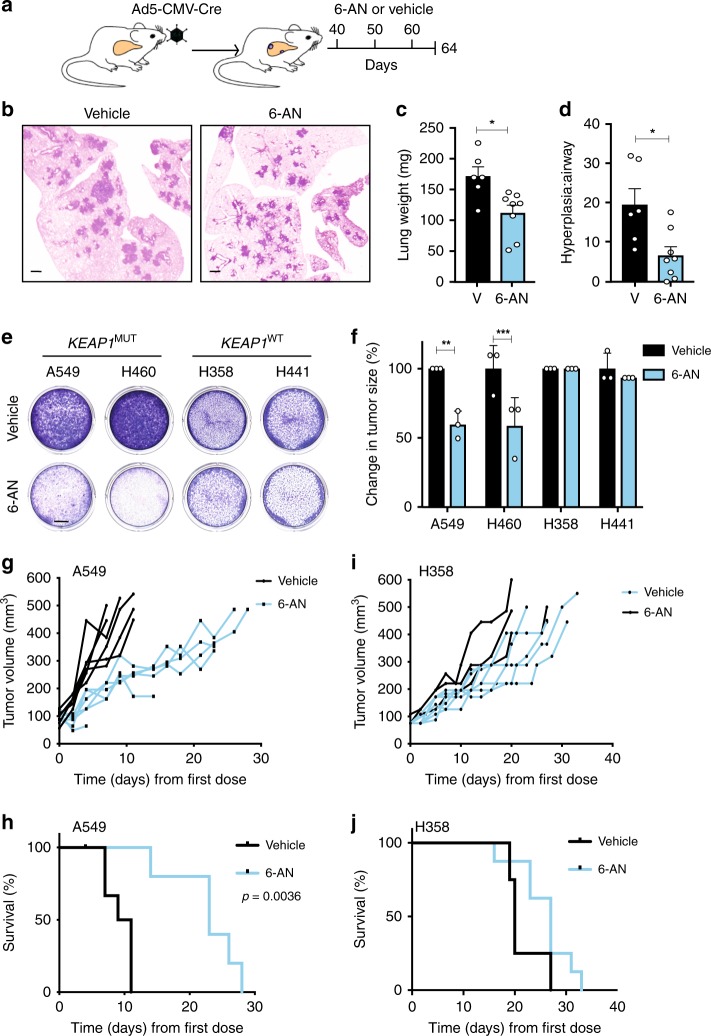
The KRAS oncoprotein, a critical driver in 33% of lung adenocarcinoma (LUAD), has remained an elusive clinical target due to its perceived undruggable nature. The identification of dependencies borne through common co-occurring mutations are sought to more effectively target KRAS-mutant lung cancer. Approximately 20% of KRAS-mutant LUAD carry loss-of-function mutations in KEAP1, a negative regulator of the antioxidant response transcription factor NFE2L2/NRF2. We demonstrate that Keap1-deficient KrasG12D lung tumors arise from a bronchiolar cell-of-origin, lacking pro-tumorigenic macrophages observed in tumors originating from alveolar cells. Keap1 loss activates the pentose phosphate pathway, inhibition of which, using 6-AN, abrogated tumor growth. These studies highlight alternative therapeutic approaches to specifically target this unique subset of KRAS-mutant LUAD cancers.


Conflict of interest statement

The authors declare no competing interests.

Figures

Fig. 1
Fig. 1
KEAP1 mutation is enriched in KRAS-mutant lung adenocarcinoma. a Frequency of KRAS mutation in lung adenocarcinoma (LUAD) obtained from the Broad Institute (n = 182), The Cancer Genome Atlas (n = 313) and the Memorial Sloan Kettering Cancer Center (MSKCC) (n = 864). b Frequency of KEAP1 mutation status in KRAS WT (wild type; n = 921) or MUT (mutant; n = 627) LUAD samples. c Venn Diagram of co-mutation/mutual exclusivity of KEAP1, TP53, and STK11 mutations in the subset of KRAS-mutant LUAD (n = 627). d KEAP1, TP53, and STK11 mutation status in KRAS-mutant LUAD patient samples from the Clinical Lung Cancer Genome Project (CLCGP) cohort (n = 155). e Frequency of clinical stage in subsets of KRAS-mutant LUAD from (d). f Aggressive score assessed by clinical stage in each KRAS-mutant subgroup. g NQO1 immunostaining on KRASMUTKEAP1WTTP53MUT and KRASMUTKEAP1MUTTP53WT patient samples. Scale, 200 μm
Fig. 2
Fig. 2
Keap1 inactivation accelerates KrasG12D-induced lung adenocarcinoma. a Survival analysis of K (n = 10) and KK (n = 19) mice following Ad5-CMV-Cre administration. Mantel-Cox test: ****p < 0.0001. b Hematoxylin and eosin (H&E) stained lungs of representative K and KK mice at ethical endpoint. Scale, 1 mm; inset, 100 μm. c Weight of left lung lobe of uninfected littermates (U, n = 8), K (n = 5) and KK (n = 14) mice 3 months following Ad5-CMV-Cre infection. Ordinary one-way ANOVA/Holm-Sidak’s multiple comparisons test: U v K: **p = 0.006; U v KK: ****p < 0.0001; K v KK: *p = 0.0327. Mean ± SEM. d Number of lesions in the lungs of K (n = 4) and KK (n = 7) mice 3 months post Ad5-CMV-Cre. Ordinary one-way ANOVA/Tukey’s multiple comparisons test K v KK *p = 0.0397. Mean ± SEM. e Lesion classification of K (n = 4) and KK (n = 7) lungs 3 months post Ad5-CMV-Cre infection. Two-way ANOVA/Tukey’s multiple comparisons test: alveolar hyperplasia K v KK *p = 0.05, adenoma K v KK *p = 0.05. Mean ± SEM. f Immunofluorescence of EYFP and Nrf2 expression in EYFPT/+;KrasG12D/+;Keap1Δ/Δ three months following Ad5-CMV-Cre infection. Boxes represent EYFP positive and negative regions. Scale, 10 μm. g Quantification of 2,7-dichlorofluorescin diacetate (DCFDA) alone or in combination with 110 μM tert-butyl hydrogen peroxide (TBHP) to stimulate reactive oxygen species (ROS) in primary cell lines (n = 4 KP and KK). Mann–Whitney test DCFDA + TBHP KP v KK *p = 0.0286. Mean ± SEM
Fig. 3
Fig. 3
Alveolar macrophages contribute to KrasG12D-induced tumorigenesis. a Quantification of alveolar macrophages (CD11c+CD11bCD103) in CD45+ immune lung infiltrate in uninfected (U; n = 9) and K (n = 4), KP (n = 6), KK (n = 4) mice 3 months post Ad5-CMV-Cre infection. Kruskal–Wallis test/Dunn’s multiple comparisons test U v K *p = 0.0127; U v KP **p = 0.0042. Mean ± SEM. b F4/80 immunostaining on KP and KK lung tissue 3 months post Ad5-CMV-Cre infection. Scale, 50 μm. c Frequency of carcinomatous lesions in KP (n = 6) and KK (n = 7) lungs 3 months post Ad5-CMV-Cre infection. Unpaired t test ***p = 0.001. Mean ± SEM. d Schematic of treatment plan. Briefly, KP mice were administered weekly PBS-liposomes or Clodronate-liposomes four weeks following Ad5-CMV-Cre infection. Lungs were harvested and analyzed for alveolar macrophages and tumor burden following 8 weeks of liposome treatment. e Representative flow cytometry plot of alveolar macrophage population (CD45+CD11c+CD103) in the lungs of PBS- or Clodronate-liposome (L) treated mice. f Quantification of alveolar macrophages as a proportion of CD45+ cells in the lungs of KP mice treated with PBS (P; n = 3) or Clodronate (C; n = 3) liposomes. Dotted line represents mean value of alveolar macrophages in KP and U from (a), above. Unpaired t test *p = 0.0443. Mean ± SD. g Representative flow cytometry plot of epithelial cells (EpCAM+) in the lungs of PBS or Clodronate liposome treated mice. h Quantification of EpCAM+ population as a proportion of lineage negative (CD31CD45) cells. Unpaired t test **p = 0.0025. Mean ± SD. i Quantification of lesion size in PBS- and Clodronate-liposome (L) treated mice. j Representative H&E of PBS- and Clodronate-liposome (L) treated mice. Scale, 200 μm
Fig. 4
Fig. 4
Keap1 loss preferentially transforms bronchiolar cells. a Expression of Cx43 in KP (n = 5) and KK (n = 7) tumor pieces, relative to KP. Mann–Whitney test **p = 0.0025. Mean ± SEM. b Expression of Connexin-43 (Cx43) in alveolar macrophages isolated from KP (n = 4) and KK (n = 5) tumor-bearing lungs, relative to Gapdh control. Unpaired student t test ****p < 0.0001. Mean ± SEM. c Quantification of alveolar (EpCAM+CD104) compartment in uninfected (U; n = 9) and K (n = 4), KP (n = 4) and KK (n = 5) 3 months post Ad5-CMV-Cre administration. Kruskal–Wallis test/Dunn’s multiple comparisons test, U v K **p = 0.0034, U v KP **p = 0.0095. Mean ± SEM. d Quantification of bronchiolar (EpCAM+CD104+) compartment in uninfected (U; n = 9) and K (n = 3), KP (n = 4) and KK (n = 6) 3 months post Ad5-CMV-Cre administration. Kruskal–Wallis test/Dunn’s multiple comparisons test, U v KK **p = 0.0014, U v KP *p = 0.0308. Mean ± SEM. e Representative H&E stained KP and KK lungs 3 weeks post Ad5-CMV-Cre infection. Scale, 200 μm; inset, 50 μm. f Expression of Nqo1 in alveolar (A) and bronchiolar (B) cells (n = 3). ****FDR p < 0.0001. Mean ± SEM. g Expression of Cx43 mRNA in alveolar (A) and bronchiolar (B) cells (n = 3). **FDR p = 0.0055. Mean ± SEM
Fig. 5
Fig. 5
Cell-of-origin determines the alveolar macrophage composition in LUAD. a Schematic of cell type-specific Ad5-Cre experimental design. b Expression of Sftpc and Scgb1a1 in KK lung tumor pieces 3 months following administration of Ad5-CC10-Cre (n = 3) or Ad5-SPC-Cre (n = 4). Unpaired t test, Sftpc *p = 0.0168; Scgb1a1 *p = 0.0107. Mean ± SEM. c F4/80 immunostaining on lung tissue from KK and KP mice infected with Ad5-CC10-Cre or Ad5-SPC-Cre. Scale, 50 μm. d Quantification of alveolar macrophages in CD45+ immune lung infiltrate of Ad5-CMV-Cre infected KK (n = 4) and KP (n = 4), Ad5-CC10-Cre infected KK (n = 4) and KP (n = 2) and Ad5-SPC-Cre infected KK (n = 4) and KP (n = 3) mice. KK, ordinary one-way ANOVA/Holm-Sidak’s multiple comparisons test CMV-Cre v SPC-Cre ***p = 0.0002, SPC-Cre v CC10-Cre **p = 0.0016. KP, unpaired t test CMV-Cre v CC10-Cre ***p = 0.0006. Mean ± SEM. e Schematic of cell-of-origin hypothesis and enhanced macrophage number in lung tumors arising from alveolar epithelial cells. Lightning bolt depicts genetic alterations. f Immunostaining of CD68 on KRASMUTKEAP1WT and KRASMUTKEAP1MUT LUAD. Scale, 200 μm. g Analysis of CD68 expression in NQO1low (n = 7) and NQO1high (n = 10) KRAS-mutant LUAD TCGA patient samples. **FDR p = 0.0012. Mean ± SEM. h Analysis of SFTPC expression in NQO1low (n = 7) and NQO1high (n = 10) KRAS-mutant LUAD TCGA patient samples. **FDR p = 0.0108. Mean ± SEM
Fig. 6
Fig. 6
Enhanced glucose metabolism in Keap1-mutant KrasG12D LUAD. a Volcano plot of top KEGG metabolic pathways differentially expressed in NQO1low (n = 10) and NQO1high (n = 10) KRAS-mutant LUAD from the TCGA dataset. Pathways involved in drug metabolism, pentose phosphate pathway, glutathione metabolism, and glycolysis have been highlighted. Dotted line represents p = 0.05. b Heatmap of KEGG pentose phosphate pathway in NQO1low (n = 10) and NQO1high (n = 10) KRAS-mutant LUAD from the TCGA dataset. c Analysis of TALDO1 expression in NQO1low (n = 7) and NQO1high (n = 10) KRAS-mutant LUAD TCGA patient samples. ***FDR p = 0.0006. Mean ± SEM. d Correlation of TALDO1 and NQO1 immunostaining in KRAS-mutant LUAD (n = 46). e TALDO1 immunostaining on KRASMUTKEAP1WT and KRASMUTKEAP1MUT patient samples. Scale, 200 μm; inset, 50 μm. f Expression of glycolytic enzyme (G6PD), pentose phosphate pathway enzymes (Tkt, Pgd, Taldo1) and malic enzyme (Me1) in tumor pieces from KP (n = 7) and KK (n = 7) lungs. Expression relative to Gapdh housekeeper control and quantified relative to KP expression. Two-way ANOVA/Sidak’s multiple comparisons test Taldo1 KP v KK ****p < 0.0001. Mean ± SEM. g Rate of glycolysis measured by extracellular acidification rate (ECAR) of uninfected lung epithelium (U; n = 2 experiments, n = 6 mice per experiment) and KP (n = 4) as well as KK (n = 4) flow cytometry isolated tumor cells 3 months following Ad5-CMV-Cre infection. Ordinary one-way ANOVA/Holm-Sidak’s multiple comparisons test, KP v KK *p = 0.0198. Mean ± SEM
Fig. 7
Fig. 7
PPP blockade abrogates the growth of KEAP1-mutant LUAD. a Schematic of spontaneous tumor treatment study. Briefly, KK or KP mice were randomized into 20 mg/kg 6-AN or vehicle treated 40 days post Ad5-CMV-Cre intranasal infection. Lungs were harvested for analysis on day 64. b Representative H&E images of KK vehicle or 6-AN-treated lungs. Scale, 1 mm. c Quantification of KK superior lobe lung weight (milligrams, mg) following vehicle (n = 6) or 6-AN (n = 8) treatment. Unpaired t test *p = 0.0106. Mean ± SEM. d Ratio of KK hyperplasia relative to large airway size in vehicle (n = 6) and 6-AN (n = 8) treated lungs. Unpaired t test *p = 0.0116. Mean ± SEM. e Colony assay 72 h following treatment with 62.5 μM 6-AN vs vehicle in KEAP1MUT and KEAP1WT NSCLC cell lines. Scale, 5 mm. f Relative change in tumor size of xenograft models (n = 3/cell line) of KEAP1MUT and KEAP1WT 48 h following treatment with 20 mg/kg 6-AN or vehicle. Change in size relative to vehicle of each cell line. Two-way ANOVA/Sidak’s multiple comparisons test: A549 **p = 0.0012; H460 ***p = 0.001. Mean ± SD. g Tumor measurements of A549 cell line xenograft following treatment with 20 mg/kg 6-AN (n = 6) or vehicle (n = 6) every 10 days. Survival log-rank (Mantel-Cox) test **p = 0.0023. h Kaplan–Meier survival curve of A549 xenograft NSG mice treated with 20 mg/kg 6-AN (n = 6) or vehicle (n = 6) every 10 days. Mantel–Cox test **p = 0.0017. i Tumor measurements of H358 xenograft following treatment with 20 mg/kg 6-AN (n = 8) or vehicle (n = 4) every 10 days. j Kaplan–Meier survival curve of H358 xenograft NSG mice treated with 20 mg/kg 6-AN (n = 8) or vehicle (n = 4) every 10 days

Similar articles

Cited by

References

    1. Prior IA, Lewis PD, Mattos C. A comprehensive survey of Ras mutations in cancer. Cancer Res. 2012;72:2457–2467. doi: 10.1158/0008-5472.CAN-11-2612. - DOI - PMC - PubMed
    1. Quinlan MP, Settleman J. Isoform-specific ras functions in development and cancer. Future Oncol. 2009;5:105–116. doi: 10.2217/14796694.5.1.105. - DOI - PubMed
    1. Papke B, Der CJ. Drugging RAS: know the enemy. Science. 2017;355:1158–1163. doi: 10.1126/science.aam7622. - DOI - PubMed
    1. Cancer Genome Atlas Research, N. Comprehensive molecular profiling of lung adenocarcinoma. Nature. 2014;511:543–550. doi: 10.1038/nature13385. - DOI - PMC - PubMed
    1. Jackson EL, et al. Analysis of lung tumor initiation and progression using conditional expression of oncogenic K-ras. Genes Dev. 2001;15:3243–3248. doi: 10.1101/gad.943001. - DOI - PMC - PubMed

Publication types

MeSH terms

Substances