

Tracing the first hematopoietic stem cell generation in human embryo by single-cell RNA sequencing
- PMID: 31501518
- PMCID: PMC6888893
- DOI: 10.1038/s41422-019-0228-6
Tracing the first hematopoietic stem cell generation in human embryo by single-cell RNA sequencing
Abstract
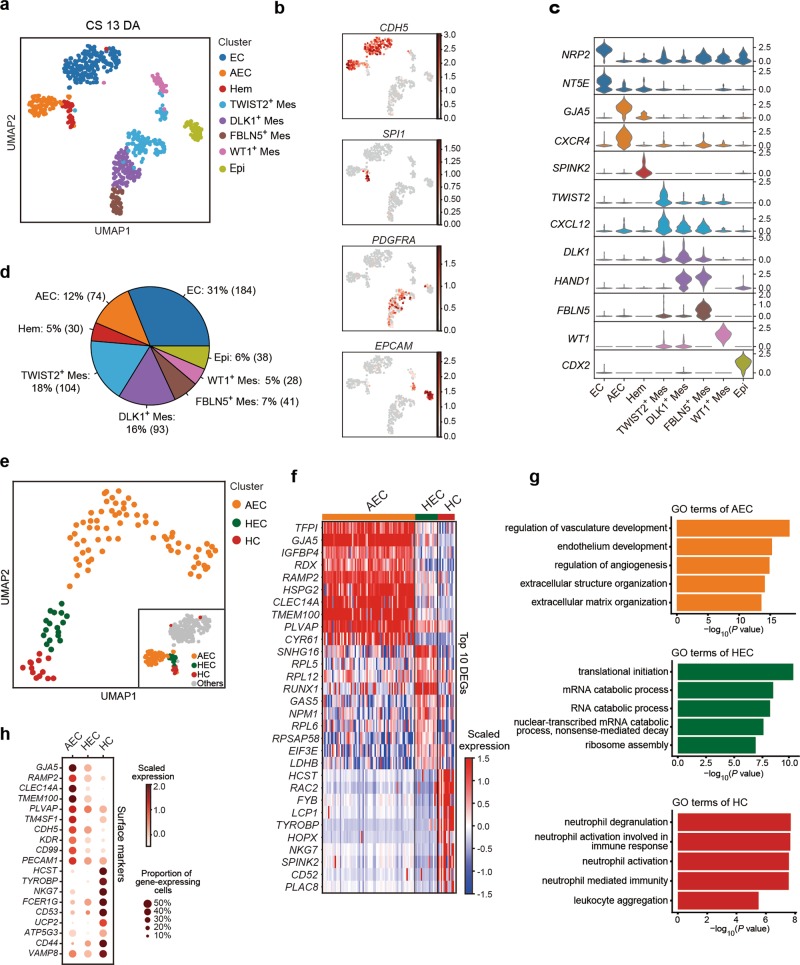
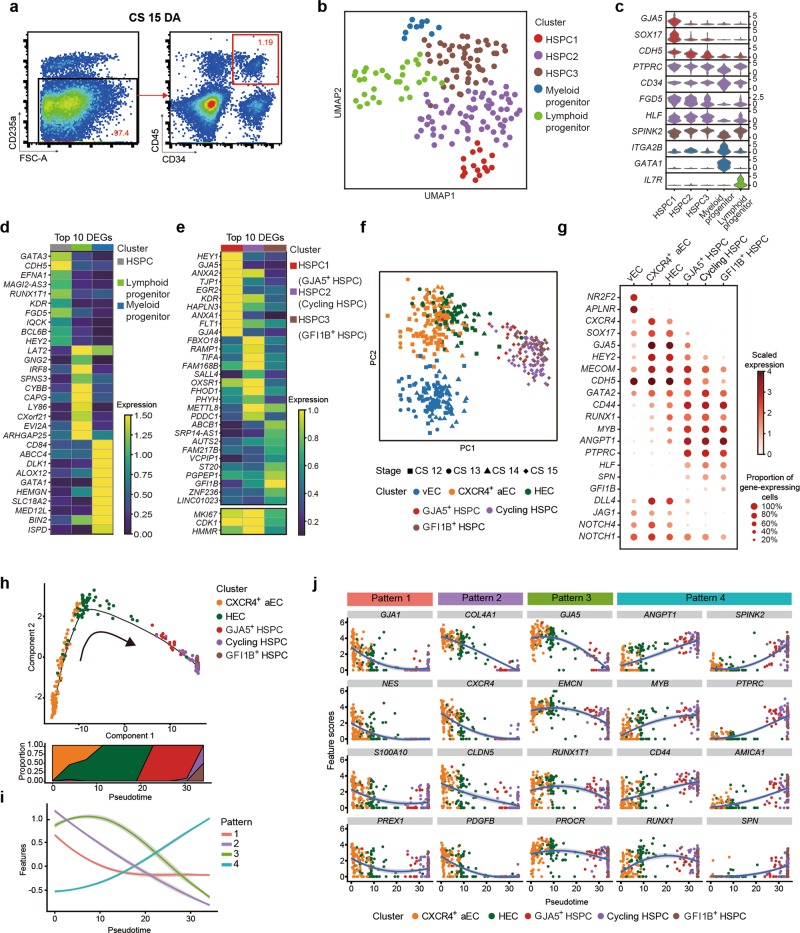
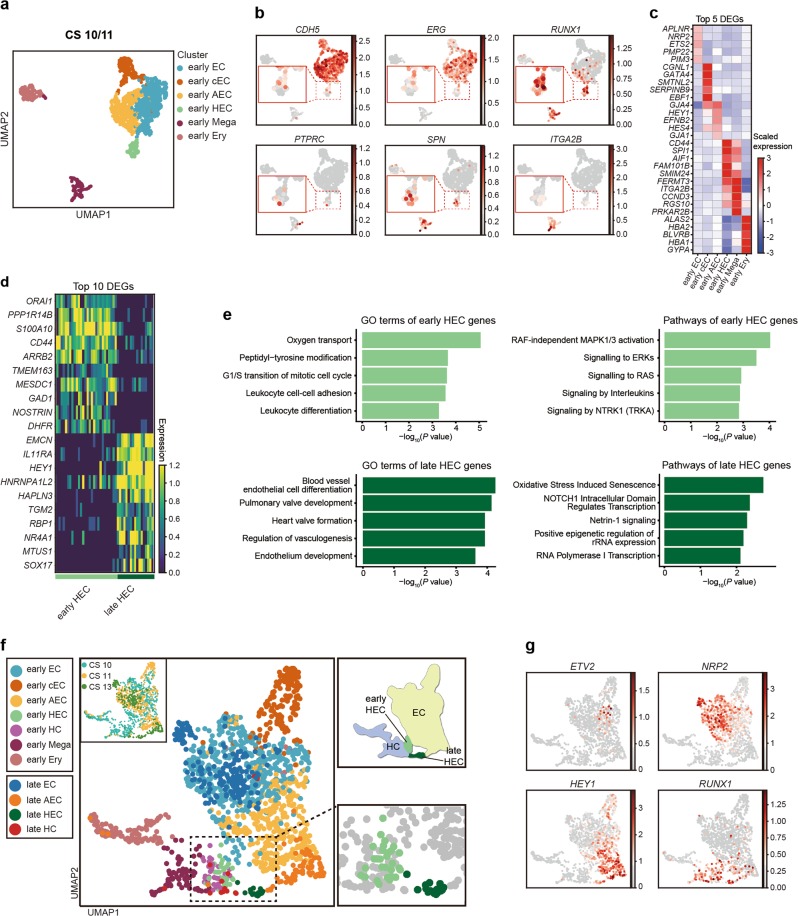
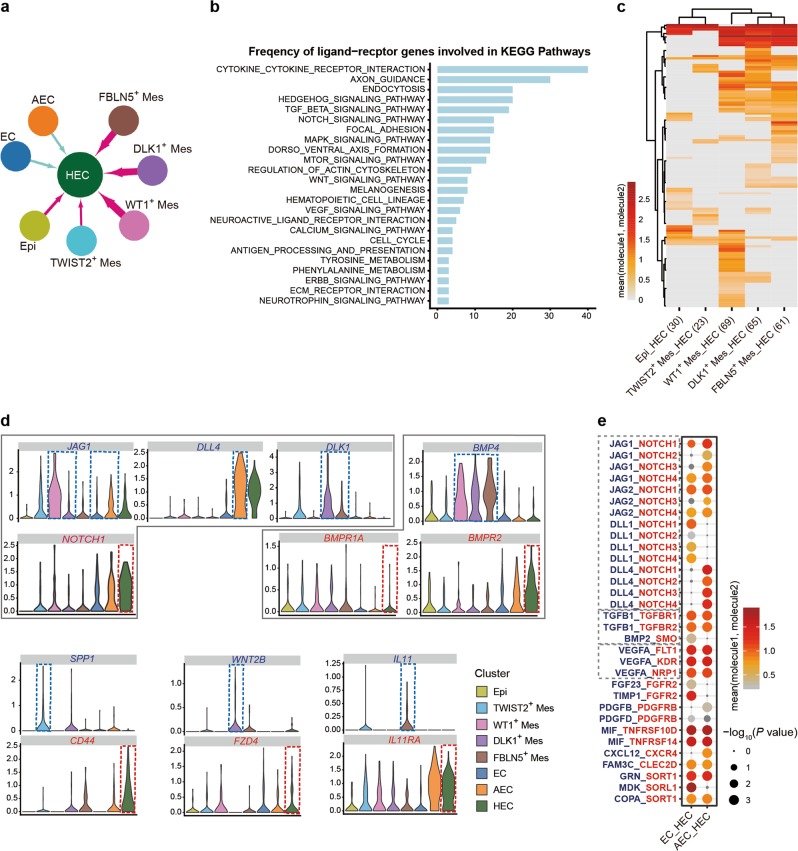
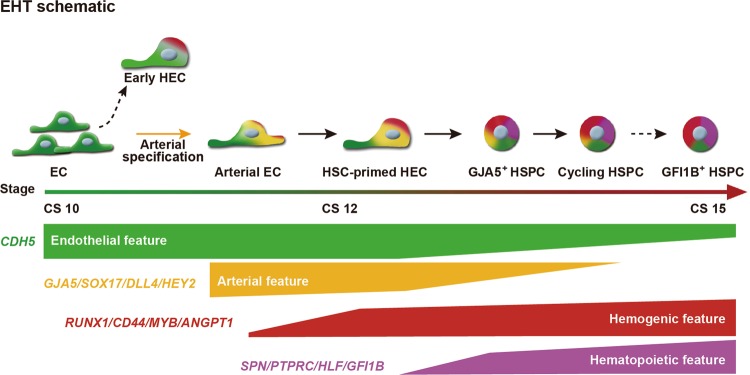
Tracing the emergence of the first hematopoietic stem cells (HSCs) in human embryos, particularly the scarce and transient precursors thereof, is so far challenging, largely due to the technical limitations and the material rarity. Here, using single-cell RNA sequencing, we constructed the first genome-scale gene expression landscape covering the entire course of endothelial-to-HSC transition during human embryogenesis. The transcriptomically defined HSC-primed hemogenic endothelial cells (HECs) were captured at Carnegie stage (CS) 12-14 in an unbiased way, showing an unambiguous feature of arterial endothelial cells (ECs) with the up-regulation of RUNX1, MYB and ANGPT1. Importantly, subcategorizing CD34+CD45- ECs into a CD44+ population strikingly enriched HECs by over 10-fold. We further mapped the developmental path from arterial ECs via HSC-primed HECs to hematopoietic stem progenitor cells, and revealed a distinct expression pattern of genes that were transiently over-represented upon the hemogenic fate choice of arterial ECs, including EMCN, PROCR and RUNX1T1. We also uncovered another temporally and molecularly distinct intra-embryonic HEC population, which was detected mainly at earlier CS 10 and lacked the arterial feature. Finally, we revealed the cellular components of the putative aortic niche and potential cellular interactions acting on the HSC-primed HECs. The cellular and molecular programs that underlie the generation of the first HSCs from HECs in human embryos, together with the ability to distinguish the HSC-primed HECs from others, will shed light on the strategies for the production of clinically useful HSCs from pluripotent stem cells.
Conflict of interest statement
The authors declare no competing interests.
Figures

Similar articles
-
Embryonic endothelial evolution towards first hematopoietic stem cells revealed by single-cell transcriptomic and functional analyses.Cell Res. 2020 May;30(5):376-392. doi: 10.1038/s41422-020-0300-2. Epub 2020 Mar 20. Cell Res. 2020. PMID: 32203131 Free PMC article.
-
Bone morphogenetic protein 4 induces hematopoietic stem cell development from murine hemogenic endothelial cells in culture.Stem Cell Reports. 2024 Dec 10;19(12):1677-1689. doi: 10.1016/j.stemcr.2024.10.005. Epub 2024 Nov 14. Stem Cell Reports. 2024. PMID: 39547225 Free PMC article.
-
Ribosome biogenesis is essential for hemogenic endothelial cells to generate hematopoietic stem cells.Development. 2024 Nov 1;151(21):dev202875. doi: 10.1242/dev.202875. Epub 2024 Oct 23. Development. 2024. PMID: 39324287 Free PMC article.
-
Hematopoietic Stem Cell Development in Mammalian Embryos.Adv Exp Med Biol. 2023;1442:1-16. doi: 10.1007/978-981-99-7471-9_1. Adv Exp Med Biol. 2023. PMID: 38228955 Review.
-
Opening the window for endothelial-to-hematopoietic transition.Genes Dev. 2021 Nov 1;35(21-22):1398-1400. doi: 10.1101/gad.349056.121. Genes Dev. 2021. PMID: 34725127 Free PMC article. Review.
Cited by
-
DNA methylation safeguards the generation of hematopoietic stem and progenitor cells by repression of Notch signaling.Development. 2022 May 15;149(10):dev200390. doi: 10.1242/dev.200390. Epub 2022 May 25. Development. 2022. PMID: 35502759 Free PMC article.
-
De Novo Generation of Human Hematopoietic Stem Cells from Pluripotent Stem Cells for Cellular Therapy.Cells. 2023 Jan 14;12(2):321. doi: 10.3390/cells12020321. Cells. 2023. PMID: 36672255 Free PMC article. Review.
-
One Size Does Not Fit All: Heterogeneity in Developmental Hematopoiesis.Cells. 2022 Mar 21;11(6):1061. doi: 10.3390/cells11061061. Cells. 2022. PMID: 35326511 Free PMC article. Review.
-
Single-cell transcriptomic landscape of human blood cells.Natl Sci Rev. 2020 Aug 24;8(3):nwaa180. doi: 10.1093/nsr/nwaa180. eCollection 2021 Mar. Natl Sci Rev. 2020. PMID: 34691592 Free PMC article.
-
An interactive resource of molecular signalling in the developing human haematopoietic stem cell niche.Development. 2023 Dec 1;150(23):dev201972. doi: 10.1242/dev.201972. Epub 2023 Dec 6. Development. 2023. PMID: 37840454 Free PMC article.
References
-
- Ivanovs A, et al. Human haematopoietic stem cell development: from the embryo to the dish. Development. 2017;144:2323–2337. - PubMed
-
- Notta F, et al. Isolation of single human hematopoietic stem cells capable of long-term multilineage engraftment. Science. 2011;333:218–221. - PubMed
-
- Zhang Y, et al. VE-cadherin and ACE co-expression marks highly proliferative hematopoietic stem cells in human embryonic liver. Stem Cells Dev. 2019;28:165–185. - PubMed
MeSH terms
Substances
Grants and funding
LinkOut - more resources
Full Text Sources
Other Literature Sources
Medical
Molecular Biology Databases
Research Materials
Miscellaneous
