Global Transcriptome and Co-Expression Network Analysis Reveal Contrasting Response of Japonica and Indica Rice Cultivar to γ Radiation
- PMID: 31491955
- PMCID: PMC6769861
- DOI: 10.3390/ijms20184358
Global Transcriptome and Co-Expression Network Analysis Reveal Contrasting Response of Japonica and Indica Rice Cultivar to γ Radiation
Abstract
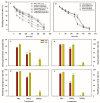
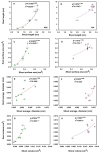
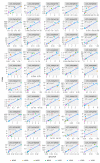
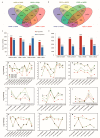
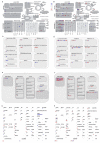
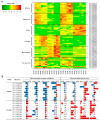
Japonica and indica are two important subspecies in cultivated Asian rice. Irradiation is a classical approach to induce mutations and create novel germplasm. However, little is known about the differential response between japonica and indica rice after γ radiation. Here, we utilized the RNA sequencing and Weighted Gene Co-expression Network Analysis (WGCNA) to compare the transcriptome differences between japonica Nipponbare (NPB) and indica Yangdao6 (YD6) in response to irradiation. Japonica subspecies are more sensitive to irradiation than the indica subspecies. Indica showed a higher seedling survival rate than japonica. Irradiation caused more extensive DNA damage in shoots than in roots, and the severity was higher in NPB than in YD6. GO and KEGG pathway analyses indicate that the core genes related to DNA repair and replication and cell proliferation are similarly regulated between the varieties, however the universal stress responsive genes show contrasting differential response patterns in japonica and indica. WGCNA identifies 37 co-expressing gene modules and ten candidate hub genes for each module. This provides novel evidence indicating that certain peripheral pathways may dominate the molecular networks in irradiation survival and suggests more potential target genes in breeding for universal stress tolerance in rice.
Keywords: gamma irradiation; gene network; morphology; rice (Oryza sativa L.); transcriptomic analysis.
Conflict of interest statement
The authors declare no conflict of interest. The funders had no role in the design of the study; in the collection, analyses, or interpretation of data; in the writing of the manuscript, or in the decision to publish the results.
Figures




Similar articles
-
Transcriptomic and Co-Expression Network Profiling of Shoot Apical Meristem Reveal Contrasting Response to Nitrogen Rate between Indica and Japonica Rice Subspecies.Int J Mol Sci. 2019 Nov 25;20(23):5922. doi: 10.3390/ijms20235922. Int J Mol Sci. 2019. PMID: 31775351 Free PMC article.
-
Transcriptomic Analysis for Indica and Japonica Rice Varieties under Aluminum Toxicity.Int J Mol Sci. 2019 Feb 25;20(4):997. doi: 10.3390/ijms20040997. Int J Mol Sci. 2019. PMID: 30823582 Free PMC article.
-
Integrated Transcriptomic and Metabolomic Analyses Uncover the Differential Mechanism in Saline-Alkaline Tolerance between Indica and Japonica Rice at the Seedling Stage.Int J Mol Sci. 2023 Aug 3;24(15):12387. doi: 10.3390/ijms241512387. Int J Mol Sci. 2023. PMID: 37569762 Free PMC article.
-
Advances on the Study of Diurnal Flower-Opening Times of Rice.Int J Mol Sci. 2023 Jun 26;24(13):10654. doi: 10.3390/ijms241310654. Int J Mol Sci. 2023. PMID: 37445832 Free PMC article. Review.
-
Identification and Regulation of Hypoxia-Tolerant and Germination-Related Genes in Rice.Int J Mol Sci. 2024 Feb 11;25(4):2177. doi: 10.3390/ijms25042177. Int J Mol Sci. 2024. PMID: 38396854 Free PMC article. Review.
Cited by
-
Transcriptomic and Co-Expression Network Profiling of Shoot Apical Meristem Reveal Contrasting Response to Nitrogen Rate between Indica and Japonica Rice Subspecies.Int J Mol Sci. 2019 Nov 25;20(23):5922. doi: 10.3390/ijms20235922. Int J Mol Sci. 2019. PMID: 31775351 Free PMC article.
-
Transcriptome analysis reveals multiple effects of nitrogen accumulation and metabolism in the roots, shoots, and leaves of potato (Solanum tuberosum L.).BMC Plant Biol. 2022 Jun 9;22(1):282. doi: 10.1186/s12870-022-03652-3. BMC Plant Biol. 2022. PMID: 35676629 Free PMC article.
-
Validation of Novel Reference Genes in Different Rice Plant Tissues through Mining RNA-Seq Datasets.Plants (Basel). 2023 Nov 23;12(23):3946. doi: 10.3390/plants12233946. Plants (Basel). 2023. PMID: 38068583 Free PMC article.
-
Transcriptome and Metabolome Analyses Revealed the Response Mechanism of Sugar Beet to Salt Stress of Different Durations.Int J Mol Sci. 2022 Aug 24;23(17):9599. doi: 10.3390/ijms23179599. Int J Mol Sci. 2022. PMID: 36076993 Free PMC article.
References
-
- Macovei A., Garg B., Raikwar S., Balestrazzi A., Carbonera D., Buttafava A., Bremont J.F.J., Gill S.S., Tuteja N. Synergistic exposure of rice seeds to different doses of γ-ray and salinity stress resulted in increased antioxidant enzyme activities and gene-specific modulation of TC-NER pathway. BioMed Res. Int. 2014;2014:676934. doi: 10.1155/2014/676934. - DOI - PMC - PubMed
MeSH terms
Grants and funding
- 31571608/National Natural Science Foundation of China
- BK20151311/Natural Science Foundation of Jiangsu Province
- 15KJA210003/Major Basic Research Project of the Natural Science Foundation of the Jiangsu Higher Education Institutions
- ML201903/the Open Funds of the Key Laboratory of Plant Functional Genomics of the Ministry of Education
- YZ2017118/Natural Science Foundation of Yangzhou
LinkOut - more resources
Full Text Sources

