. 2019 Oct 1;129(10):4207-4223.
doi: 10.1172/JCI127032.

Brain somatic mutations in MTOR reveal translational dysregulations underlying intractable focal epilepsy

Affiliations

Brain somatic mutations in MTOR reveal translational dysregulations underlying intractable focal epilepsy

Jang Keun Kim et al. J Clin Invest. .

Abstract

Brain somatic mutations confer genomic diversity in the human brain and cause neurodevelopmental disorders. Recently, brain somatic activating mutations in MTOR have been identified as a major etiology of intractable epilepsy in patients with cortical malformations. However, the molecular genetic mechanism of how brain somatic mutations in MTOR cause intractable epilepsy has remained elusive. In this study, translational profiling of intractable epilepsy mouse models with brain somatic mutations and genome-edited cells revealed a novel translational dysregulation mechanism and mTOR activation-sensitive targets mediated by human MTOR mutations that lead to intractable epilepsy with cortical malformation. These mTOR targets were found to be regulated by novel mTOR-responsive 5'-UTR motifs, distinct from known mTOR inhibition-sensitive targets regulated by 5' terminal oligopyrimidine motifs. Novel mTOR target genes were validated in patient brain tissues, and the mTOR downstream effector eIF4E was identified as a new therapeutic target in intractable epilepsy via pharmacological or genetic inhibition. We show that metformin, an FDA-approved eIF4E inhibitor, suppresses intractable epilepsy. Altogether, the present study describes translational dysregulation resulting from brain somatic mutations in MTOR, as well as the pathogenesis and potential therapeutic targets of intractable epilepsy.

Keywords: Epilepsy; Genetic variation; Neuroscience; Therapeutics; Translation.


Conflict of interest statement

Conflict of interest: JHL is a cofounder and chief technology officer of SoVarGen Inc., which develops new diagnostics and therapeutics for brain disorders. SoVarGen Inc. plans to apply for patents on the basis of the results of the current study.

Figures

Figure 1
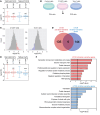
Figure 1. Ribosome profiling in the intractable epilepsy mouse models with brain somatic mutations in MTOR reveals mTOR target genes contributing to FMCD.
(A) Schematic diagram depicts the enrichment of low-level mutation-carrying neurons by FACS from FMCD mice using GFP reporter. Scale bars: 200 μm. (B) Venn diagrams show the number of genes identified from Ribo-Seq and RNA-Seq analysis of mTOR WT (WT), mTOR p.Cys1483Tyr (p.C1483Y), and mTOR p.Leu2427Pro (p.L2427P) mice. Distribution of TE changes in p.C1483Y or p.L2427P mice relative to WT mice. Upregulated mRNAs (Z score ≥ 1.2) are labeled as red in p.C1483Y (left) and p.L2427P (right) mice. See also Supplemental Tables 2 and 3. (C) Functional enrichment analysis of mTOR activation–sensitive genes in FMCD. Each circle represents a functional cluster. Color intensity indicates the statistical significance of functional enrichment as determined by average P value. The size of the circle corresponds to the number of genes, whereas the coordinates indicate average fold change values of p.C1483Y versus WT (x axis) and p.L2427P versus WT (y axis). Numbers of genes are given in parentheses. See also Supplemental Figure 3H.
Figure 2
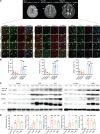
Figure 2. mTOR activation–sensitive genes in patients’ brain tissues with somatic mutations in MTOR.
(A) Representative brain MRI from a TSC, an FCD, and an HME patient with MTOR activating mutation. Arrows highlight the affected cortical region. Representative immunofluorescence staining of translationally upregulated mTOR targets (ADK, IRSp53, and CREB1 [red]) in NeuN+ (green) cells from the patient’s brain tissues stained with DAPI (blue). Scale bars: 25 μm for ADK and CREB1 and 60 μm for IRSp53. Control 1 refers to the postmortem brain tissues of UMB5309. (B) Quantification of samples in A. ADK, IRSp53, or CREB1 positivity in NeuN+ cells from TSC, FCD, and patients with HME. Five images were quantified in each section. Mean ± SD. (C) Western blots of ADK, IRSp53, CREB1, and p-S6 in lysates from patients with FMCD and control brain specimens. Arrow indicates long isoform of ADK (ADK-L), and arrowhead indicates short isoform of ADK (ADK-S). Blotting of α-tubulin in lysates was used as a loading control. Control 1 (Con1) refers to the postmortem brain region of UMB5309, Con2 to the postmortem brain region of UMB5408, Con3 to the unaffected brain region of FCD247, Con4 to the postmortem brain region of UMB1712, and Con5 to the postmortem brain region of UMB4917. (D) Quantification of C. The level of each target protein is presented as a percentage change relative to the average of 5 control samples. n = 5 in control (Con1, Con2, Con3, Con4, and Con5), n = 4 in FCD (FCD56, FCD247, FCD254, and FCD348), n = 3 in TSC (TSC2, TSC264, and TSC357), n = 3 in HME (HME20, HME255, and HME338). Mean ± SD. *P <0.05, **P < 0.01, ***P < 0.001. One-way ANOVA with Bonferroni’s post hoc test.
Figure 3
Figure 3. Translational landscape of mTOR activation–sensitive genes is distinct from that of mTOR inhibition–sensitive genes.
(A) Box plots show the log ratio of fold changes [log(ΔTE)] in the TEs of mRNAs encoding all genes and 5′ TOP mRNAs in p.C1483Y mice (TE[C1483Y/WT]) and p.L2427P mice (TE[L2427P/WT]) relative to WT mice. Mean ± SEM. See also Supplemental Table 6. (B) Schematic diagram of Ribo-Seq and RNA-Seq in control, C1483Y, and Torin1 cells. (C) Distribution of changes in the TEs of mRNAs from C1483Y and Torin1 cells relative to control cells. Upregulated mRNAs (Z score ≥ 1.5, mTOR activation–sensitive genes) in C1483Y cells (left) are indicated in red, and downregulated mRNAs (Z score ≤ –1.5, mTOR inhibition–sensitive genes) in Torin1 cells (right) are indicated in blue. See also Supplemental Table 8. (D) Venn diagram of mTOR activation–sensitive genes in C1483Y cells (red) and mTOR inhibition–sensitive genes in Torin1 cells (blue). (E) Box plots showing the log2 ratios of fold changes [log2(ΔTE)] in the TEs of mRNAs encoding all genes and 5′ TOP in C1483Y cells [TE(C1483Y/WT)] and Torin1 cells [TE(Torin1/WT)] relative to control cells. Mean ± SEM. See also Supplemental Table 9. (F) The top 8 clusters in DAVID functional annotation were associated with mTOR activation–sensitive genes in C1483Y cells (top) and mTOR inhibition–sensitive genes in Torin1 (bottom). Black lines reflect a P value of 0.05. ***P < 0.001. One-way ANOVA with Bonferroni’s post hoc test.
Figure 4
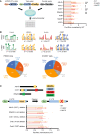
Figure 4. mTOR activation–sensitive genes confer mTOR-responsive 5′-UTR motifs.
(A) 5′-UTR–mediated translation of target mRNAs (Adk-S, Adk-L, Creb1, and IRSp53) and control mRNAs (Actb and Gapdh) by 5′-UTR luciferase reporter assay in HEK293T cells transfected with mTOR WT (WT) and mTOR p.C1483Y or p.L2427P. Pro denotes promoter. Actb denotes β-actin gene. pGL3 denotes the test vector lacking a 5′-UTR. Results are normalized to 5′-UTR reporter activity in transfected mTOR WT cells. n = 7 in each case. Mean ± SD. (B) Consensus sequence and enrichment values (e value) of the U-rich, guanine quartet (GGC)4, A-rich, and CERT motifs identified in mTOR activation–sensitive genes in FMCD mice and C1483Y cells by MEME analysis. Diagram illustrating the frequencies of mTOR activation–sensitive genes in FMCD mice and C1483Y cells containing U-rich, guanine quartet (GGC)4, A-rich, and CERT motifs. Several motifs in the same genes were counted independently. See also Supplemental Tables 11 and 13. (C) Location of 5′-UTR motifs in Adk-S, IRSp53, and Creb1 is indicated. Effect of deletion mutations in 5′-UTR motif domains in Adk-S, IRSp53, and Creb1 on 5′-UTR luciferase reporter activity in mTOR-activated p.C1483Y or p.L2427P cells relative to WT-transfected HEK293T cells. Pro denotes promoter. n = 7 in each case. Mean ± SD. See also Supplemental Table 14. *P < 0.05, **P < 0.01, ***P < 0.001. One-way ANOVA with Bonferroni’s post hoc test.
Figure 5
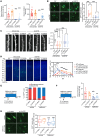
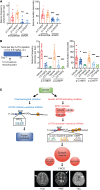
Figure 5. Pharmacological or genetic inhibition of eIF4E rescues intractable epilepsy and other pathologies observed in FMCD mice.
(A) Quantification of seizure frequency (left) and duration (right) in FMCD adult mice treated with sheIF4E (from P21 to P120). p.C1483Y-shScramble: n = 20; p.L2427P-shScramble: n = 25; p.C1483Y-sheIF4E: n = 15; p.L2427P-sheIF4E: n =20. Mean ± SD. (B) Images of layers 2/3 of GFP+ cells from FMCD mice treated with shScramble and sheIF4E at P21 and soma area quantification. n = 5 in each case. Scale bar: 20 μm. Mean ± SEM. (C) Spine density quantification and images of basal dendrites in neurons from FMCD mice treated with shScramble or sheIF4E at P21. Five mice per condition. Scale bar: 2 μm. Mean ± SEM. (D) Representative images of GFP+ cell migration in the cortices of FMCD mice treated with shScramble or sheIF4E at P7. Quantification of the distributions of GFP+ neurons in the cortex. n = 5 in each case. Scale bar: 100 μm. Mean ± SEM. (E) Metformin was injected i.p. once from P14 to P56 (200 mg/kg/d). Quantification of seizure frequency in adult FMCD mice (P21–P56) treated with metformin. p.C1483Y-vehicle: n = 11; p.L2427P-vehicle: n = 11; p.C1483Y-metformin: n = 7; p.L2427P-metformin: n = 10. (F) Metformin was injected i.p. once for 30 days (200 mg/kg/d). Quantification of seizure frequency in adult FMCD mice (P94–P114) treated with metformin. Ten mice per condition. Mean ± SD. (G) Images of layers 2/3 of GFP+ cells from FMCD mice treated with vehicle and metformin (P14–P56) and soma area quantification. n = 5 in each case. Scale bar: 25 μm. Mean ± SEM. **P < 0.01, ***P < 0.001. One-way ANOVA with Bonferroni’s post hoc test.
Figure 6
Figure 6. Pharmacological or genetic inhibition of ADK alleviates intractable epilepsies in FMCD mice.
(A) Quantification of seizure frequency (left) and duration (right) in adult FMCD mice treated with shADK (from P21 to P112, 3 times per 1 week). p.C1483Y-shScramble: n = 20; p.L2427P-shScramble: n = 25; p.C1483Y-shADK: n = 15; p.L2427P-shADK: n =13. Mean ± SD. (B) 5-ITU or vehicle was injected i.p. twice for 10 days (1.0 or 2.6 mg per kg of body weight per day), with 12 h/d seizure recording. Quantification of seizure frequency (left) and duration (right) in adult FMCD mice (P112–P140) treated with 5-ITU. n = 5 in each case. Mean ± SD. (C) A model of translation dysregulation mediated by human MTOR activating mutation, compared with pharmacological inhibition of mTOR. Acute pharmacological inhibition of mTOR kinase mainly downregulates the translation of PRTE mRNAs mainly encoding ribosomal proteins and translation factors. However, human MTOR–activating mutations upregulate the translation of mRNAs with 5′-UTR motifs responsive to eIF4F activity, which underlie major pathological phenotypes in FMCD. *P < 0.05, **P < 0.01, ***P < 0.001. One-way ANOVA with Bonferroni’s post hoc test.

Similar articles

Cited by

References

    1. Lee JH. Somatic mutations in disorders with disrupted brain connectivity. Exp Mol Med. 2016;48:e239. - PMC - PubMed
    1. Bae T, et al. Different mutational rates and mechanisms in human cells at pregastrulation and neurogenesis. Science. 2018;359(6375):550–555. doi: 10.1126/science.aan8690. - DOI - PMC - PubMed
    1. Lee JH, et al. De novo somatic mutations in components of the PI3K-AKT3-mTOR pathway cause hemimegalencephaly. Nat Genet. 2012;44(8):941–945. doi: 10.1038/ng.2329. - DOI - PMC - PubMed
    1. Lim JS, et al. Brain somatic mutations in MTOR cause focal cortical dysplasia type II leading to intractable epilepsy. Nat Med. 2015;21(4):395–400. doi: 10.1038/nm.3824. - DOI - PubMed
    1. Leventer RJ, et al. Hemispheric cortical dysplasia secondary to a mosaic somatic mutation in MTOR. Neurology. 2015;84(20):2029–2032. doi: 10.1212/WNL.0000000000001594. - DOI - PMC - PubMed

Publication types

MeSH terms