

Hepatitis C virus modelled as an indirectly transmitted infection highlights the centrality of injection drug equipment in disease dynamics
- PMID: 31480919
- PMCID: PMC6769301
- DOI: 10.1098/rsif.2019.0334
Hepatitis C virus modelled as an indirectly transmitted infection highlights the centrality of injection drug equipment in disease dynamics
Abstract
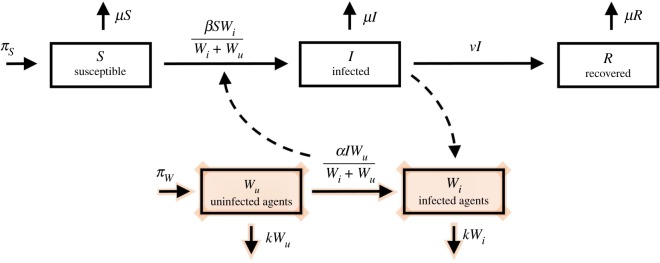
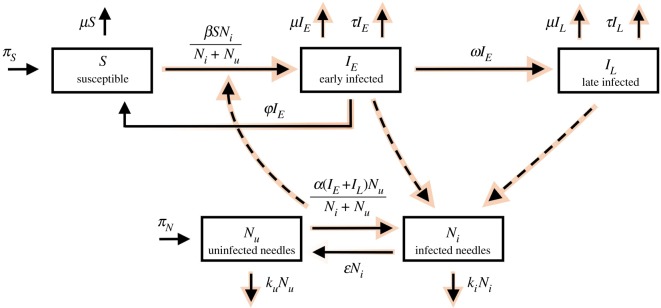
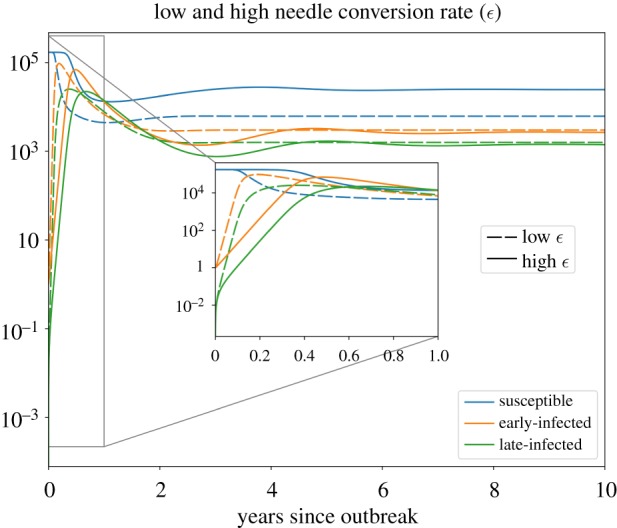
The hepatitis C virus (HCV) epidemic often occurs through the persistence of injection drug use. Mathematical models have been useful in understanding various aspects of the HCV epidemic, and especially, the importance of new treatment measures. Until now, however, few models have attempted to understand HCV in terms of an interaction between the various actors in an HCV outbreak-hosts, viruses and the needle injection equipment. In this study, we apply perspectives from the ecology of infectious diseases to model the transmission of HCV among a population of injection drug users. The products of our model suggest that modelling HCV as an indirectly transmitted infection-where the injection equipment serves as an environmental reservoir for infection-facilitates a more nuanced understanding of disease dynamics, by animating the underappreciated actors and interactions that frame disease. This lens may allow us to understand how certain public health interventions (e.g. needle exchange programmes) influence HCV epidemics. Lastly, we argue that this model is of particular importance in the light of the modern opioid epidemic, which has already been associated with outbreaks of viral diseases.
Keywords: ecology of infectious disease; epidemiology; mathematical modelling.
Conflict of interest statement
We declare we have no competing interests.
Figures
Similar articles
-
Hepatitis C virus transmission dynamics in injection drug users.Subst Use Misuse. 1998 Apr;33(5):1197-212. doi: 10.3109/10826089809062214. Subst Use Misuse. 1998. PMID: 9596383 Review.
-
Epidemiology of hepatitis C virus infection among injection drug users in China: systematic review and meta-analysis.Public Health. 2008 Oct;122(10):990-1003. doi: 10.1016/j.puhe.2008.01.014. Epub 2008 May 19. Public Health. 2008. PMID: 18486955 Review.
-
The epidemic behavior of the hepatitis C virus.Science. 2001 Jun 22;292(5525):2323-5. doi: 10.1126/science.1058321. Science. 2001. PMID: 11423661
-
Scaling-up HCV prevention and treatment interventions in rural United States-model projections for tackling an increasing epidemic.Addiction. 2018 Jan;113(1):173-182. doi: 10.1111/add.13948. Epub 2017 Sep 20. Addiction. 2018. PMID: 28734093 Free PMC article.
-
Association of opioid agonist therapy with lower incidence of hepatitis C virus infection in young adult injection drug users.JAMA Intern Med. 2014 Dec;174(12):1974-81. doi: 10.1001/jamainternmed.2014.5416. JAMA Intern Med. 2014. PMID: 25347412 Free PMC article.
Cited by
-
Hepatitis C Virus Dynamic Transmission Models Among People Who Inject Drugs.Infect Drug Resist. 2023 Feb 20;16:1061-1068. doi: 10.2147/IDR.S403133. eCollection 2023. Infect Drug Resist. 2023. PMID: 36845020 Free PMC article. Review.
-
Variation in microparasite free-living survival and indirect transmission can modulate the intensity of emerging outbreaks.Sci Rep. 2020 Nov 27;10(1):20786. doi: 10.1038/s41598-020-77048-4. Sci Rep. 2020. PMID: 33247174 Free PMC article.
-
The Epidemiological Signature of Pathogen Populations That Vary in the Relationship between Free-Living Parasite Survival and Virulence.Viruses. 2020 Sep 22;12(9):1055. doi: 10.3390/v12091055. Viruses. 2020. PMID: 32971954 Free PMC article.
-
Evolutionary Invasion Analysis of Modern Epidemics Highlights the Context-Dependence of Virulence Evolution.Bull Math Biol. 2024 Jun 14;86(8):88. doi: 10.1007/s11538-024-01313-0. Bull Math Biol. 2024. PMID: 38877355 Free PMC article.
References
Publication types
MeSH terms
LinkOut - more resources
Full Text Sources
Medical
