. 2020 Jul;16(7):1200-1220.
doi: 10.1080/15548627.2019.1659616. Epub 2019 Aug 30.

Tanycytic TSPO inhibition induces lipophagy to regulate lipid metabolism and improve energy balance

Affiliations

Tanycytic TSPO inhibition induces lipophagy to regulate lipid metabolism and improve energy balance

Seolsong Kim et al. Autophagy. 2020 Jul.

Abstract

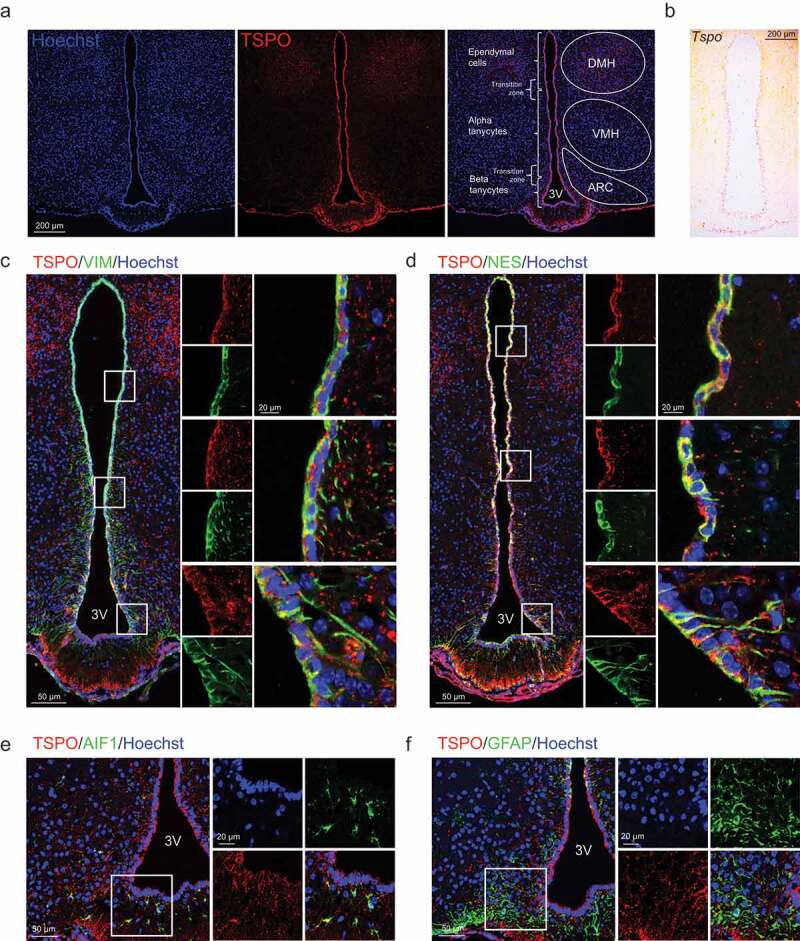
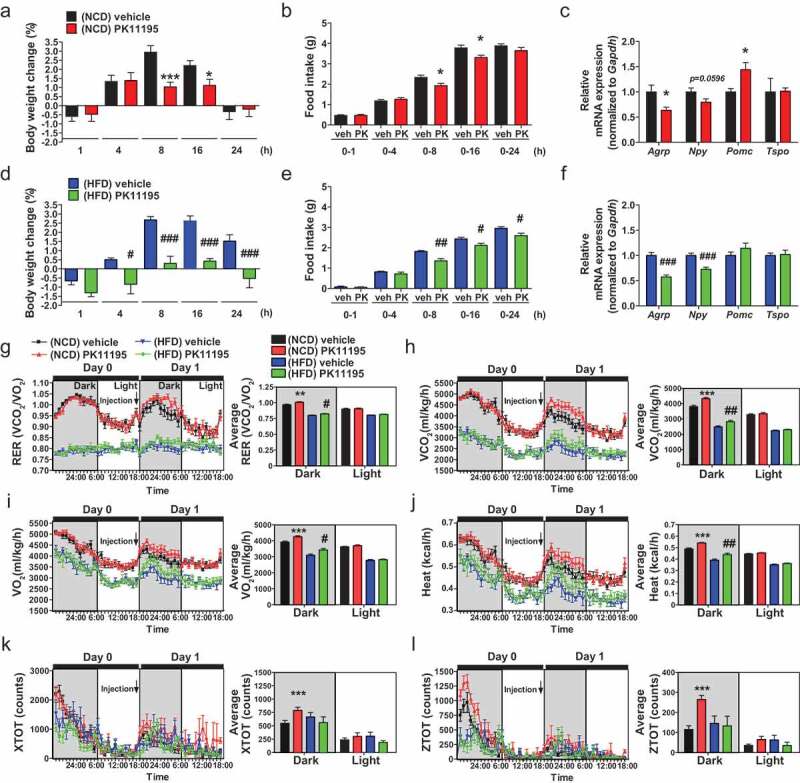
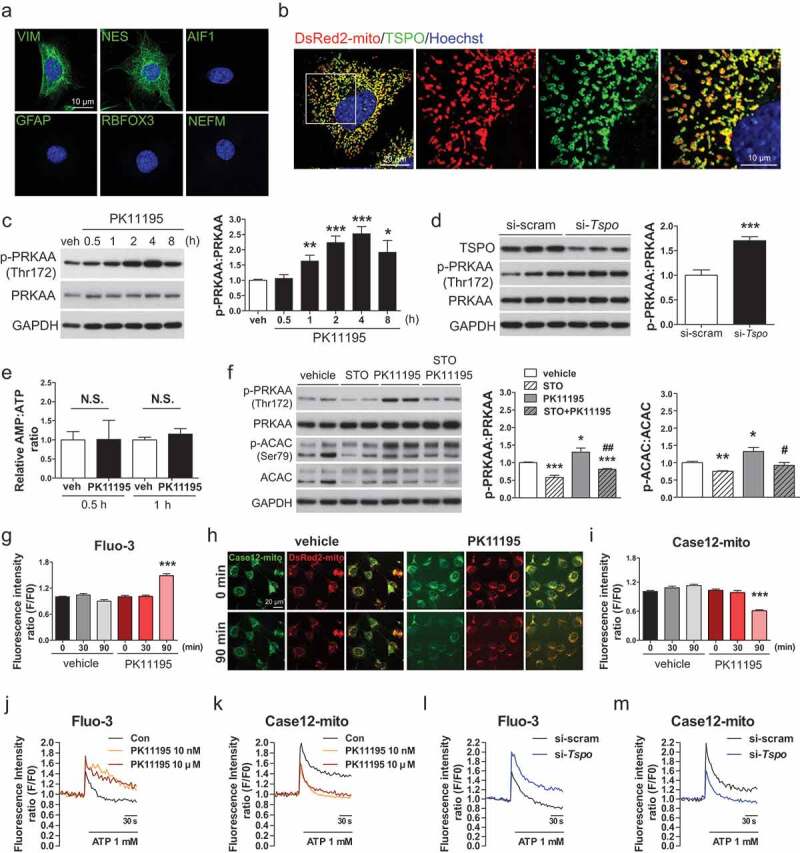
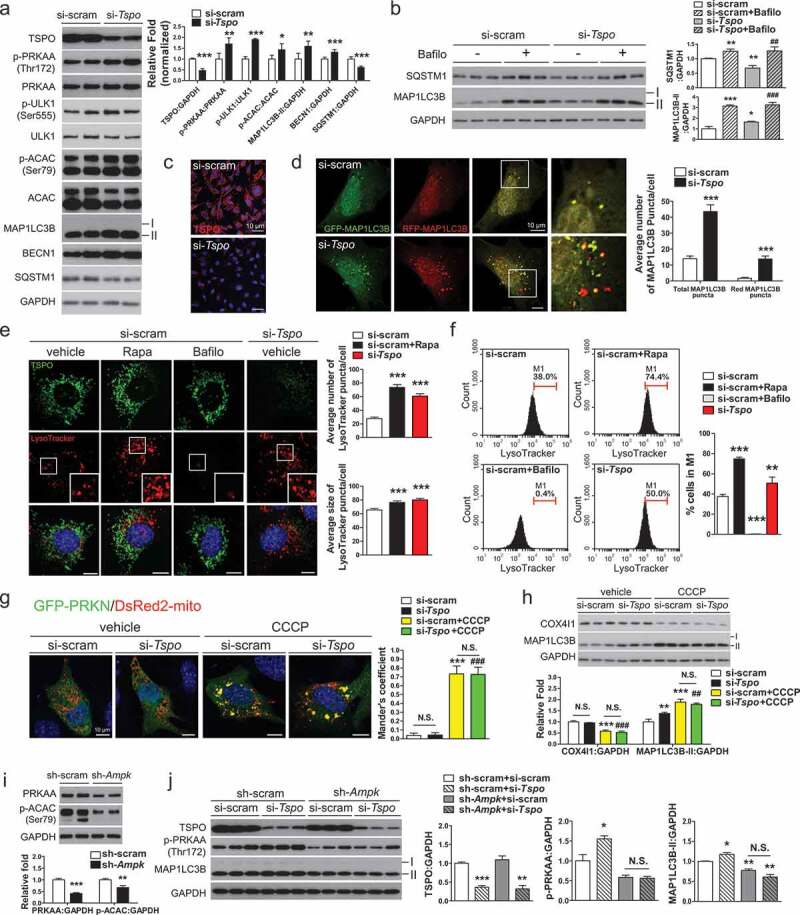
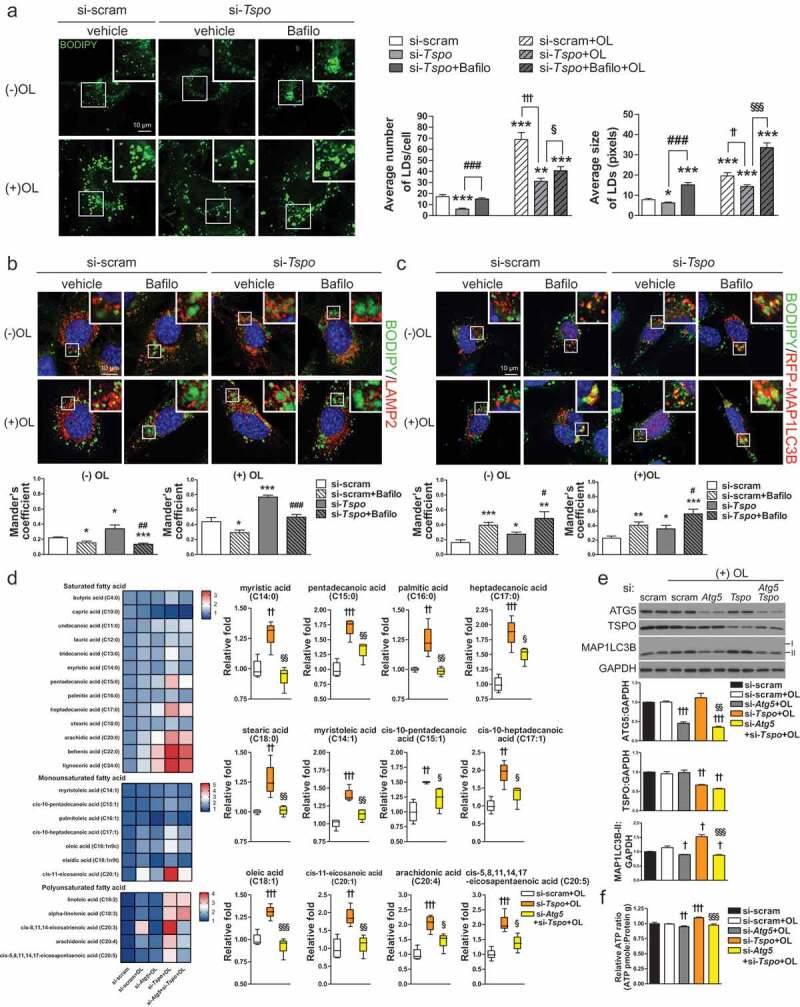
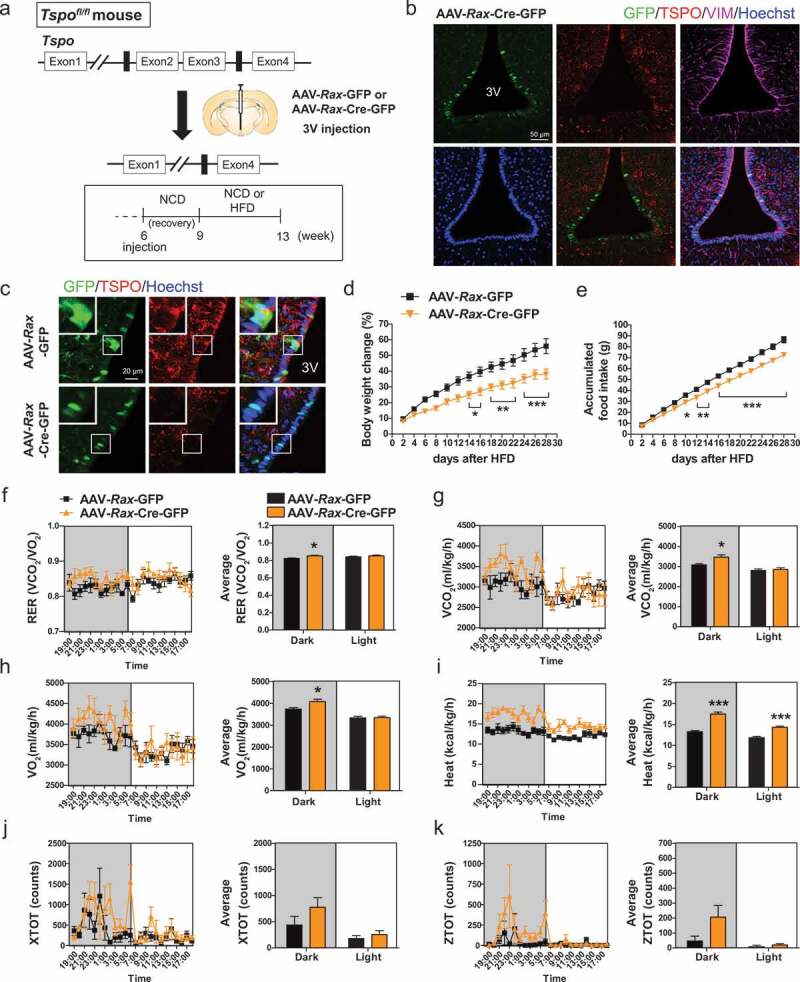
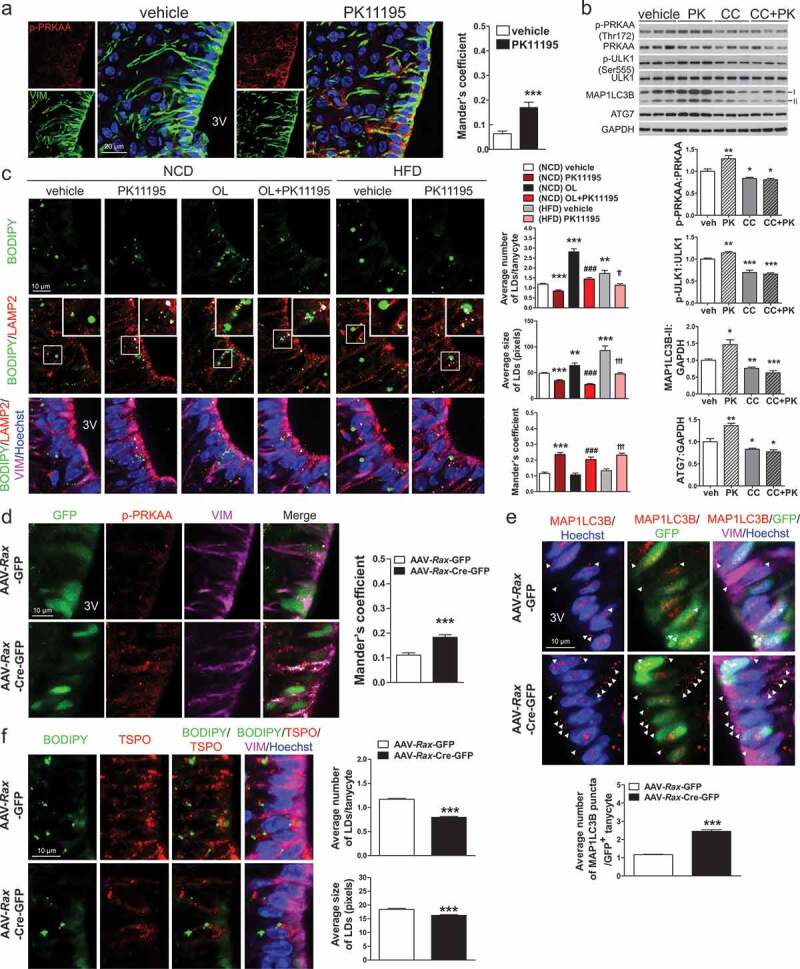
Hypothalamic glial cells named tanycytes, which line the 3rd ventricle (3V), are components of the hypothalamic network that regulates a diverse array of metabolic functions for energy homeostasis. Herein, we report that TSPO (translocator protein), an outer mitochondrial protein, is highly enriched in tanycytes and regulates homeostatic responses to nutrient excess as a potential target for an effective intervention in obesity. Administration of a TSPO ligand, PK11195, into the 3V, and tanycyte-specific deletion of Tspo reduced food intake and elevated energy expenditure, leading to negative energy balance in a high-fat diet challenge. Ablation of tanycytic Tspo elicited AMPK-dependent lipophagy, breaking down lipid droplets into free fatty acids, thereby elevating ATP in a lipid stimulus. Our findings suggest that tanycytic TSPO affects systemic energy balance through macroautophagy/autophagy-regulated lipid metabolism, and highlight the physiological significance of TSPO in hypothalamic lipid sensing and bioenergetics in response to overnutrition.

Abbreviations: 3V: 3rd ventricle; ACAC: acetyl-Coenzyme A carboxylase; AGRP: agouti related neuropeptide; AIF1/IBA1: allograft inflammatory factor 1; AMPK: AMP-activated protein kinase; ARC: arcuate nucleus; Atg: autophagy related; Bafilo: bafilomycin A1; CAMKK2: calcium/calmodulin-dependent protein kinase kinase 2, beta; CCCP: carbonyl cyanide m-chlorophenylhydrazone; CNS: central nervous system; COX4I1: cytochrome c oxidase subunit 4I1; FFA: free fatty acid; GFAP: glial fibrillary acidic protein; HFD: high-fat diet; ICV: intracerebroventricular; LAMP2: lysosomal-associated membrane protein 2; LD: lipid droplet; MAP1LC3B/LC3B: microtubule-associated protein 1 light chain 3 beta; MBH: mediobasal hypothalamus; ME: median eminence; MEF: mouse embryonic fibroblast; NCD: normal chow diet; NEFM/NFM: neurofilament medium; NPY: neuropeptide Y; OL: oleic acid; POMC: pro-opiomelanocortin-alpha; PRKN/Parkin: parkin RBR E3 ubiquitin protein ligase; Rax: retina and anterior neural fold homeobox; RBFOX3/NeuN: RNA binding protein, fox-1 homolog (C. elegans) 3; RER: respiratory exchange ratio; siRNA: small interfering RNA; SQSTM1: sequestosome 1; TG: triglyceride; TSPO: translocator protein; ULK1: unc-51 like kinase 1; VCO2: carbon dioxide production; VMH: ventromedial hypothalamus; VO2: oxygen consumption.

Keywords: AMPK; TSPO; autophagy; energy balance; energy expenditure; food intake; hypothalamus; lipid metabolism; lipophagy; tanycyte.


Conflict of interest statement

No potential conflict of interest was reported by the authors.

Figures

Figure 1.
Figure 1.
TSPO is highly expressed in ependymal cells and tanycytes in the hypothalamus. (A) Distribution of TSPO (red) immunoreactivity and nuclear staining (Hoechst, blue) in a coronal section of the mediobasal hypothalamus (MBH) in adult mice. DMH, dorsomedial hypothalamus; VMH, ventromedial hypothalamus; ARC, arcuate nucleus. (B) In situ hybridization for Tspo mRNA in the MBH of adult mice. (C–F) Immunostaining for TSPO (red) and VIM (green, C), NES (green, D), AIF1 (green, E), or GFAP (green, F) with Hoechst (blue) staining in the MBH near the 3V of adult mice.
Figure 2.
Figure 2.
Administration of the TSPO ligand PK11195 into the 3V reduces food intake and stimulates energy expenditure in NCD- and HFD-fed mice. Mice were fed NCD or HFD for 4 weeks, and PK11195 or vehicle (2% ethanol) was injected into the 3V through a cannula. (A–F) Body weight change (A and D), food intake (B and E), and hypothalamic Agrp, Npy, Pomc and Tspo mRNA expression (C and F) in mice fed NCD (A–C; n = 10) or HFD (D–F; n = 5). (G–L) RER (G), VCO2 (H), VO2 (I), heat production (J), locomotor activity x axis (XTOT) (K), and z axis (ZTOT) (L). (NCD, n = 12; HFD, n = 8). Data are mean ± SEM, *P ≤ 0.05, **P ≤ 0.01, and ***P ≤ 0.001 vs. NCD vehicle; #P ≤ 0.05, ##P ≤ 0.01, and ###P ≤ 0.001 vs. HFD vehicle as determined by Student’s t-test.
Figure 3.
Figure 3.
Inhibition of TSPO activates AMPK by blocking mitochondrial Ca2+ uptake in A2/29 cells. (A) Immunostaining for VIM or NES (green) with Hoechst (blue) staining. No staining was detectable for AIF1, GFAP, RBFOX3, and NEFM (all green). (B) Representative micrographs of DsRed2-mito and immunostaining for TSPO (green) with Hoechst (blue) staining. (C) Immunoblotting analysis and quantification of p-PRKAA in cells treated with vehicle (veh) or 10 μM PK11195 (n = 3). (D) Immunoblotting analysis and quantification of TSPO and p-PRKAA in si-scram- or si-Tspo-transfected cells (n = 8 or 9). (E) AMP:ATP ratio in vehicle- or 10 μM PK11195-treated cells determined by using UPLC (n = 5). All differences were not significant (N.S.). (F) Immunoblotting analysis and quantification of p-PRKAA and p-ACAC in cells treated with vehicle or 10 μM PK11195 for 2 h with or without 4 h pretreatment with STO-609 (STO), a CAMKK inhibitor (n = 4). (G) Time course of fluorescence intensity of Fluo-3/AM [Ca2+]cyto in cells treated with vehicle or 10 μM PK11195 (n = 89–139 cells). (H and I) Representative micrographs (H) and time course analysis (I) of Case12-mito and DsRed2-mito for measurement of [Ca2+]mito in cells treated with vehicle or 10 μM PK11195 (n = 89–141 cells). Case12-mito labeling intensity was normalized to that of DsRed2-mito. (J and K) Live imaging for fluorescence-based detection of [Ca2+]cyto (J) and [Ca2+]mito (K) in response to 1 mM ATP in cells pretreated with vehicle or PK11195 (10 nM or 10 μM) for 90 min (n = 11–15 cells from 3 independent experiments). (L and M) Live imaging for fluorescence-based detection of [Ca2+]cyto (L) and [Ca2+]mito (M) in response to 1 mM ATP in si-scram- or si-Tspo-transfected cells (n = 15 or 16 cells from 3 independent experiments). Data are mean ± SEM, *P ≤ 0.05, **P ≤ 0.01, and ***P ≤ 0.001 vs. si-scram, vehicle (veh), and PK11195 0 min; #P ≤ 0.05, ##P ≤ 0.01 vs. PK11195, as determined by Student’s t-test.
Figure 4.
Figure 4.
Knockdown of Tspo induces autophagy through AMPK activation in A2/29 cells. (A) Immunoblotting analysis and quantification of TSPO, p-PRKAA, and autophagy markers in cells transfected with si-scram or si-Tspo (n = 5). (B) Immunoblotting analysis and quantification of SQSTM1, TSPO and MAP1LC3B-II in cells transfected with si-scram or si-Tspo and treated with vehicle or Bafilo (n = 3). (C) Representative micrographs showing decreased expression of TSPO (red) in si-Tspo-transfected cells. (D) The mRFP-GFP-MAP1LC3B assay in cells transfected with si-scram or si-Tspo (n = 30 cells). (E) Representative micrographs of TSPO (green) and LysoTracker (red) with Hoechst (blue) staining in cells transfected with si-scram or si-Tspo. Rapamycin (Rapa) and Bafilo were used to induce autophagy and to prevent lysosomal acidification in si-scram-transfected cells, respectively. Average number and size of LysoTracker puncta per cell were quantified (n = 20 cells). (F) Fluorescence-activated cell sorting analysis showing fluorescence intensity of LysoTracker in cells transfected with si-scram or si-Tspo (n = 4). (G) Representative micrographs and quantification of colocalization for GFP-PRKN (green) and DsRed2-mito (red) with Hoechst (blue) staining in cells transfected with si-scram or si-Tspo. CCCP was used to induce mitochondrial translocation of PRKN in si-scram and si-Tspo-transfected cells (n = 10–12 cells). (H) Immunoblotting analysis and quantification of COX4I1 and MAP1LC3B-II in cells transfected with si-scram or si-Tspo with or without CCCP (n = 3). (I) Immunoblotting analysis and quantification of PRKAA and p-ACAC in sh-scram- or sh-Ampk-expressing cells (n = 6). (J) Immunoblotting analysis and quantification of TSPO, p-PRKAA, and MAP1LC3B-II in sh-scram- or sh-Ampk-expressing cells that were further transfected with si-scram or si-Tspo (n = 3). Data are mean ± SEM, *P ≤ 0.05, **P ≤ 0.01, and ***P ≤ 0.001 vs. si-scram, sh-scram or vehicle; ##P ≤ 0.01 and ###P ≤ 0.001 vs. si-Tspo, as determined by Student’s t-test.
Figure 5.
Figure 5.
Knockdown of Tspo generates free fatty acids by lipophagy in A2/29 cells. (A) Representative micrographs of BODIPY (green) in si-scram- or si-Tspo-transfected A2/29 cells with or without Bafilo or OL. Average number and size of LDs per cell were quantified (n = 14–21 cells). (B and C) Representative micrographs and quantification of colocalization for BODIPY (green) and LAMP2 (red; B) or mRFP-MAP1LC3B (red; C) in si-scram- or si-Tspo-transfected cells with or without Bafilo and OL (n = 11–16 cells). (D) Heatmap and box–whisker plot of free fatty acids analyzed by targeted GC-MS/MS metabolomics of si-scram- or si-Tspo-transfected cells with OL and with or without pre-transfection with si-Atg5 (n = 4). (E) Immunoblotting analysis and quantification of ATG5, TSPO, and MAP1LC3B-II in si-scram- or si-Tspo-transfected cells with OL and with or without pre-transfection with si-Atg5 (n = 3). (F) Cellular ATP level in si-scram- or si-Tspo-transfected cells with OL and with or without pre-transfection with si-Atg5 (n = 16). Data are mean ± SEM, *P ≤ 0.05, **P ≤ 0.01, ***P ≤ 0.001 vs. si-scram; #P ≤ 0.05, ##P ≤ 0.01, ###P ≤ 0.001 vs. si-Tspo; P ≤ 0.05, ††P ≤ 0.01, †††P ≤ 0.001 vs. si-scram+OL; §P ≤ 0.05, §§P ≤ 0.01, §§§P ≤ 0.001 vs. si-Tspo+OL, as determined by Student’s t-test.
Figure 6.
Figure 6.
Ablation of Tspo in tanycytes decreases food intake and increases energy expenditure in HFD-fed mice. (A) Strategy to generate conditional tanycyte-specific Tspo knockout mice by viral injection of AAV-Rax-Cre-GFP into the 3V in Tspofl/fl mice. (B) Immunostaining for TSPO (red) and VIM (magenta) with Hoechst (blue) staining in GFP-positive ventral tanycytes of AAV-Rax-Cre-GFP-injected Tspofl/fl mice. (C) High-magnification micrographs showing GFP (green), Hoechst (blue), and TSPO (red) in ventral tanycytes of Tspofl/fl mice injected with AAV-Rax-Cre-GFP or AAV-Rax-GFP. (D–K) Body weight change (D), accumulated food intake (E), RER (F), VCO2 (G), VO2 (H), heat production (I), XTOT (J), and ZTOT (K) of Tspofl/fl mice fed HFD for 4 weeks after injection with AAV-Rax-Cre-GFP or AAV-Rax-GFP into the 3V (n = 9). Data are mean ± SEM, *P ≤ 0.05, **P ≤ 0.01, ***P ≤ 0.001 vs. AAV-Rax-GFP, as determined by two-way ANOVA (D and E) or Student’s t-test (F-I).
Figure 7.
Figure 7.
Intracerebroventricular (ICV) injection of PK11195 or ablation of Tspo induces lipophagy in tanycytes. (A) Representative micrographs and quantification of colocalization for p-PRKAA (red) and VIM (green) in ventral tanycytes of PK11195- or vehicle-injected mice fed NCD (n = 18 sections/3 mice). (B) Immunoblotting analysis and quantification of p-PRKAA and autophagy markers in the hypothalamus after ICV injection of PK11195 (PK), compound C (CC), or vehicle into the 3V of mice fed NCD (n = 6). (C) Immunostaining for LAMP2 (red) and VIM (magenta) with BODIPY (green) and Hoechst (blue) staining in ventral tanycytes of mice fed NCD with or without injection of PK11195 or OL, or fed HFD with or without PK11195. Average number and size of LDs per cell and colocalization of BODIPY and LAMP2 (white) were quantified (n = 15 sections/3 mice). (D–F) Tspofl/fl mice were injected with AAV-Rax-Cre-GFP or AAV-Rax-GFP and fed HFD for 4 weeks. (D and E) Immunostaining for p-PRKAA (red; D) or MAP1LC3B (red; E), and VIM (magenta) in GFP+-tanycytes. Colocalization of p-PRKAA and VIM (white) was quantified (D; n = 9 sections/3 mice). Aaverage number of MAP1LC3B puncta in the cytosol (arrowhead) was also quantified (E; n = 58–72 cells/3 mice). (F) Immunostaining for TSPO (red) and VIM (magenta) with BODIPY (green) and Hoechst (blue) staining in ventral tanycytes. Average number and size of LDs per cell were quantified (n = 88 or 89 cells/3 mice). Data are mean ± SEM, *P ≤ 0.05, **P ≤ 0.01, ***P ≤ 0.001 vs. PK11195, (NCD) vehicle, or AAV-Rax-GFP; ###P ≤ 0.001 vs. (NCD) OL; ††P ≤ 0.01, †††P ≤ 0.001 vs. (HFD) vehicle, as determined by Student’s t-test.

Similar articles

Cited by

References

    1. Schwartz MW, Woods SC, Porte D Jr.. et al. Central nervous system control of food intake. Nature. 2000. April 06;404(6778):661–671. PubMed PMID: 10766253. - PubMed
    1. Waterson MJ, Horvath TL.. Neuronal regulation of energy homeostasis: beyond the hypothalamus and feeding. Cell Metab. 2015. December 1;22(6):962–970. PubMed PMID: 26603190. - PubMed
    1. Garcia-Caceres C, Fuente-Martin E, Argente J, et al. Emerging role of glial cells in the control of body weight. Mol Metab. 2012;1(1–2):37–46. PubMed PMID: 24024117; PubMed Central PMCID: PMC3757650. - PMC - PubMed
    1. Buckman LB, Ellacott KL. The contribution of hypothalamic macroglia to the regulation of energy homeostasis. Front Syst Neurosci. 2014;8:212. PubMed PMID: 25374514; PubMed Central PMCID: PMC4206078. - PMC - PubMed
    1. Ebling FJP, Lewis JE. Tanycytes and hypothalamic control of energy metabolism. Glia. 2018. June;66(6):1176–1184. PubMed PMID: 29411421. - PubMed

Publication types

MeSH terms

Grants and funding

This work was supported by the National Research Foundation of Korea (Grant No. 2017R1A2B2004483) and the DGIST R&D Program of the Ministry of Science and ICT (Grant No. 19-BD-0402).