Review
. 2019 Aug 27;20(17):4186.
doi: 10.3390/ijms20174186.

Structure Determination by Single-Particle Cryo-Electron Microscopy: Only the Sky (and Intrinsic Disorder) is the Limit

Affiliations
Review

Structure Determination by Single-Particle Cryo-Electron Microscopy: Only the Sky (and Intrinsic Disorder) is the Limit

Emeka Nwanochie et al. Int J Mol Sci. .

Abstract

Traditionally, X-ray crystallography and NMR spectroscopy represent major workhorses of structural biologists, with the lion share of protein structures reported in protein data bank (PDB) being generated by these powerful techniques. Despite their wide utilization in protein structure determination, these two techniques have logical limitations, with X-ray crystallography being unsuitable for the analysis of highly dynamic structures and with NMR spectroscopy being restricted to the analysis of relatively small proteins. In recent years, we have witnessed an explosive development of the techniques based on Cryo-electron microscopy (Cryo-EM) for structural characterization of biological molecules. In fact, single-particle Cryo-EM is a special niche as it is a technique of choice for the structural analysis of large, structurally heterogeneous, and dynamic complexes. Here, sub-nanometer atomic resolution can be achieved (i.e., resolution below 10 Å) via single-particle imaging of non-crystalline specimens, with accurate 3D reconstruction being generated based on the computational averaging of multiple 2D projection images of the same particle that was frozen rapidly in solution. We provide here a brief overview of single-particle Cryo-EM and show how Cryo-EM has revolutionized structural investigations of membrane proteins. We also show that the presence of intrinsically disordered or flexible regions in a target protein represents one of the major limitations of this promising technique.

Keywords: 3D-structure; Cryo-electron microscopy; Intrinsically disordered protein; NMR spectroscopy; X-ray crystallography; intrinsically disordered region; protein structure; single-particle Cryo-EM; structural analysis; structural biology.


Conflict of interest statement

The authors declare no conflict of interest.

Figures

Figure 1
Figure 1
Basic workflow of Cryo-Electron Microscopy (Cryo-EM). Image collected at low dose electron can be analyzed by single-particle or sub-tomogram averaging. However, samples must be vitrified by flash-freezing.
Figure 2
Figure 2
Structural characterization of rabbit RyR1 by single-particle cryo-EM (protein data bank (PDB) ID: 5T15) and a set of commonly used predictors of intrinsic disorder. (A). Side view of the channel in a space-fill representation. (B). Membrane-side view of the channel in a space-fill representation. (C). Cytoplasmic-side view of the channel in a space-fill representation. (D). Side view of the channel in a cartoon representation. (E). Membrane-side view of the channel in a cartoon representation. (F). Cytoplasmic-side view of the channel in a cartoon representation. In these plots, the chains are colored using the rainbow schema of the PDB 3D-viewer (where the N- and C-terminal regions are colored blue and red, respectively). (G). Evaluation of the intrinsic disorder propensity of rabbit RyR1 (UniProt ID: P11716) by a set of commonly used disorder predictors. Presented disorder profiles were generated by PONDR-FIT (pink curve), PONDR® VLXT (black curve), PONDR® VSL2 (green curve), and PONDR® VL3 (red curve) [106,107,108,109,110,111], as well as two tools from the IUPred web server for predicting short and long disordered regions (blue and yellow curves, respectively) [112]. The dark cyan dashed line shows the mean disorder propensity calculated by averaging the disorder profiles of the individual predictors. The light pink shadow around the PONDR® FIT shows error distribution, whereas the light cyan shadow around the mean disorder curve reflects the distribution of standard deviations. Light gray bars show positions of structurally uncharacterized regions. In these analyses, the predicted intrinsic disorder scores above 0.5 are considered to correspond to the disordered residues/regions, whereas regions with disorder scores between 0.2 and 0.5 are considered flexible.
Figure 3
Figure 3
Single-particle cryo-EM-based structural characterization of the eubacterial and eukaryotic vacuolar-type ATPases (V-ATPases) from Thermus thermophiles ((A). PDB ID: 5GAR, [123]) and Saccharomyces cerevisiae ((B). PDB ID: 3J9T, [124]), respectively.
Figure 4
Figure 4
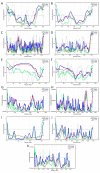
Intrinsic disorder status of the protomers of the V-ATPase from Saccharomyces cerevisiae evaluated by PONDR-FIT (green curves), PONDR® VLXT (gray curves), PONDR® VSL2 (blue curves), and PONDR® VL3 (red curves) [106,107,108,109,110,111]. (A). V-type proton ATPase subunit D (UniProt ID: P32610, predicted disorder content (PDC) 47.3%); (B). V-type proton ATPase subunit F (UniProt ID: P39111, PDC = 22.9%); (C). V-type proton ATPase catalytic subunit A (UniProt ID: P17255, PDC = 20.6%); (D). V-type proton ATPase subunit B (UniProt ID: P16140, PDC = 17.9%); (E). V-type proton ATPase subunit G (UniProt ID: P48836, PDC = 67.3%); (F). V-type proton ATPase subunit E (UniProt ID: P22203, PDC = 50.8%); (G). V-type proton ATPase subunit H (UniProt ID: P41807, PDC = 17.0%); (H). V-type proton ATPase subunit a, vacuolar isoform (UniProt ID: P32563, PDC = 12.5%); (I). V-type proton ATPase subunit c (UniProt ID: P25515, PDC = 3.1%); (J). V-type proton ATPase subunit d (UniProt ID: P32366, PDC = 12.3%); (K). V-type proton ATPase subunit C (UniProt ID: P31412, PDC = 13.2%).
Figure 5
Figure 5
Three projections of the 3D structure of the deletion mutant of rat TRPV1 resolved by single-particle cryo-EM (PDB ID: 5IRZ, [133]): (A). Cytoplasm view; (B). Membrane view; and (C). Side view. (D). Evaluation of the intrinsic disorder propensity of the full-length rat TRPV1 (UniProt ID: O35433) by a set of commonly used disorder predictors. Presented disorder profiles were generated by PONDR-FIT (pink curve), PONDR® VLXT (black curve), PONDR® VSL2 (green curve), and PONDR® VL3 (red curve) [106,107,108,109,110,111], as well as two tools from the IUPred web server for predicting short and long disordered regions (blue and yellow curves, respectively) [112]. The dark cyan dashed line shows the mean disorder propensity calculated by averaging the disorder profiles of the individual predictors. The light pink shadow around the PONDR® FIT shows error distribution, whereas the light cyan shadow around the mean disorder curve reflects the distribution of the standard deviations. In these analyses, the predicted intrinsic disorder scores above 0.5 are considered to correspond to the disordered residues/regions, whereas regions with disorder scores between 0.2 and 0.5 are considered flexible.
Figure 6
Figure 6
Three projections of the 3D structure of the homo-tetrameric Slo2.2 Na+-activated K+ channel (chicken KCNT1) resolved by single-particle cryo-EM (PDB ID: 5U70, [144]): (A). Cytoplasm view; (B). Membrane view; and (C). Side view. (D). Evaluation of the intrinsic disorder propensity of the chicken KCNT1 (UniProt ID: Q8QFV0) by a set of commonly used disorder predictors. Presented disorder profiles were generated by PONDR-FIT (pink curve), PONDR® VLXT (black curve), PONDR® VSL2 (green curve), and PONDR® VL3 (red curve) [106,107,108,109,110,111], as well as two tools from the IUPred web server for predicting short and long disordered regions (blue and yellow curves, respectively) [112]. The dark cyan dashed line shows the mean disorder propensity calculated by averaging the disorder profiles of the individual predictors. The light pink shadow around the PONDR® FIT shows the error distribution, whereas the light cyan shadow around the mean disorder curve reflects the distribution of the standard deviations. The light gray bars show positions of structurally uncharacterized regions. In these analyses, the predicted intrinsic disorder scores above 0.5 are considered to correspond to the disordered residues/regions, whereas regions with disorder scores between 0.2 and 0.5 are considered flexible.

Similar articles

Cited by

References

    1. Egelman E.H. The current revolution in cryo-em. Biophys. J. 2016;110:1008–1012. doi: 10.1016/j.bpj.2016.02.001. - DOI - PMC - PubMed
    1. Babu M.M. The contribution of intrinsically disordered regions to protein function, cellular complexity, and human disease. Biochem. Soc. Trans. 2016;44:1185–1200. doi: 10.1042/BST20160172. - DOI - PMC - PubMed
    1. Uversky V.N. P53 proteoforms and intrinsic disorder: An illustration of the protein structure-function continuum concept. Int. J. Mol. Sci. 2016;17:1874. doi: 10.3390/ijms17111874. - DOI - PMC - PubMed
    1. DeForte S., Uversky V.N. Order, disorder, and everything in between. Molecules. 2016;21:1090. doi: 10.3390/molecules21081090. - DOI - PMC - PubMed
    1. Uversky V.N. Dancing protein clouds: The strange biology and chaotic physics of intrinsically disordered proteins. J. Biol. Chem. 2016;291:6681–6688. doi: 10.1074/jbc.R115.685859. - DOI - PMC - PubMed

MeSH terms

Substances

LinkOut - more resources