Regulation of mitochondrial fragmentation in microvascular endothelial cells isolated from the SU5416/hypoxia model of pulmonary arterial hypertension
- PMID: 31461316
- PMCID: PMC6879901
- DOI: 10.1152/ajplung.00396.2018
Regulation of mitochondrial fragmentation in microvascular endothelial cells isolated from the SU5416/hypoxia model of pulmonary arterial hypertension
Abstract
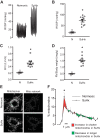
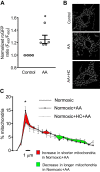
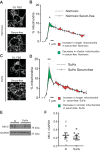
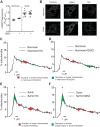
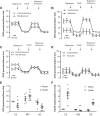
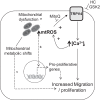
Pulmonary arterial hypertension (PAH) is a morbid disease characterized by progressive right ventricle (RV) failure due to elevated pulmonary artery pressures (PAP). In PAH, histologically complex vaso-occlusive lesions in the pulmonary vasculature contribute to elevated PAP. However, the mechanisms underlying dysfunction of the microvascular endothelial cells (MVECs) that comprise a significant portion of these lesions are not well understood. We recently showed that MVECs isolated from the Sugen/hypoxia (SuHx) rat experimental model of PAH (SuHx-MVECs) exhibit increases in migration/proliferation, mitochondrial reactive oxygen species (ROS; mtROS) production, intracellular calcium levels ([Ca2+]i), and mitochondrial fragmentation. Furthermore, quenching mtROS with the targeted antioxidant MitoQ attenuated basal [Ca2+]i, migration and proliferation; however, whether increased mtROS-induced [Ca2+]i entry affected mitochondrial morphology was not clear. In this study, we sought to better understand the relationship between increased ROS, [Ca2+]i, and mitochondrial morphology in SuHx-MVECs. We measured changes in mitochondrial morphology at baseline and following inhibition of mtROS, with the targeted antioxidant MitoQ, or transient receptor potential vanilloid-4 (TRPV4) channels, which we previously showed were responsible for mtROS-induced increases in [Ca2+]i in SuHx-MVECs. Quenching mtROS or inhibiting TRPV4 attenuated fragmentation in SuHx-MVECs. Conversely, inducing mtROS production in MVECs from normoxic rats (N-MVECs) increased fragmentation. Ca2+ entry induced by the TRPV4 agonist GSK1017920A was significantly increased in SuHx-MVECs and was attenuated with MitoQ treatment, indicating that mtROS contributes to increased TRPV4 activity in SuHx-MVECs. Basal and maximal respiration were depressed in SuHx-MVECs, and inhibiting mtROS, but not TRPV4, improved respiration in these cells. Collectively, our data show that, in SuHx-MVECs, mtROS production promotes TRPV4-mediated increases in [Ca2+]i, mitochondrial fission, and decreased mitochondrial respiration. These results suggest an important role for mtROS in driving MVEC dysfunction in PAH.
Keywords: PAH; calcium; endothelium; mitochondria.
Conflict of interest statement
No conflicts of interest, financial or otherwise, are declared by the authors.
Figures



Similar articles
-
Reactive oxygen species induced Ca2+ influx via TRPV4 and microvascular endothelial dysfunction in the SU5416/hypoxia model of pulmonary arterial hypertension.Am J Physiol Lung Cell Mol Physiol. 2018 May 1;314(5):L893-L907. doi: 10.1152/ajplung.00430.2017. Epub 2018 Feb 1. Am J Physiol Lung Cell Mol Physiol. 2018. PMID: 29388466 Free PMC article.
-
Fatty acid metabolism promotes TRPV4 activity in lung microvascular endothelial cells in pulmonary arterial hypertension.Am J Physiol Lung Cell Mol Physiol. 2024 Mar 1;326(3):L252-L265. doi: 10.1152/ajplung.00199.2023. Epub 2024 Jan 16. Am J Physiol Lung Cell Mol Physiol. 2024. PMID: 38226418
-
Nintedanib improves cardiac fibrosis but leaves pulmonary vascular remodelling unaltered in experimental pulmonary hypertension.Cardiovasc Res. 2019 Feb 1;115(2):432-439. doi: 10.1093/cvr/cvy186. Cardiovasc Res. 2019. PMID: 30032282
-
Mitochondrial metabolism, redox signaling, and fusion: a mitochondria-ROS-HIF-1alpha-Kv1.5 O2-sensing pathway at the intersection of pulmonary hypertension and cancer.Am J Physiol Heart Circ Physiol. 2008 Feb;294(2):H570-8. doi: 10.1152/ajpheart.01324.2007. Epub 2007 Dec 14. Am J Physiol Heart Circ Physiol. 2008. PMID: 18083891 Review.
-
Cellular senescence in the pathogenesis of pulmonary arterial hypertension: the good, the bad and the uncertain.Front Immunol. 2024 Aug 2;15:1403669. doi: 10.3389/fimmu.2024.1403669. eCollection 2024. Front Immunol. 2024. PMID: 39156894 Free PMC article. Review.
Cited by
-
Mitochondria-derived Vesicle Packaging as a Novel Therapeutic Mechanism in Pulmonary Hypertension.Am J Respir Cell Mol Biol. 2024 Jan;70(1):39-49. doi: 10.1165/rcmb.2023-0010OC. Am J Respir Cell Mol Biol. 2024. PMID: 37713305 Free PMC article.
-
The Therapeutic Strategies Targeting Mitochondrial Metabolism in Cardiovascular Disease.Pharmaceutics. 2022 Dec 9;14(12):2760. doi: 10.3390/pharmaceutics14122760. Pharmaceutics. 2022. PMID: 36559254 Free PMC article. Review.
-
Oxidative Stress and Antioxidant Therapy in Pulmonary Hypertension.Antioxidants (Basel). 2023 Apr 26;12(5):1006. doi: 10.3390/antiox12051006. Antioxidants (Basel). 2023. PMID: 37237872 Free PMC article. Review.
-
Natural Antioxidants Improve the Vulnerability of Cardiomyocytes and Vascular Endothelial Cells under Stress Conditions: A Focus on Mitochondrial Quality Control.Oxid Med Cell Longev. 2021 Jan 22;2021:6620677. doi: 10.1155/2021/6620677. eCollection 2021. Oxid Med Cell Longev. 2021. Retraction in: Oxid Med Cell Longev. 2023 Dec 29;2023:9828520. doi: 10.1155/2023/9828520 PMID: 33552385 Free PMC article. Retracted. Review.
-
Studying the Pulmonary Endothelium in Health and Disease: An Official American Thoracic Society Workshop Report.Am J Respir Cell Mol Biol. 2024 Oct;71(4):388-406. doi: 10.1165/rcmb.2024-0330ST. Am J Respir Cell Mol Biol. 2024. PMID: 39189891 Free PMC article.
References
-
- Al-Mehdi AB, Pastukh VM, Swiger BM, Reed DJ, Patel MR, Bardwell GC, Pastukh VV, Alexeyev MF, Gillespie MN. Perinuclear mitochondrial clustering creates an oxidant-rich nuclear domain required for hypoxia-induced transcription. Sci Signal 5: ra47, 2012. doi:10.1126/scisignal.2002712. - DOI - PMC - PubMed
Publication types
MeSH terms
Substances
Grants and funding
LinkOut - more resources
Full Text Sources
Research Materials
Miscellaneous

