

Field performance of the malaria highly sensitive rapid diagnostic test in a setting of varying malaria transmission
- PMID: 31455349
- PMCID: PMC6712604
- DOI: 10.1186/s12936-019-2929-1
Field performance of the malaria highly sensitive rapid diagnostic test in a setting of varying malaria transmission
Abstract
Background: The Gambia has successfully reduced malaria transmission. The human reservoir of infection could further decrease if malaria-infected individuals could be identified by highly sensitive, field-based, diagnostic tools and then treated.
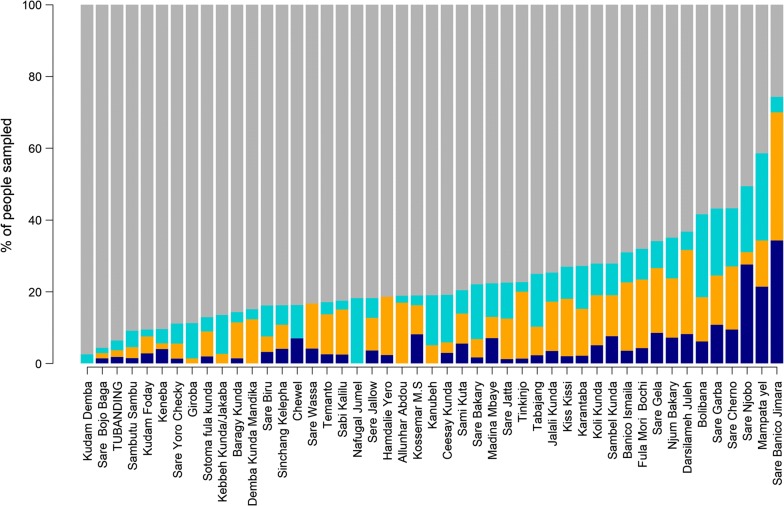
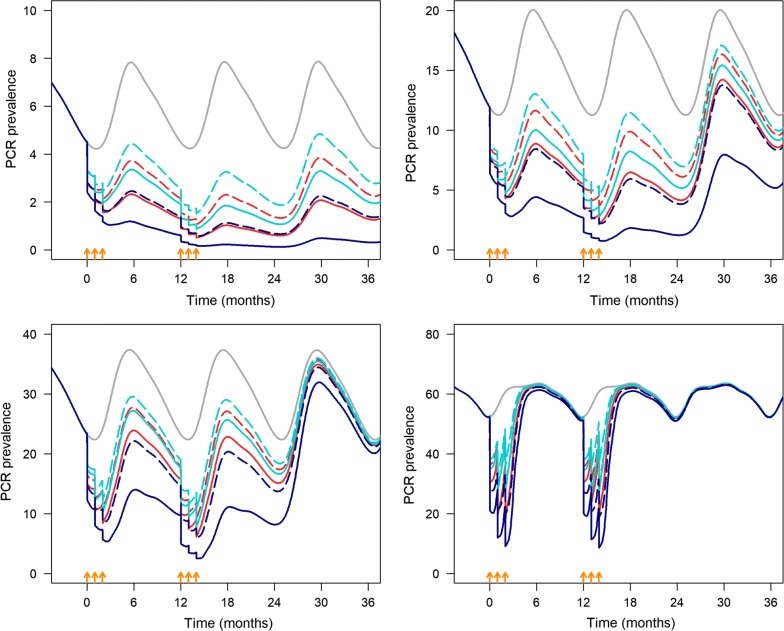
Methods: A cross-sectional survey was done at the peak of the 2017 malaria season in 47 Gambian villages. From each village, 100 residents were randomly selected for finger-prick blood samples to detect Plasmodium falciparum infections using highly sensitive rapid diagnostic tests (HS-RDT) and PCR. The sensitivity and specificity of the HS-RDT were estimated (assuming PCR as the gold standard) across varying transmission intensities and in different age groups. A deterministic, age-structured, dynamic model of malaria transmission was used to estimate the impact of mass testing and treatment (MTAT) with HS-RDT in four different scenarios of malaria prevalence by PCR: 5, 15, 30, and 60%, and with seasonal transmission. The impact was compared both to MTAT with conventional RDT and mass drug administration (MDA).
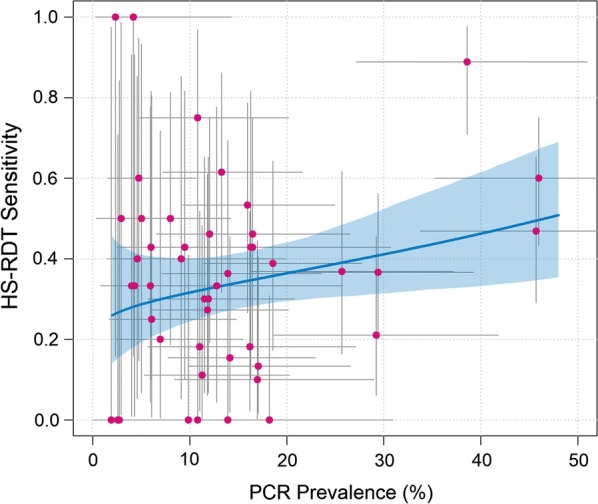
Results: Malaria prevalence by HS-RDT was 15% (570/3798; 95% CI 13.9-16.1). The HS-RDT sensitivity and specificity were 38.4% (191/497, 95% CI 34.2-42.71) and 88.5% (2922/3301; 95% CI 87.4-89.6), respectively. Sensitivity was the highest (50.9%, 95% CI 43.3-58.5%) in high prevalence villages (20-50% by PCR). The model predicted that in very low transmission areas (≤ 5%), three monthly rounds of MTAT with HS-RDT, starting towards the end of the dry season and testing 65 or 85% of the population for 2 consecutive years, would avert 62 or 78% of malaria cases (over 2 years), respectively. The effect of the intervention would be lower in a moderate transmission setting. In all settings, MDA would be superior to MTAT with HS-RDT which would be superior to MTAT with conventional RDT.
Conclusion: The HS-RDT's field sensitivity was modest and varied by transmission intensity. In low to very low transmission areas, three monthly rounds per year of MTAT with HS-RDT at 85% coverage for 2 consecutive years would reduce malaria prevalence to such low levels that additional strategies may achieve elimination. The model prediction would need to be confirmed by cluster-randomized trials.
Keywords: Highly sensitive rapid diagnostic test; Malaria; Mass testing and treatment; Plasmodium falciparum; Transmission areas.
Conflict of interest statement
The authors declare that they have no competing interests.
Figures


Similar articles
-
Comparison of detection methods to estimate asexual Plasmodium falciparum parasite prevalence and gametocyte carriage in a community survey in Tanzania.Malar J. 2014 Nov 18;13:433. doi: 10.1186/1475-2875-13-433. Malar J. 2014. PMID: 25404207 Free PMC article.
-
Detection of a substantial number of sub-microscopic Plasmodium falciparum infections by polymerase chain reaction: a potential threat to malaria control and diagnosis in Ethiopia.Malar J. 2013 Oct 3;12:352. doi: 10.1186/1475-2875-12-352. Malar J. 2013. PMID: 24090230 Free PMC article.
-
Mass testing and treatment for malaria followed by weekly fever screening, testing and treatment in Northern Senegal: feasibility, cost and impact.Malar J. 2020 Jul 14;19(1):252. doi: 10.1186/s12936-020-03313-6. Malar J. 2020. PMID: 32664939 Free PMC article.
-
Malaria in pregnancy (MiP) studies assessing the clinical performance of highly sensitive rapid diagnostic tests (HS-RDT) for Plasmodium falciparum detection.Malar J. 2023 Feb 20;22(1):60. doi: 10.1186/s12936-023-04445-1. Malar J. 2023. PMID: 36803858 Free PMC article. Review.
-
Malaria elimination in Ghana: recommendations for reactive case detection strategy implementation in a low endemic area of Asutsuare, Ghana.Malar J. 2024 Jan 2;23(1):5. doi: 10.1186/s12936-023-04792-z. Malar J. 2024. PMID: 38167067 Free PMC article. Review.
Cited by
-
An Optimized Real-Time qPCR Method for the Effective Detection of Human Malaria Infections.Diagnostics (Basel). 2021 Apr 21;11(5):736. doi: 10.3390/diagnostics11050736. Diagnostics (Basel). 2021. PMID: 33919020 Free PMC article.
-
Asymptomatic malaria infection, associated factors and accuracy of diagnostic tests in a historically high transmission setting in Northern Uganda.Malar J. 2022 Dec 23;21(1):392. doi: 10.1186/s12936-022-04421-1. Malar J. 2022. PMID: 36550492 Free PMC article.
-
Validation study of Boil & Spin Malachite Green Loop Mediated Isothermal Amplification (B&S MG-LAMP) versus microscopy for malaria detection in the Peruvian Amazon.PLoS One. 2021 Oct 25;16(10):e0258722. doi: 10.1371/journal.pone.0258722. eCollection 2021. PLoS One. 2021. PMID: 34695122 Free PMC article.
-
Towards the use of a smartphone imaging-based tool for point-of-care detection of asymptomatic low-density malaria parasitaemia.Malar J. 2021 Sep 25;20(1):380. doi: 10.1186/s12936-021-03894-w. Malar J. 2021. PMID: 34563189 Free PMC article.
-
Overdiagnosis of Malaria Illness in an Endemic Setting: A Facility-Based Surveillance Study in Malawi.Am J Trop Med Hyg. 2021 May 3;104(6):2123-2130. doi: 10.4269/ajtmh.20-1209. Am J Trop Med Hyg. 2021. PMID: 33939628 Free PMC article.
References
-
- WHO . World malaria report. Geneva: World Health Organization; 2018.
-
- Ministry of Health and Social Welfare, Republic of The Gambia. Malaria Indicator Survey 2017. 2018.
MeSH terms
Grants and funding
LinkOut - more resources
Full Text Sources
Medical
