A descriptive guide for absolute quantification of produced shRNA pseudotyped lentiviral particles by real-time PCR
- PMID: 31453218
- PMCID: PMC6706118
- DOI: 10.14440/jbm.2016.142
A descriptive guide for absolute quantification of produced shRNA pseudotyped lentiviral particles by real-time PCR
Erratum in
-
Corrigendum: A descriptive guide for absolute quantification of produced shRNA pseudotyped lentiviral particles by real-time PCR.J Biol Methods. 2019 Dec 16;6(4):e122. doi: 10.14440/jbm.2019.326. eCollection 2019. J Biol Methods. 2019. PMID: 31976349 Free PMC article.
Abstract
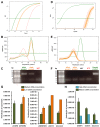
Gene silencing techniques, including RNA interference methodologies, are widely used in reverse genetics to study the role of specific genes in biological processes. RNA interference has become easier to implement thanks to the RNAi Consortium (TRC), which has developed libraries of short hairpin RNA (shRNA) sequences in pseudotyped lentiviral particles capable of targeting most genes in the human and mouse genomes. However, a problem is the lack of a simple method to titrate the homemade lentiviral particle product, making it difficult to optimize and standardize shRNA experiments. Here we provide a guide describing a quick, non-laborious and reliable method for the titration of TRC pseudotyped lentiviral particles that is based on the detection and measurement of viral RNA using quantitative PCR. Our data demonstrate that purified linearized shRNA plasmids represent more suitable standards than circular or unpurified linearized plasmids. We also show that for precise absolute quantification, it is important to determine suitable plasmid and viral cDNA concentrations in order to find the linear range for quantification, as well as to reduce inhibition and primer dimer amplification. Finally, we show that the lentivirus concentration impacts the level of knockdown in transduced cells. Primers utilized in this non-functional titration can potentially be applied to functional titration of proviral DNA copies or transgene expression, overcoming problems arising from the absence of fluorescent reporter genes in TRC plasmids.
Keywords: RT-qPCR; absolute quantification; lentiviral particle titer; shRNA; the RNAi Consortium.
Conflict of interest statement
The authors have declared that no competing interests exist.
Figures


Similar articles
-
Depressing time: Waiting, melancholia, and the psychoanalytic practice of care.In: Kirtsoglou E, Simpson B, editors. The Time of Anthropology: Studies of Contemporary Chronopolitics. Abingdon: Routledge; 2020. Chapter 5. In: Kirtsoglou E, Simpson B, editors. The Time of Anthropology: Studies of Contemporary Chronopolitics. Abingdon: Routledge; 2020. Chapter 5. PMID: 36137063 Free Books & Documents. Review.
-
Healthcare workers' informal uses of mobile phones and other mobile devices to support their work: a qualitative evidence synthesis.Cochrane Database Syst Rev. 2024 Aug 27;8(8):CD015705. doi: 10.1002/14651858.CD015705.pub2. Cochrane Database Syst Rev. 2024. PMID: 39189465 Free PMC article.
-
Defining the optimum strategy for identifying adults and children with coeliac disease: systematic review and economic modelling.Health Technol Assess. 2022 Oct;26(44):1-310. doi: 10.3310/ZUCE8371. Health Technol Assess. 2022. PMID: 36321689 Free PMC article.
-
Unlocking data: Decision-maker perspectives on cross-sectoral data sharing and linkage as part of a whole-systems approach to public health policy and practice.Public Health Res (Southampt). 2024 Nov 20:1-30. doi: 10.3310/KYTW2173. Online ahead of print. Public Health Res (Southampt). 2024. PMID: 39582242
-
Trends in Surgical and Nonsurgical Aesthetic Procedures: A 14-Year Analysis of the International Society of Aesthetic Plastic Surgery-ISAPS.Aesthetic Plast Surg. 2024 Oct;48(20):4217-4227. doi: 10.1007/s00266-024-04260-2. Epub 2024 Aug 5. Aesthetic Plast Surg. 2024. PMID: 39103642 Review.
Cited by
-
Establishment of a pseudovirus neutralization assay based on SARS-CoV-2 S protein incorporated into lentiviral particles.Biosaf Health. 2022 Feb;4(1):38-44. doi: 10.1016/j.bsheal.2021.12.006. Epub 2022 Jan 3. Biosaf Health. 2022. PMID: 35005601 Free PMC article.
References
-
- Lizée G., Aerts J. L., Gonzales M. I., Chinnasamy N., Morgan R. A., et al. Realtime quantitative reverse transcriptase-polymerase chain reaction as a method for determining lentiviral vector titers and measuring transgene expression. Hum Gene Ther. 2003;14:497–507. doi: 10.1089/104303403764539387. PMID: 12718761. - DOI - PubMed
Grants and funding
LinkOut - more resources
Full Text Sources
