. 2019 Aug 21;10(1):3758.
doi: 10.1038/s41467-019-11674-z.

Sustained microglial depletion with CSF1R inhibitor impairs parenchymal plaque development in an Alzheimer's disease model

Affiliations

Sustained microglial depletion with CSF1R inhibitor impairs parenchymal plaque development in an Alzheimer's disease model

Elizabeth Spangenberg et al. Nat Commun. .

Abstract

Many risk genes for the development of Alzheimer's disease (AD) are exclusively or highly expressed in myeloid cells. Microglia are dependent on colony-stimulating factor 1 receptor (CSF1R) signaling for their survival. We designed and synthesized a highly selective brain-penetrant CSF1R inhibitor (PLX5622) allowing for extended and specific microglial elimination, preceding and during pathology development. We find that in the 5xFAD mouse model of AD, plaques fail to form in the parenchymal space following microglial depletion, except in areas containing surviving microglia. Instead, Aβ deposits in cortical blood vessels reminiscent of cerebral amyloid angiopathy. Altered gene expression in the 5xFAD hippocampus is also reversed by the absence of microglia. Transcriptional analyses of the residual plaque-forming microglia show they exhibit a disease-associated microglia profile. Collectively, we describe the structure, formulation, and efficacy of PLX5622, which allows for sustained microglial depletion and identify roles of microglia in initiating plaque pathogenesis.


Conflict of interest statement

P.L.Severson, J.Z., E.A.B., Y.Z., W.S., J.L., G.H., A.R., G.T., J.W., M.N., P.Singh, S.B., P.I., C.Z., G.B., and B.L.W. are employees of Plexxikon Inc.; the remaining authors declare no competing interests.

Figures

Fig. 1
Fig. 1
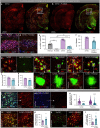
Plaque-distal microglia contain aggregated Aβ. ae 15-month-old 3xTg-AD mice were stained for dense core deposits with Thio-S (in green), and immunolabeled for microglia (IBA1 in red) and macrophage lysosomes (CD68 in blue; a, c, and e) with zoomed image (b) of Thio-S+ material within microglia and within lysosomes, separately. Scale bars = 20 μm for a, e 5 μm for b, 10 μm for c. d, f Three-dimensional reconstruction of microglia (IBA1 in red), the microglial lysosome (CD68 in purple), and fibrillar Aβ (Thio-S in green), demonstrating the localization of Aβ to the microglial lysosome in non-plaque associated microglia. Scale bars = 7 μm. gj 5xFAD animals stained for dense-core deposits (Thio-S in green) and immunolabeled for microglia (IBA1 in red; g and i), with zoomed images (h, j) demonstrating Thio-S+ aggregates in microglial cell bodies in 4- and 7-month-old 5xFAD mice. Scale bars = 40 μm for g, i 10 μm for h, j
Fig. 2
Fig. 2
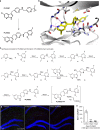
Design and synthesis schematic of the CSF1R inhibitor PLX5622 for extended microglial elimination. a Chemical structure of selective CSF1R inhibitor PLX5622. PLX5622 is structurally similar to CSF1R/KIT/FLT3 inhibitor PLX3397 with modifications concentrated on the two pyridine moieties. b X-ray crystal structure of the CSF1R-PLX5622 complex. PLX5622 is anchored to the active site of CSF1R by 3 hydrogen bonds (indicated by dashed lines). 7-Azaindole of PLX5622 forms two hydrogen bonds with the hinge region of CSF1R whereas the central pyridine ring forms a hydrogen bond with the main chain amino group of Phe796. The CSF1R selectivity is largely determined by the interaction between PLX5622 and Gly795 (represented as a sphere), which is a bulkier residue (cysteine) in KIT and FLT3. The substitutions on the tail pyridine ring also contribute to the selectivity. This group displaces the juxatemembrane (JM) region (absent in the structure) from the allosteric site. In contrast, PLX3397 binds CSF1R in the presence of the JM region. c Synthesis schematic for PLX5622 and subsequent formation of PLX5622-fumaric acid salt. PLX5622 was synthesized from commercially available 2-amino-6-fluoropyridine (1), 5-fluoro-2-methoxypyridine-3-carbaldehyde (2), and 3-iodo-5-methyl-1-(triisopropylsilyl)-1H-pyrrolo[2,3-b]pyridine (7) using the reaction scheme. d Immunolabeling of microglia (IBA1 in green) and cell nuclei (DAPI in blue) of two-month-old animals treated with control or 1200 ppm PLX5622-formulated chow. Scale bar = 75 μm. E, Quantification of hippocampal microglial number over 5 days of treatment with PLX5622 (p < 0.001 for 3d and 5d). Two-way ANOVA with Dunnet’s post hoc test. n = 3 for Control, n = 3 for 3d PLX5622, n = 3 for 5d PLX5622. Statistical significance is denoted by ***p < 0.001. Error bars indicate SEM
Fig. 3
Fig. 3
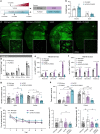
Extended elimination of microglia does not induce peripheral leukocyte or behavioral abnormalities. 1.5-month-old wild-type (WT) or 5xFAD mice were treated with control chow or PLX5622 for 10 or 24 weeks. a Experimental design. b Terminal PK of PLX5622 and 5xFAD + PLX5622 groups. Two-tailed independent t-test. n = 5–6 for PLX5622, n = 8–11 for 5xFAD + PLX5622. c Hemisphere stitches of microglia (IBA1 in green) in the 7-month-old cohort. Scale bar = 1000 μm. d Analysis of different subsets of leukocytes (CD11b, p = 0.059; CD19, p = 0.052; all others NS). Two-tailed independent t-test; n = 4–5 for Wild-type, n = 3–4 for PLX5622. ef All analyses listed in respective order for retrosplenial (RS) cortex, somatosensory (SS) cortex, and thalamus. Microglial number in 4 e and 7 f month-old cohorts (4-month cohort: WT v 5xFAD, p = 0.001, NS, p < 0.001; WT v PLX5622, p < 0.001, p < 0.001, p = 0.044; 5xFAD v 5xFAD + PLX5622, p < 0.001, p < 0.001, p < 0.001. 7-month cohort: WT v 5xFAD, p = 0.015, p = 0.024, p < 0.001; WT v PLX5622, p < 0.001 for all regions; 5xFAD v 5xFAD + PLX5622, p < 0.001 for all regions). Two-way ANOVA with Tukey’s post hoc test; n = 4–6 for Wild-type, n = 4–6 for PLX5622, n = 5–8 for 5xFAD, n = 6–9 for 5xFAD + PLX5622. gh Measurements for anxiety were performed by Elevated Plus Maze (EPM) and quantified as number of arm entries (g WT v 5xFAD, NS (open) and p = 0.050 (closed); PLX5622 v 5xFAD + PLX5622, p = 0.007 (open) and p < 0.001 (closed), 5xFAD v 5xFAD + PL5622, NS (open) and p = 0.056 (closed)) and time in arms (h WT v 5xFAD, p = 0.0157 (open) and p = 0.046 (closed); PLX5622 v 5xFAD + PLX5622, p < 0.001 (open) and p < 0.001 (closed); 5xFAD v 5xFAD + PLX5622, p < 0.001 (open), p < 0.020 (closed)). i Mean latencies to a hidden platform from the Morris water maze (MWM) acquisition trials. jk Number of platform entries (j; PLX5622 v 5xFAD + PLX5622, p = 0.071) and time in platform zone (k; WT v PLX5622, p = 0.094; PLX5622 v 5xFAD + PLX5622, p = 0.073) in the MWM probe trial. For all behavioral analyses: Two-way ANOVA with Tukey’s post hoc test; n = 8–12 for Wild-type, n = 8–12 for PLX5622, n = 9–12 for 5xFAD, n = 8–9 for 5xFAD + PLX5622. Statistical significance is denoted by *p < 0.05, **p < 0.01, and ***p < 0.001. Statistical trends are denoted by #p < 0.10. NS, not significant (p > 0.10). Error bars indicate SEM
Fig. 4
Fig. 4
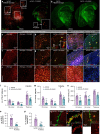
Long-term elimination of microglia in 5xFAD mice reduces plaque number and volume and is accompanied by cerebral amyloid angiopathy (CAA) onset. All analyses listed in respective order for retrosplenial (RS) cortex, somatosensory (SS) cortex, and thalamus. a Representative hemisphere stitches of dense-core deposits (Thioflavin-S (Thio-S) in green) and microglia (IBA1 in red). Scale bar = 1000 μm. b Representative images of brain hemispheres stained with Thio-S, illustrating the appearance of cerebral amyloid angiopathy (CAA) throughout the cortex of 5xFAD mice devoid of microglia. Scale bar = 1000 μm. cd, f, g, i, j Confocal images of sections from 10 week treated animals stained for dense-core plaques (Thio-S in green) and immunolabeled for microglia (IBA1 in red). Scale bar = 100 μm. e, h, k Images from 24 week treated animals stained for dense-core plaques (Thio-S in green) and immunolabeled for microglia (IBA1 in red) and diffuse plaques (6E10 in blue). Scale bar = 100 μm. l, Quantification of Thio-S plaque number in 4-month-old cohort (p < 0.001, p < 0.001, p = 0.001). Two-tailed independent t-test; n = 7 for 5xFAD, n = 8 for 5xFAD + PLX5622. m Quantification of Thio-S+ plaque number in 7-month-old mice (p = 0.001, p = 0.004, p = 0.041). Two-tailed independent t-test; n = 7–8 for 5xFAD, n = 5–6 for 5xFAD + PLX5622. N, Plaque volumes in 7-month-old mice (p = 0.003, NS, p = 0.007). Two-tailed independent t-test; n = 7–8 for 5xFAD, n = 5–6 for 5xFAD + PLX5622. O-P, Quantification of 6E10 (p = 0.002) and pyroglutamate-3-modified Aβ (p = 0.008) in the cortex of 7-month-old animals. Two-tailed independent t-test; n = 4–5 for 5xFAD, n = 4–5 for 5xFAD + PLX5622. qs, 7-month-old PLX5622-treated 5xFAD animals stained for dense core deposits (Thio-S in green) and immunolabeled for oligomeric Aβ (A11), protofibrillar Aβ (OC) and Aβ1−42, respectively. Scale bar = 25 μm. Statistical significance is denoted by *p < 0.05, **p < 0.01, and ***p < 0.001. NS, not significant (p > 0.10). Error bars indicate SEM
Fig. 5
Fig. 5
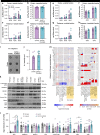
No detectable alterations in Aβ levels or APP processing with microglia elimination in 5xFAD mice. ah Aβ levels from cortical (ab, ef) or thalamic brain homogenates (cd, gh) from 5xFAD mice treated with vehicle or PLX5622 (1200 ppm in chow) from 1.5 months of age to either 4 (ad), or 7 (eh) months of age, for both the detergent-soluble and insoluble fractions. In the 4-month-old mice, insoluble Aβ1–38 and Aβ1–40 were below detection threshold. In the 7-month-old mice, insoluble Aβ levels were plotted on log(10) scale and insoluble Aβ1–38 was below detection threshold. Two-tailed independent t-test. For 4-month-old cohort: n = 7 for 5xFAD, n = 9 for 5xFAD + PLX5622. For 7-month-old cohort: n = 7 for 5xFAD, n = 8 for 5xFAD + PLX5622. ij Cortical homogenates of 7-month-old mice immunoprobed and quantified, respectively, for A11. Two-tailed independent t-test; n = 7 for 5xFAD, n = 8 for 5xFAD + PLX5622. Source data are provided as a Source Data file. kl Levels of components of the amyloid-precursor protein (APP) processing pathway in cortical homogenates from 7-month-old animals (Full length APP: WT v 5xFAD, p = 0.001; PLX5622 v 5xFAD v PLX5622, p < 0.001; 5xFAD v 5xFAD + PLX5622; p = 0.020. C83: WT v 5xFAD, p < 0.001; PLX5622 v 5xFAD v PLX5622, p < 0.001. C99: WT v 5xFAD, p = 0.015; PLX5622 v 5xFAD v PLX5622 p < 0.001). Two-way ANOVA with Tukey’s post hoc test; n = 8 for Wild-type, n = 8 for PLX5622, n = 8 for 5xFAD, n = 8 for 5xFAD + PLX5622. Source data are provided as a Source Data file. M, Left panel - heatmap of log(2) fold change of genes associated with AD, including APP/Aβ production and metabolism shown for each of the 9 comparisons and the 6 comparisons between brain regions. Right panel – heatmap of the corresponding p-values for each of the comparisons. Log(2) fold change and p-values indicated by respective scale bar. n = 4 for all groups. Error bars indicate SEM
Fig. 6
Fig. 6
Microglia facilitate plaque formation and compaction. a, b, Representative hemisphere stitches of 5xFAD and 5xFAD + PLX5622 mice stained for dense-core plaques (Thio-S in green) and immunolabeled for microglia (IBA1 in red). Scale bar = 1000 μm. c, d Confocal images of subicula stained with Thio-S for dense core plaques (green) and immunolabeled with IBA1 for microglia (red) and 6E10 for diffuse plaques (blue). Scale bar = 75 μm. e Quantification of IBA1+ cells in the subiculum (WT v 5xFAD, p < 0.001; WT v PLX5622, p < 0.001; PLX5622 v. 5xfAD + PLX5622, p = 0.002; 5xFAD v 5xFAD + PLX5622, p < 0.001). Two-way ANOVA with Tukey’s post hoc test; n = 7 for Wild-type, n = 6 for PLX5622, n = 6 for 5xFAD, n = 6 for 5xFAD + PLX5622. f, Plaque number within the subiculum is reduced by 33% in 5xFAD + PLX5622 mice compared to 5xFAD animals (p < 0.001). Two-tailed independent t-test; n = 6 for 5xFAD, n = 6 for 5xFAD + PLX5622. gi Confocal images of dense-core plaques (Thio-S in green) and microglia (IBA1 in red) in the cortex, thalamus, and subiculum, respectively, of both 5xFAD groups showing an alteration in plaque morphology with CSF1R inhibitor treatment. Scale bar = 25 μm. Arrows point to zoomed images of dense-core plaques. Scale bar = 10 μm. j, k, Quantification of plaque circularity (j; 5xFAD v 5xFAD + PLX5622, p < 0.001) and Thio-S fluorescence intensity (k; 5xFAD v 5xFAD + PLX5622, p < 0.001). Two-tailed independent t-test; n = 6–7 for 5xFAD, n = 6 for 5xFAD + PLX5622. lm Representative images from 7-month-old cohort immunolabled for ApoE (in red) and microglia (IBA1 in green) and stained for dense-core deposits (Thio-S in blue). Scale bar = 100 μm. n Quantification of ApoE immunoreactivity in plaque cores (cortex: p < 0.001; thalamus: p < 0.001). Two-tailed independent t-test; n = 7–10 for 5xFAD, n = 7 for 5xFAD + PLX5622. or, Immunolabeling and quantification of LAMP1 (o, p; p = 0.020) and APP (q, r; p = 0.068). Two-tailed independent t-test; n = 5 for 5xFAD, n = 4–5 for 5xFAD + PLX5622. Scale bar = 100 μm. Statistical significance is denoted by *p < 0.05, **p < 0.01, and ***p < 0.001. Statistical trends are denoted by #p < 0.10. Error bars indicate SEM
Fig. 7
Fig. 7
Administration of an analogous CSF1R inhibitor, PLX3397 (75 ppm and 600 ppm), to 5xFAD mice. a Experimental design. b Terminal PK of wild-type and 5xFAD groups treated with PLX3397. c, d Confocal images of tissue stained for dense-core plaques (Thio-S in green) and immunolabeled for microglia (IBA1 in red) in 600 ppm PLX3397-treated and control mice. Scale bar = 75 μm. eh Sections of the retrosplenial (RS) and somatosensory (SS) cortex, respectively, stained for dense-core plaques (Thio-S in green) and immunolabeled for microglia (IBA1 in red) in mice treated with control or 75 ppm PLX3397. Scale bar = 75 μm. i Quantification of IBA1+ cell number in the RS and SS cortex. (SS Cortex: PLX5622 v 5xFAD + PLX5622, p = 0.045) Two-way ANOVA with Tukey’s post hoc test; n = 4 for Wild-type, n = 6 for PLX3397, n = 6 for 5xFAD, n = 4 for 5xFAD + PLX3397. jk, Quantification of cortical plaque number and volume, respectively, revealing no change in these measures with 75 ppm PLX3397 treatment in 5xFAD mice. Two-tailed independent t-test; n = 4–5 for 5xFAD, n = 4–5 for 5xFAD + PLX3397. Statistical significance is denoted by *p < 0.05. Statistical trends are denoted by #p < 0.10. Error bars indicate SEM
Fig. 8
Fig. 8
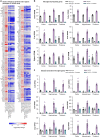
Remaining plaque-forming microglia in the microdissected hippocampus exhibit a DAM expression profile. a All gene expression changes where p < 0.05 for Wild-type (WT) vs. 5xFAD in all three brain regions shown as Log(2) fold change for each gene, for the 9 relevant comparisons (5xFAD vs. WT in cortex, hippocampus, or thalamus, 5xFAD + PLX5622 vs. 5xFAD in cortex, hippocampus, or thalamus, and WT + PLX5622 vs. WT in cortex, hippocampus, or thalamus). b RPKM values shown for a subset of the homeostatic microglial genes from (a), including Csf1r, Cx3cr1, C1qa, Hexb, Siglech, and Spi1. c RPKM values shown for a subset of the disease-associated microglial genes from (a), including Ccl6, Clec7a, Cst7, Ctsd, Ctsz, and Itgax. RPKM values for all genes/brain regions can be found at [https://rnaseq.mind.uci.edu/green/ad_plx/gene_search.php]. n = 4 per group for all analyses. Error bars indicate SEM
Fig. 9
Fig. 9
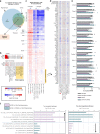
Microglia mediate downregulation of neuronal/plasticity genes in the hippocampus in response to AD pathology. a Venn diagram showing the number of differentially expressed genes (adjusted (adj.) p < 0.05) for cortex, hippocampus, and thalamus for wild-type (WT) vs. 5xFAD mice. b Heatmap of the adj. p-value and log(2) fold change for all 9 comparison groups (5xFAD vs. WT in cortex, hippocampus, or thalamus, 5xFAD + PLX5622 vs. 5xFAD in cortex, hippocampus, or thalamus, and WT + PLX5622 vs. WT in cortex, hippocampus, or thalamus), as well as 3 comparisons between brain regions for both WT and 5xFAD mice, for the transgene components in 5xFAD mice (App, Psen1, Thy1). c Heatmap of all 413 gene expression differences identified in the hippocampus for wild-type vs. 5xFAD, expressed as log (2) fold change, and all 9 comparison groups included. Hippocampus for 5xFAD vs. WT and 5xFAD + PLX5622 vs. 5xFAD highlighted by red border, showing that most significant gene expression changes induced by pathology do not occur in the absence of microglia. d Downregulated genes in the hippocampus from (a), displayed as a heatmap of log(2) fold change differences for all 9 comparisons, showing that the same genes are not downregulated in the absence of microglia (5xFAD + PLX5622 vs. 5xFAD Hip). e RPKM values plotted on a log(2) scale for a subset of plasticity genes from (d). f Five significantly upregulated and downregulated pathways for 5xFAD vs. wild-type hippocampus (red), along with respective -log(10) p-values plotted: most upregulated pathways are related to immune function, while downregulated pathways are mainly associated with neuronal and synaptic activity. The same pathways are displayed for the comparison between 5xFAD + PLX5622 vs. 5xFAD hippocampus (yellow), showing that the absence of microglia prevents the upregulation of immune pathways and the downregulation of synaptic pathways. Expression difference denoted by *. Log(2) fold change and p-values indicated by respective scale bar. n = 4 per group for all analyses. Error bars indicate SEM
Fig. 10
Fig. 10
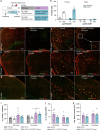
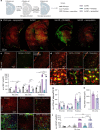
Microglia seed plaques. All analyses listed in respective order for retrosplenial (RS) cortex, somatosensory (SS) cortex, and thalamus. a Experimental design: 1.5-month-old wild-type (WT) and 5xFAD mice were administered PLX5622 (1200 ppm in chow) until 4 months of age. Diet was withdrawn for 1 month to allow microglial repopulation. This figure was created with images adapted from Servier Medical Arts and is licensed under the Creative Commons Attribution 3.0 Unported License [https://creativecommons.org/licenses/by/3.0/]. b Representative hemisphere stitches of sections stained for dense core plaques (Thio-S in green) and immunolabeled for microglia (IBA1 in red). Scale bar = 1000 μm. ce Images of dense-core plaque staining (Thio-S in green) and microglia immunolabeling (IBA1 in red). Scale bar = 100 μm for C,D; 25 μm for E. f, IBA1+ cell number (WT v 5xFAD, p = 0.001, NS, p < 0.001; WT v PLX5622, p < 0.001, p < 0.001, p < 0.001; 5xFAD v 5xFAD + PLX5622, p < 0.001, p < 0.001, p < 0.001; PLX5622 v Repopulation, NS, p = 0.054, p = 0.008; 5xFAD + PLX5622 v 5xFAD + Repopulation, p = 0.006, p < 0.001, p < 0.001; WT v Repopulation, NS, p = 0.002, NS; 5xFAD v 5xFAD + Repopulation, p < 0.001, p < 0.001, p = 0.027; Repopulation v. 5xFAD + Repopulation, NS, NS, p < 0.001). Two-way ANOVA with Tukey’s post hoc test; n = 5 for Wild-type, n = 4 for PLX5622, n = 4 for Wild-type + Repopulation, n = 8 for 5xFAD, n = 9 for 5xFAD + PLX5622, n = 6 for 5xFAD + Repopulation. g Quantification of Thio-S+ plaque number (5xFAD v 5xFAD + PLX5622, p < 0.001, p < 0.001, p = 0.007; 5xFAD + PLX5622 v 5xFAD + Repopulation, p < 0.001, p < 0.001, p = 0.001; 5xFAD v 5xFAD + Repopulation, NS, NS, NS). One-way ANOVA with Tukey’s post hoc test; n = 7 for 5xFAD, n = 9 for 5xFAD + PLX5622, n = 6 for 5xFAD + Repopulation. h Mean cortical plaque volumes (5xFAD v 5xFAD + Repopulation, p = 0.048). Two-tailed independent t-test; n = 7 for 5xFAD, n = 6 for 5xFAD + Repopulation. I Images of dense-core plaques (Thio-S in blue) and astrocytes with GFAP (in green) and S100β (in red). Scale bar = 100 μm. j GFAP+ astrocyte number in the SS cortex (WT v 5xFAD, p = 0.010; 5xFAD v 5xFAD + PLX5622, p = 0.002; 5xFAD + PLX5622 v 5xFAD + Repopulation, p < 0.001; WT + Repopulation v 5xFAD + Repopulation, p < 0.009). Two-way ANOVA with Tukey’s post hoc test; n = 4 for Wild-type, n = 4 for PLX5622, n = 4 for Wild-type + Repopulation, n = 7 for 5xFAD, n = 10 for 5xFAD + PLX5622, n = 6 for 5xFAD + Repopulation. Statistical significance is denoted by *p < 0.05, **p < 0.01, and ***p < 0.001. NS, not significant (p > 0.10). Error bars indicate SEM

Similar articles

Cited by

References

    1. Jack CR, Jr., et al. Tracking pathophysiological processes in Alzheimer’s disease: an updated hypothetical model of dynamic biomarkers. Lancet Neurol. 2013;12:207–216. doi: 10.1016/S1474-4422(12)70291-0. - DOI - PMC - PubMed
    1. Hardy J. The amyloid hypothesis for Alzheimer’s disease: a critical reappraisal. J. Neurochem. 2009;110:1129–1134. doi: 10.1111/j.1471-4159.2009.06181.x. - DOI - PubMed
    1. Karch CM, Goate AM. Alzheimer’s disease risk genes and mechanisms of disease pathogenesis. Biol. Psychiatry. 2015;77:43–51. doi: 10.1016/j.biopsych.2014.05.006. - DOI - PMC - PubMed
    1. Naj AC, et al. Common variants at MS4A4/MS4A6E, CD2AP, CD33 and EPHA1 are associated with late-onset Alzheimer’s disease. Nat. Genet. 2011;43:436–441. doi: 10.1038/ng.801. - DOI - PMC - PubMed
    1. Guerreiro R, et al. TREM2 variants in Alzheimer’s disease. N. Engl. J. Med. 2013;368:117–127. doi: 10.1056/NEJMoa1211851. - DOI - PMC - PubMed

Publication types

MeSH terms

Substances